1. 19th Nov’14 Equity Bazaar
NIFTY
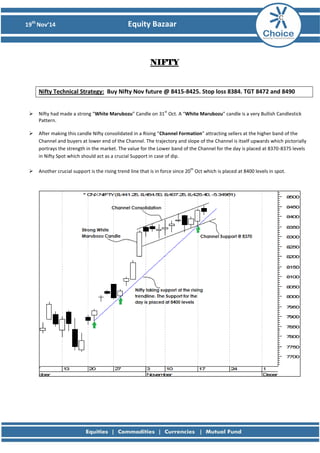
Nifty Technical Strategy: Buy Nifty Nov future @ 8415-8425. Stop loss 8384. TGT 8472 and 8490
Nifty had made a strong “White Marubozu” Candle on 31st Oct. A “White Marubozu” candle is a very Bullish Candlestick Pattern.
After making this candle Nifty consolidated in a Rising “Channel Formation” attracting sellers at the higher band of the Channel and buyers at lower end of the Channel. The trajectory and slope of the Channel is itself upwards which pictorially portrays the strength in the market. The value for the Lower band of the Channel for the day is placed at 8370-8375 levels in Nifty Spot which should act as a crucial Support in case of dip.
Another crucial support is the rising trend line that is in force since 20th Oct which is placed at 8400 levels in spot.
2. 19th Nov’14 Equity Bazaar
Bank Nifty
Bank Nifty Technical Strategy: Buy Bank Nifty Nov future @ 17660-17690. Stop loss 17560. TGT 17820 and 17900
BankNifty is trading in a Rising Channel formation. The low of the Channel is placed @ 17600 levels.
17600-17640 levels have acted as Day High on 12th Nov and 14th Nov, Close on 17th Nov and low on 18th Nov. With 17600- 17640 levels acting as a critical point in 4 out of the last 5 trading sessions, We believe it could probably act as an anchor point for the day too and any dips close to 17600 levels could be used to go long for intraday.
3. 19th Nov’14 Equity Bazaar
Stock of the Day
M&M Technical Strategy: Buy M&M Nov future @ 1265-1268. Stoploss 1250. Tgt 1295 and 1305
M&M has seen “Bullish Harami” and “Bullish engulfing” Candles. Both are strong reversal patterns suggesting that the fall in the stock from above 1400 levels may be over.
The Stock has given a 3 Day high breakout on a day when Nifty ended flat which suggests that the stock has outperformed.
RSI has shown an uptick suggesting Bullish bias in the stock.
4. 19th Nov’14 Equity Bazaar
Derivative Analysis FIIS Data: FII’s are net Rs101.98 Cr Sellers on 18thNovember2014 and Dll’s are the netRs232.42 Cr Sellers on 18th November 2014. Option Data: 8500 CE has the highest OI with 55lakhs and 8400 CE has the second highest OI with 49 lakhs and 8300 PE has the highest OI with 62 lakhs and 8200 PE has the second highest OI with 51 lakhs. Open Interest: The above options data shows that Nifty has strong support at 8000 and has resistance at 8500. The change in level will take place once when NIFTY prices breaks 8300 mark. Intraday Option Strategy: (A) Buy Nifty 8300calls and Sell Nifty 8400puts if buy level is breached. (B) Sell Nifty 8400 calls and Buy Nifty8300 puts if sell level is breached.
7. 19th Nov’14 Equity Bazaar Disclaimer
This is solely for information of clients of Choice Broking and does not construe to be an investment advice. It is also not intended as an offer or solicitation for the purchase and sale of any financial instruments. Any action taken by you on the basis of the information contained herein is your responsibility alone and Choice Broking its subsidiaries or its employees or associates will not be liable in any manner for the consequences of such action taken by you. We have exercised due diligence in checking the correctness and authenticity of the information contained in this recommendation, but Choice Broking or any of its subsidiaries or associates or employees shall not be in any way responsible for any loss or damage that may arise to any person from any inadvertent error in the information contained in this recommendation or any action taken on basis of this information. Technical analysis studies market psychology, price patterns and volume levels. It is used to forecast future price and market movements. Technical analysis is complementary to fundamental analysis and news sources. The recommendations issued herewith might be contrary to recommendations issued by Choice Broking in the company research undertaken as the recommendations stated in this report is derived purely from technical analysis. Choice Broking has based this document on information obtained from sources it believes to be reliable but which it has not independently verified; Choice Broking makes no guarantee, representation or warranty and accepts no responsibility or liability as to its accuracy or completeness. The opinions contained within the report are based upon publicly available information at the time of publication and are subject to change without notice. The information and any disclosures provided herein are in summary form and have been prepared for informational purposes. The recommendations and suggested price levels are intended purely for trading purposes. The recommendations are valid for the day of the report however trading trends and volumes might vary substantially on an intraday basis and the recommendations may be subject to change. The information and any disclosures provided herein may be considered confidential. Any use, distribution, modification, copying, forwarding or disclosure by any person is strictly prohibited. The information and any disclosures provided herein do not constitute a solicitation or offer to purchase or sell any security or other financial product or instrument. The current performance may be unaudited. Past performance does not guarantee future returns. There can be no assurance that investments will achieve any targeted rates of return, and there is no guarantee against the loss of your entire investment. POTENTIAL CONFLICT OF INTEREST DISCLOSURE (as on date of report) Disclosure of interest statement – • Analyst interest of the stock /Instrument(s): - No. • Firm interest of the stock / Instrument (s): - No.