SlideShare a Scribd company logo
1 of 7
Download to read offline
24th Sept’14 Equity Bazaar 
Nifty 
Nifty Technical View: 
 In yesterday’s trading session Nifty has broken sharply & closed below its important support level. In previous day’s trading session we has seen shooting star candlestick on hourly chart which gives pre intimations of trend reversal. 
 Price Pattern: According to Hourly chart, Nifty has formed Large Real Bodies of Black candlestick which means during trading session bears were more aggressive. 
 Moving Average: In Hourly chart, Nifty has traded below its 50 & 100 EMA, which is bearish sign. Very soon we will see 50 EMA cross below 100 EMA & this is strong bearish sign. 
 MACD: The MACD on the hourly charts has turned flat to negative divergence (12days SMA trades below 26 days SMA) with large negative histogram which is again bearish sign. 
 RSI: Oscillator RSI has slipped below the important area of middle line. Currently RSI is near bearish level (34.7 levels) & as per this theory one may expect RSI should drift lower below 30 levels. 
 Conclusion: Below chart says that we had seen horizontal support of 8067 levels in Nifty which now has turned to resistance & the previous levels of 7952 will act support. 
Resistance: R1 8115 R2 8213 R3 8365 
Pivot : PL 8061 
Support : S1 7936 S2 7909 S3 7757 
Our Recommendation 
Buy Nifty above 8150 Stop Loss 8100 Target 8350. 
Sell Nifty on rise around 8100 Stop Loss 8150 Target 7800.
24th Sept’14 Equity Bazaar 
Bank Nifty 
Bank Nifty Technical View: 
 Yesterday, we have seen sharp fall in bank nifty & it has closed near its lower levels. We can also say that there is positive correlation between Nifty & Bank Nifty. 
 Price Pattern: In Hourly chart Bank nifty has formed Double Top Reversal chart pattern. Now Bank Nifty has traded below its important support level of 16021. 
 Moving Average: In Hourly chart Bank Nifty has traded below its 50 & 100 EMA with narrow distance, which is a sign of strong bearish move. 
 MACD: MACD is well placed below its zero line, with large negative histogram which is again bearish sign. 
 RSI: Relative Strength Index (RSI) is moving below 35 levels, which is very close to near-term oversold level. 
 Conclusion: The charts suggest that Bank Nifty may trade in narrow range. The strong support at 15835 levels shown by lower horizontal line & upper resistance at 16015 levels shown by middle horizontal line. 
Resistance: R1 16133 R2 16359 R3 16705 
Pivot : PL 16013 
Support : S1 15787 S2 15667 S3 15321 
Our Recommendation 
Buy BNF above 16080 Stop Loss 16020 Target 16300 
Sell BNF rise around 16000 Stop Loss 16080 Target 15870
24th Sept’14 Equity Bazaar 
Stock of the Day 
Ranbaxy View: 
 Yesterday we have seen sharp fall in Ranbaxy & closed near its lower level. 
 Price Pattern: According to hourly chart Ranbaxy had form Bearish Flag chart pattern which shows sharp down move after little distribution. Now Ranbaxy has traded below its important support level. 
 Moving Average: In Hourly chart, Ranbaxy has traded below its 50 &100 EMA which is suggesting weakness in prices. There is a possibility that Ranbaxy could test 50 EMA or 100 EMA & start moving down for the fresh downward move. 
 MACD: The MACD on the hourly charts has given cross under its signal line which is negative for prices. 
 RSI: RSI has slipped in to oversold zone. 
 Conclusion: Ranbaxy trades in falling direction therefore rallies can be used as selling opportunities to test lower levels for the day. 
Resistance : R1 594 R2 616 R3 650 
Pivot : PL 582 
Support : S1 560 S2 548 S3 514 
Our Recommendation 
Sell Ranbaxy @573 Stop Loss 585 Target 550
24th Sept’14 Equity Bazaar 
Derivative Analysis  FIIS Data: FII’s are the net seller on 23rd September 2014 is Rs 1185.17 Cr and Dll’s are the net buyers on 23rd September 2014 is Rs 325.7 Cr.  Option Data: 8300 CE has the highest OI with 85 lakhs and 8100 CE has the second highest OI with 62 lakhs and 8000 PE has the highest OI with 70 lakhs and 7900 PE has the second highest OI with 60 lakhs.  Open Interest: The above options data shows nifty has now a strong support at 7900 and resistance at 8200 the trend change level as per option data is 8000.  Intraday Option Strategy: (A) Buy Nifty 8200 calls and Sell Nifty 7900 puts if buy level is breached. (B) Sell Nifty 7900 calls and Buy Nifty 8200 puts if sell level is breached.
24th Sept’14 Equity Bazaar 
Symbol S3 S2 S1 Pivot R1 R2 R3 Trend Action 
ACC 1395.7 1434.1 1449.1 1472.5 1487.5 1510.9 1549.3 Down Sell 
AMBUJACEM 206.72 210.07 211.93 213.4167 215.28 216.77 220.12 UP Buy 
ASIANPAINT 582.8 611.4 623.1 640 651.7 668.6 697.2 Down Sell 
AXISBANK 379.18 390.73 394.92 402.2833 406.47 413.83 425.38 Down Sell 
BAJAJ-AUTO 2262.27 2336.67 2365.13 2411.067 2439.53 2485.47 2559.87 Down Sell 
BANKBARODA 872.58 905.08 917.17 937.5833 949.67 970.08 1002.58 Down Sell 
BHEL 200.3 209.55 213 218.8 222.25 228.05 237.3 Down Sell 
BPCL 601.73 629.78 640.37 657.8333 668.42 685.88 713.93 Down Sell 
BHARTIARTL 389.63 399.33 402.92 409.0333 412.62 418.73 428.43 Down Sell 
CAIRN 303.25 310.25 312.75 317.25 319.75 324.25 331.25 Down Sell 
CIPLA 505.65 550.7 567.5 595.75 612.55 640.8 685.85 Down Sell 
COALINDIA 314.07 325.92 330.53 337.7667 342.38 349.62 361.47 Down Sell 
DLF 136.67 147.77 151.63 158.8667 162.73 169.97 181.07 Down Sell 
DRREDDY 3050.27 3129.97 3164.53 3209.667 3244.23 3289.37 3369.07 Down Sell 
GAIL 410.93 428.38 435.87 445.8333 453.32 463.28 480.73 Down Sell 
GRASIM 3470.48 3579.63 3619.57 3688.783 3728.72 3797.93 3907.08 Down Sell 
HCLTECH 1642.35 1680.55 1702.5 1718.75 1740.7 1756.95 1795.15 UP Buy 
HDFCBANK 826.27 838.52 843.68 850.7667 855.93 863.02 875.27 Down Sell 
HEROMOTOCO 2874.4 2933.4 2955.8 2992.4 3014.8 3051.4 3110.4 Down Sell 
HINDALCO 141.18 149.98 153.57 158.7833 162.37 167.58 176.38 Down Sell 
HINDUNILVR 706.7 725.55 733.8 744.4 752.65 763.25 782.1 Down Sell 
HDFC 1022.05 1046.05 1056.1 1070.05 1080.1 1094.05 1118.05 Down Sell 
ITC 356.97 364.07 367.43 371.1667 374.53 378.27 385.37 Down Sell 
ICICIBANK 1438 1496.3 1517.4 1554.6 1575.7 1612.9 1671.2 Down Sell 
IDFC 135.35 139.5 141 143.65 145.15 147.8 151.95 Down Sell 
INDUSINDBK 599.02 617.27 624.08 635.5167 642.33 653.77 672.02 Down Sell 
INFY 3452.9 3540.8 3573.95 3628.7 3661.85 3716.6 3804.5 Down Sell 
JINDALSTEL 200.83 206.03 208.47 211.2333 213.67 216.43 221.63 Down Sell 
KOTAKBANK 991.05 1016.15 1028.65 1041.25 1053.75 1066.35 1091.45 Down Sell 
LT 1432.42 1468.22 1481.98 1504.017 1517.78 1539.82 1575.62 Down Sell 
LUPIN 1274.72 1321.72 1339.43 1368.717 1386.43 1415.72 1462.72 Down Sell 
M&M 1285.37 1317.87 1332.73 1350.367 1365.23 1382.87 1415.37 Down Sell 
MARUTI 2960.17 3018.07 3039.93 3075.967 3097.83 3133.87 3191.77 Down Sell 
NMDC 160.03 165.18 167.27 170.3333 172.42 175.48 180.63 Down Sell 
NTPC 131.7 134.3 135.6 136.9 138.2 139.5 142.1 Sideway Sideway 
ONGC 380.8 396.3 401.8 411.8 417.3 427.3 442.8 Down Sell 
POWERGRID 131.58 134.23 135.37 136.8833 138.02 139.53 142.18 Down Sell 
PNB 900.62 937.52 951.83 974.4167 988.73 1011.32 1048.22 Down Sell 
RELIANCE 909.98 942.38 954.12 974.7833 986.52 1007.18 1039.58 Down Sell 
SSLT 269.98 275.58 277.97 281.1833 283.57 286.78 292.38 Down Sell 
SBIN 2425.58 2501.13 2528.67 2576.683 2604.22 2652.23 2727.78 Down Sell 
SUNPHARMA 722.95 755.3 767.95 787.65 800.3 820 852.35 Down Sell 
TCS 2519.68 2618.83 2653.52 2717.983 2752.67 2817.13 2916.28 Down Sell 
TATAMOTORS 472.5 499 508.4 525.5 534.9 552 578.5 Down Sell 
TATAPOWER 79.7 82.65 83.75 85.6 86.7 88.55 91.5 Down Sell 
TATASTEEL 454.05 472.2 478.9 490.35 497.05 508.5 526.65 Down Sell 
TECHM 2343.25 2410.7 2442.25 2478.15 2509.7 2545.6 2613.05 Down Sell 
ULTRACEMCO 2462.68 2541.43 2571.37 2620.183 2650.12 2698.93 2777.68 Down Sell 
MCDOWELL-N 549.07 566.57 574.63 584.0667 592.13 601.57 619.07 Down Sell 
WIPRO 277.42 290.12 294.83 302.8167 307.53 315.52 328.22 Down Sell
24th Sept’14 Equity Bazaar 
Amit Pawar (Research Associate) amit.pawar@choiceindia.com 
Rohan Shinde (Research Associate) rohan.shinde@choiceindia.com 
Deveya Gaglani (Research Advisor) deveya.gaglani@chocieindia.com 
For Private Circulation Only Website: www.choiceindia.com 
https://twitter.com/ChoiceBroking https://www.youtube.com/user/ChoiceBroking 
http://www.slideshare.net/choiceindiabroking https://plus.google.com/115293033595831069270/posts 
https://www.facebook.com/pages/Choice-Equity-Broking-Pvt-Ltd/352491718249644 
https://www.linkedin.com/company/choice-international-limited?trk=parent_company_logo
24th Sept’14 Equity Bazaar 
Disclaimer 
This is solely for information of clients of Choice India and does not construe to be an investment advice. It is also not intended as an offer or solicitation for the purchase and sale of any financial instruments. Any action taken by you on the basis of the information contained herein is your responsibility alone and Choice India its subsidiaries or its employees or associates will not be liable in any manner for the consequences of such action taken by you. We have exercised due diligence in checking the correctness and authenticity of the information contained in this recommendation, but Choice India or any of its subsidiaries or associates or employees shall not be in any way responsible for any loss or damage that may arise to any person from any inadvertent error in the information contained in this recommendation or any action taken on basis of this information. Technical analysis studies market psychology, price patterns and volume levels. It is used to forecast future price and market movements. Technical analysis is complementary to fundamental analysis and news sources. The recommendations issued herewith might be contrary to recommendations issued by Choice India in the company research undertaken as the recommendations stated in this report is derived purely from technical analysis. Choice India has based this document on information obtained from sources it believes to be reliable but which it has not independently verified; Choice India makes no guarantee, representation or warranty and accepts no responsibility or liability as to its accuracy or completeness. The opinions contained within the report are based upon publicly available information at the time of publication and are subject to change without notice. The information and any disclosures provided herein are in summary form and have been prepared for informational purposes. The recommendations and suggested price levels are intended purely for trading purposes. The recommendations are valid for the day of the report however trading trends and volumes might vary substantially on an intraday basis and the recommendations may be subject to change. The information and any disclosures provided herein may be considered confidential. Any use, distribution, modification, copying, forwarding or disclosure by any person is strictly prohibited. The information and any disclosures provided herein do not constitute a solicitation or offer to purchase or sell any security or other financial product or instrument. The current performance may be unaudited. Past performance does not guarantee future returns. There can be no assurance that investments will achieve any targeted rates of return, and there is no guarantee against the loss of your entire investment. 
POTENTIAL CONFLICT OF INTEREST DISCLOSURE (as on date of report) Disclosure of interest statement – • Analyst interest of the stock /Instrument(s): - No. • Firm interest of the stock / Instrument (s): - No.

More Related Content

What's hot

Daily Technical Trader - KSA March 09, 2016
Daily Technical Trader - KSA March 09, 2016Daily Technical Trader - KSA March 09, 2016
Daily Technical Trader - KSA March 09, 2016QNB Group
 
QNBFS Daily Technical Trader - KSA June 26, 2016
QNBFS Daily Technical Trader - KSA June 26, 2016QNBFS Daily Technical Trader - KSA June 26, 2016
QNBFS Daily Technical Trader - KSA June 26, 2016QNB Group
 
QNBFS Daily Technical Trader - KSA April 19, 2016
QNBFS Daily Technical Trader - KSA April 19, 2016QNBFS Daily Technical Trader - KSA April 19, 2016
QNBFS Daily Technical Trader - KSA April 19, 2016QNB Group
 
11 January Daily technical trader
11 January Daily technical trader 11 January Daily technical trader
11 January Daily technical trader QNB Group
 
Daily Technical Trader - KSA April 12, 2016
Daily Technical Trader - KSA April 12, 2016Daily Technical Trader - KSA April 12, 2016
Daily Technical Trader - KSA April 12, 2016QNB Group
 
QNBFS Daily Technical Trader - KSA May 23, 2016
QNBFS Daily Technical Trader - KSA May 23, 2016QNBFS Daily Technical Trader - KSA May 23, 2016
QNBFS Daily Technical Trader - KSA May 23, 2016QNB Group
 
QNBFS Daily Technical Trader - KSA June 06, 2016
QNBFS Daily Technical Trader - KSA June 06, 2016QNBFS Daily Technical Trader - KSA June 06, 2016
QNBFS Daily Technical Trader - KSA June 06, 2016QNB Group
 
16 December Daily technical trader
16 December Daily technical trader 16 December Daily technical trader
16 December Daily technical trader QNB Group
 
QNBFS Daily Technical Trader - KSA May 03, 2016
QNBFS Daily Technical Trader - KSA May 03, 2016QNBFS Daily Technical Trader - KSA May 03, 2016
QNBFS Daily Technical Trader - KSA May 03, 2016QNB Group
 
QNBFS Daily Technical Trader - KSA June 12, 2016
QNBFS Daily Technical Trader - KSA June 12, 2016QNBFS Daily Technical Trader - KSA June 12, 2016
QNBFS Daily Technical Trader - KSA June 12, 2016QNB Group
 
Daily Technical Trader - KSA April 10, 2016
Daily Technical Trader - KSA April 10, 2016Daily Technical Trader - KSA April 10, 2016
Daily Technical Trader - KSA April 10, 2016QNB Group
 
QNBFS Daily Technical Trader - KSA May 04, 2016
QNBFS Daily Technical Trader - KSA May 04, 2016QNBFS Daily Technical Trader - KSA May 04, 2016
QNBFS Daily Technical Trader - KSA May 04, 2016QNB Group
 
Daily Technical Trader - KSA April 17, 2016
Daily Technical Trader - KSA April 17, 2016Daily Technical Trader - KSA April 17, 2016
Daily Technical Trader - KSA April 17, 2016QNB Group
 
Daily Technical Trader - KSA March 27, 2016
 Daily Technical Trader - KSA March 27, 2016 Daily Technical Trader - KSA March 27, 2016
Daily Technical Trader - KSA March 27, 2016QNB Group
 
QNBFS Daily Technical Trader - KSA May 25, 2016
QNBFS Daily Technical Trader - KSA May 25, 2016QNBFS Daily Technical Trader - KSA May 25, 2016
QNBFS Daily Technical Trader - KSA May 25, 2016QNB Group
 
QNBFS Daily Technical Trader - KSA April 26, 2016
QNBFS Daily Technical Trader - KSA April 26, 2016QNBFS Daily Technical Trader - KSA April 26, 2016
QNBFS Daily Technical Trader - KSA April 26, 2016QNB Group
 
Daily Technical Trader - KSA April 03, 2016
Daily Technical Trader - KSA April 03, 2016Daily Technical Trader - KSA April 03, 2016
Daily Technical Trader - KSA April 03, 2016QNB Group
 
Daily Technical Trader - Qatar April 07, 2016
Daily Technical Trader - Qatar April 07, 2016Daily Technical Trader - Qatar April 07, 2016
Daily Technical Trader - Qatar April 07, 2016QNB Group
 
Daily Technical Trader - KSA March 21, 2016
Daily Technical Trader - KSA March 21, 2016Daily Technical Trader - KSA March 21, 2016
Daily Technical Trader - KSA March 21, 2016QNB Group
 
20 November Daily technical trader
20 November Daily technical trader 20 November Daily technical trader
20 November Daily technical trader QNB Group
 

What's hot (20)

Daily Technical Trader - KSA March 09, 2016
Daily Technical Trader - KSA March 09, 2016Daily Technical Trader - KSA March 09, 2016
Daily Technical Trader - KSA March 09, 2016
 
QNBFS Daily Technical Trader - KSA June 26, 2016
QNBFS Daily Technical Trader - KSA June 26, 2016QNBFS Daily Technical Trader - KSA June 26, 2016
QNBFS Daily Technical Trader - KSA June 26, 2016
 
QNBFS Daily Technical Trader - KSA April 19, 2016
QNBFS Daily Technical Trader - KSA April 19, 2016QNBFS Daily Technical Trader - KSA April 19, 2016
QNBFS Daily Technical Trader - KSA April 19, 2016
 
11 January Daily technical trader
11 January Daily technical trader 11 January Daily technical trader
11 January Daily technical trader
 
Daily Technical Trader - KSA April 12, 2016
Daily Technical Trader - KSA April 12, 2016Daily Technical Trader - KSA April 12, 2016
Daily Technical Trader - KSA April 12, 2016
 
QNBFS Daily Technical Trader - KSA May 23, 2016
QNBFS Daily Technical Trader - KSA May 23, 2016QNBFS Daily Technical Trader - KSA May 23, 2016
QNBFS Daily Technical Trader - KSA May 23, 2016
 
QNBFS Daily Technical Trader - KSA June 06, 2016
QNBFS Daily Technical Trader - KSA June 06, 2016QNBFS Daily Technical Trader - KSA June 06, 2016
QNBFS Daily Technical Trader - KSA June 06, 2016
 
16 December Daily technical trader
16 December Daily technical trader 16 December Daily technical trader
16 December Daily technical trader
 
QNBFS Daily Technical Trader - KSA May 03, 2016
QNBFS Daily Technical Trader - KSA May 03, 2016QNBFS Daily Technical Trader - KSA May 03, 2016
QNBFS Daily Technical Trader - KSA May 03, 2016
 
QNBFS Daily Technical Trader - KSA June 12, 2016
QNBFS Daily Technical Trader - KSA June 12, 2016QNBFS Daily Technical Trader - KSA June 12, 2016
QNBFS Daily Technical Trader - KSA June 12, 2016
 
Daily Technical Trader - KSA April 10, 2016
Daily Technical Trader - KSA April 10, 2016Daily Technical Trader - KSA April 10, 2016
Daily Technical Trader - KSA April 10, 2016
 
QNBFS Daily Technical Trader - KSA May 04, 2016
QNBFS Daily Technical Trader - KSA May 04, 2016QNBFS Daily Technical Trader - KSA May 04, 2016
QNBFS Daily Technical Trader - KSA May 04, 2016
 
Daily Technical Trader - KSA April 17, 2016
Daily Technical Trader - KSA April 17, 2016Daily Technical Trader - KSA April 17, 2016
Daily Technical Trader - KSA April 17, 2016
 
Daily Technical Trader - KSA March 27, 2016
 Daily Technical Trader - KSA March 27, 2016 Daily Technical Trader - KSA March 27, 2016
Daily Technical Trader - KSA March 27, 2016
 
QNBFS Daily Technical Trader - KSA May 25, 2016
QNBFS Daily Technical Trader - KSA May 25, 2016QNBFS Daily Technical Trader - KSA May 25, 2016
QNBFS Daily Technical Trader - KSA May 25, 2016
 
QNBFS Daily Technical Trader - KSA April 26, 2016
QNBFS Daily Technical Trader - KSA April 26, 2016QNBFS Daily Technical Trader - KSA April 26, 2016
QNBFS Daily Technical Trader - KSA April 26, 2016
 
Daily Technical Trader - KSA April 03, 2016
Daily Technical Trader - KSA April 03, 2016Daily Technical Trader - KSA April 03, 2016
Daily Technical Trader - KSA April 03, 2016
 
Daily Technical Trader - Qatar April 07, 2016
Daily Technical Trader - Qatar April 07, 2016Daily Technical Trader - Qatar April 07, 2016
Daily Technical Trader - Qatar April 07, 2016
 
Daily Technical Trader - KSA March 21, 2016
Daily Technical Trader - KSA March 21, 2016Daily Technical Trader - KSA March 21, 2016
Daily Technical Trader - KSA March 21, 2016
 
20 November Daily technical trader
20 November Daily technical trader 20 November Daily technical trader
20 November Daily technical trader
 

Viewers also liked

Currency Highlights 30.09.14
Currency Highlights 30.09.14Currency Highlights 30.09.14
Currency Highlights 30.09.14choice broking
 
Commodities call tracker october'14
Commodities call tracker october'14Commodities call tracker october'14
Commodities call tracker october'14choice broking
 
Commodities Call Tracker Aug 11th to 22nd
Commodities Call Tracker Aug 11th to 22ndCommodities Call Tracker Aug 11th to 22nd
Commodities Call Tracker Aug 11th to 22ndchoice broking
 
Equity bazaar 31.10.14
Equity bazaar 31.10.14Equity bazaar 31.10.14
Equity bazaar 31.10.14choice broking
 
Currency highlights 17.10.14
Currency highlights 17.10.14Currency highlights 17.10.14
Currency highlights 17.10.14choice broking
 
Currency highlights 21.11.14
Currency highlights 21.11.14Currency highlights 21.11.14
Currency highlights 21.11.14choice broking
 

Viewers also liked (15)

Currency Highlights 30.09.14
Currency Highlights 30.09.14Currency Highlights 30.09.14
Currency Highlights 30.09.14
 
Commodities call tracker october'14
Commodities call tracker october'14Commodities call tracker october'14
Commodities call tracker october'14
 
Commodities Call Tracker Aug 11th to 22nd
Commodities Call Tracker Aug 11th to 22ndCommodities Call Tracker Aug 11th to 22nd
Commodities Call Tracker Aug 11th to 22nd
 
Equity bazaar 31.10.14
Equity bazaar 31.10.14Equity bazaar 31.10.14
Equity bazaar 31.10.14
 
Aaj ka trend 31.10.14
Aaj ka trend 31.10.14Aaj ka trend 31.10.14
Aaj ka trend 31.10.14
 
Currency highlights 17.10.14
Currency highlights 17.10.14Currency highlights 17.10.14
Currency highlights 17.10.14
 
Aaj ka trend
Aaj ka trendAaj ka trend
Aaj ka trend
 
Currency highlights
Currency highlightsCurrency highlights
Currency highlights
 
Aaj ka trend 30.09.14
Aaj ka trend 30.09.14Aaj ka trend 30.09.14
Aaj ka trend 30.09.14
 
Aaj ka trend 17.10.14
Aaj ka trend 17.10.14Aaj ka trend 17.10.14
Aaj ka trend 17.10.14
 
Currency highlights
Currency highlightsCurrency highlights
Currency highlights
 
Currency highlights 21.11.14
Currency highlights 21.11.14Currency highlights 21.11.14
Currency highlights 21.11.14
 
Aaj ka trend 12.11.14
Aaj ka trend 12.11.14Aaj ka trend 12.11.14
Aaj ka trend 12.11.14
 
Currency highlights
Currency highlightsCurrency highlights
Currency highlights
 
Aaj ka trend 01.10.14
Aaj ka trend 01.10.14Aaj ka trend 01.10.14
Aaj ka trend 01.10.14
 

Similar to Equity bazaar 24.09.14

Similar to Equity bazaar 24.09.14 (20)

Equity bazaar 17.11.14
Equity bazaar 17.11.14Equity bazaar 17.11.14
Equity bazaar 17.11.14
 
Equity bazaar
Equity bazaarEquity bazaar
Equity bazaar
 
Equity bazaar 20.10.14
Equity bazaar 20.10.14Equity bazaar 20.10.14
Equity bazaar 20.10.14
 
Equity bazaar
Equity bazaarEquity bazaar
Equity bazaar
 
Equity bazaar 26.09.14
Equity bazaar 26.09.14Equity bazaar 26.09.14
Equity bazaar 26.09.14
 
Equity bazaar 10.10.14
Equity bazaar 10.10.14Equity bazaar 10.10.14
Equity bazaar 10.10.14
 
Equity bazaar 05.11.14
Equity bazaar 05.11.14Equity bazaar 05.11.14
Equity bazaar 05.11.14
 
Equity bazaar 11.11.14
Equity bazaar 11.11.14Equity bazaar 11.11.14
Equity bazaar 11.11.14
 
Equity bazaar 18.11.14
Equity bazaar 18.11.14Equity bazaar 18.11.14
Equity bazaar 18.11.14
 
Equity bazaar
Equity bazaarEquity bazaar
Equity bazaar
 
Equity bazaar 01.10.14
Equity bazaar 01.10.14Equity bazaar 01.10.14
Equity bazaar 01.10.14
 
Equity bazaar 3.11.14
Equity bazaar 3.11.14Equity bazaar 3.11.14
Equity bazaar 3.11.14
 
Equity bazaar 30.09.14
Equity bazaar 30.09.14Equity bazaar 30.09.14
Equity bazaar 30.09.14
 
Equity bazaar 29.09.14
Equity bazaar 29.09.14Equity bazaar 29.09.14
Equity bazaar 29.09.14
 
Equity bazaar 14.10.14
Equity bazaar 14.10.14Equity bazaar 14.10.14
Equity bazaar 14.10.14
 
Equity bazaar 08.10.14
Equity bazaar 08.10.14Equity bazaar 08.10.14
Equity bazaar 08.10.14
 
Equity bazaar 23.09.14
Equity bazaar 23.09.14Equity bazaar 23.09.14
Equity bazaar 23.09.14
 
Equity bazaar 07.10.2016
Equity bazaar 07.10.2016Equity bazaar 07.10.2016
Equity bazaar 07.10.2016
 
Equity bazaar 07.11.14
Equity bazaar 07.11.14Equity bazaar 07.11.14
Equity bazaar 07.11.14
 
Equity bazaar 23.12.2016
Equity bazaar 23.12.2016Equity bazaar 23.12.2016
Equity bazaar 23.12.2016
 

Equity bazaar 24.09.14

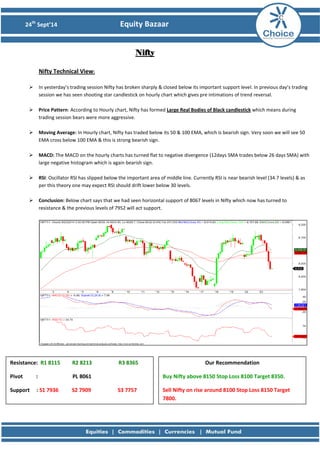
  • 1. 24th Sept’14 Equity Bazaar Nifty Nifty Technical View:  In yesterday’s trading session Nifty has broken sharply & closed below its important support level. In previous day’s trading session we has seen shooting star candlestick on hourly chart which gives pre intimations of trend reversal.  Price Pattern: According to Hourly chart, Nifty has formed Large Real Bodies of Black candlestick which means during trading session bears were more aggressive.  Moving Average: In Hourly chart, Nifty has traded below its 50 & 100 EMA, which is bearish sign. Very soon we will see 50 EMA cross below 100 EMA & this is strong bearish sign.  MACD: The MACD on the hourly charts has turned flat to negative divergence (12days SMA trades below 26 days SMA) with large negative histogram which is again bearish sign.  RSI: Oscillator RSI has slipped below the important area of middle line. Currently RSI is near bearish level (34.7 levels) & as per this theory one may expect RSI should drift lower below 30 levels.  Conclusion: Below chart says that we had seen horizontal support of 8067 levels in Nifty which now has turned to resistance & the previous levels of 7952 will act support. Resistance: R1 8115 R2 8213 R3 8365 Pivot : PL 8061 Support : S1 7936 S2 7909 S3 7757 Our Recommendation Buy Nifty above 8150 Stop Loss 8100 Target 8350. Sell Nifty on rise around 8100 Stop Loss 8150 Target 7800.
  • 2. 24th Sept’14 Equity Bazaar Bank Nifty Bank Nifty Technical View:  Yesterday, we have seen sharp fall in bank nifty & it has closed near its lower levels. We can also say that there is positive correlation between Nifty & Bank Nifty.  Price Pattern: In Hourly chart Bank nifty has formed Double Top Reversal chart pattern. Now Bank Nifty has traded below its important support level of 16021.  Moving Average: In Hourly chart Bank Nifty has traded below its 50 & 100 EMA with narrow distance, which is a sign of strong bearish move.  MACD: MACD is well placed below its zero line, with large negative histogram which is again bearish sign.  RSI: Relative Strength Index (RSI) is moving below 35 levels, which is very close to near-term oversold level.  Conclusion: The charts suggest that Bank Nifty may trade in narrow range. The strong support at 15835 levels shown by lower horizontal line & upper resistance at 16015 levels shown by middle horizontal line. Resistance: R1 16133 R2 16359 R3 16705 Pivot : PL 16013 Support : S1 15787 S2 15667 S3 15321 Our Recommendation Buy BNF above 16080 Stop Loss 16020 Target 16300 Sell BNF rise around 16000 Stop Loss 16080 Target 15870
  • 3. 24th Sept’14 Equity Bazaar Stock of the Day Ranbaxy View:  Yesterday we have seen sharp fall in Ranbaxy & closed near its lower level.  Price Pattern: According to hourly chart Ranbaxy had form Bearish Flag chart pattern which shows sharp down move after little distribution. Now Ranbaxy has traded below its important support level.  Moving Average: In Hourly chart, Ranbaxy has traded below its 50 &100 EMA which is suggesting weakness in prices. There is a possibility that Ranbaxy could test 50 EMA or 100 EMA & start moving down for the fresh downward move.  MACD: The MACD on the hourly charts has given cross under its signal line which is negative for prices.  RSI: RSI has slipped in to oversold zone.  Conclusion: Ranbaxy trades in falling direction therefore rallies can be used as selling opportunities to test lower levels for the day. Resistance : R1 594 R2 616 R3 650 Pivot : PL 582 Support : S1 560 S2 548 S3 514 Our Recommendation Sell Ranbaxy @573 Stop Loss 585 Target 550
  • 4. 24th Sept’14 Equity Bazaar Derivative Analysis  FIIS Data: FII’s are the net seller on 23rd September 2014 is Rs 1185.17 Cr and Dll’s are the net buyers on 23rd September 2014 is Rs 325.7 Cr.  Option Data: 8300 CE has the highest OI with 85 lakhs and 8100 CE has the second highest OI with 62 lakhs and 8000 PE has the highest OI with 70 lakhs and 7900 PE has the second highest OI with 60 lakhs.  Open Interest: The above options data shows nifty has now a strong support at 7900 and resistance at 8200 the trend change level as per option data is 8000.  Intraday Option Strategy: (A) Buy Nifty 8200 calls and Sell Nifty 7900 puts if buy level is breached. (B) Sell Nifty 7900 calls and Buy Nifty 8200 puts if sell level is breached.
  • 5. 24th Sept’14 Equity Bazaar Symbol S3 S2 S1 Pivot R1 R2 R3 Trend Action ACC 1395.7 1434.1 1449.1 1472.5 1487.5 1510.9 1549.3 Down Sell AMBUJACEM 206.72 210.07 211.93 213.4167 215.28 216.77 220.12 UP Buy ASIANPAINT 582.8 611.4 623.1 640 651.7 668.6 697.2 Down Sell AXISBANK 379.18 390.73 394.92 402.2833 406.47 413.83 425.38 Down Sell BAJAJ-AUTO 2262.27 2336.67 2365.13 2411.067 2439.53 2485.47 2559.87 Down Sell BANKBARODA 872.58 905.08 917.17 937.5833 949.67 970.08 1002.58 Down Sell BHEL 200.3 209.55 213 218.8 222.25 228.05 237.3 Down Sell BPCL 601.73 629.78 640.37 657.8333 668.42 685.88 713.93 Down Sell BHARTIARTL 389.63 399.33 402.92 409.0333 412.62 418.73 428.43 Down Sell CAIRN 303.25 310.25 312.75 317.25 319.75 324.25 331.25 Down Sell CIPLA 505.65 550.7 567.5 595.75 612.55 640.8 685.85 Down Sell COALINDIA 314.07 325.92 330.53 337.7667 342.38 349.62 361.47 Down Sell DLF 136.67 147.77 151.63 158.8667 162.73 169.97 181.07 Down Sell DRREDDY 3050.27 3129.97 3164.53 3209.667 3244.23 3289.37 3369.07 Down Sell GAIL 410.93 428.38 435.87 445.8333 453.32 463.28 480.73 Down Sell GRASIM 3470.48 3579.63 3619.57 3688.783 3728.72 3797.93 3907.08 Down Sell HCLTECH 1642.35 1680.55 1702.5 1718.75 1740.7 1756.95 1795.15 UP Buy HDFCBANK 826.27 838.52 843.68 850.7667 855.93 863.02 875.27 Down Sell HEROMOTOCO 2874.4 2933.4 2955.8 2992.4 3014.8 3051.4 3110.4 Down Sell HINDALCO 141.18 149.98 153.57 158.7833 162.37 167.58 176.38 Down Sell HINDUNILVR 706.7 725.55 733.8 744.4 752.65 763.25 782.1 Down Sell HDFC 1022.05 1046.05 1056.1 1070.05 1080.1 1094.05 1118.05 Down Sell ITC 356.97 364.07 367.43 371.1667 374.53 378.27 385.37 Down Sell ICICIBANK 1438 1496.3 1517.4 1554.6 1575.7 1612.9 1671.2 Down Sell IDFC 135.35 139.5 141 143.65 145.15 147.8 151.95 Down Sell INDUSINDBK 599.02 617.27 624.08 635.5167 642.33 653.77 672.02 Down Sell INFY 3452.9 3540.8 3573.95 3628.7 3661.85 3716.6 3804.5 Down Sell JINDALSTEL 200.83 206.03 208.47 211.2333 213.67 216.43 221.63 Down Sell KOTAKBANK 991.05 1016.15 1028.65 1041.25 1053.75 1066.35 1091.45 Down Sell LT 1432.42 1468.22 1481.98 1504.017 1517.78 1539.82 1575.62 Down Sell LUPIN 1274.72 1321.72 1339.43 1368.717 1386.43 1415.72 1462.72 Down Sell M&M 1285.37 1317.87 1332.73 1350.367 1365.23 1382.87 1415.37 Down Sell MARUTI 2960.17 3018.07 3039.93 3075.967 3097.83 3133.87 3191.77 Down Sell NMDC 160.03 165.18 167.27 170.3333 172.42 175.48 180.63 Down Sell NTPC 131.7 134.3 135.6 136.9 138.2 139.5 142.1 Sideway Sideway ONGC 380.8 396.3 401.8 411.8 417.3 427.3 442.8 Down Sell POWERGRID 131.58 134.23 135.37 136.8833 138.02 139.53 142.18 Down Sell PNB 900.62 937.52 951.83 974.4167 988.73 1011.32 1048.22 Down Sell RELIANCE 909.98 942.38 954.12 974.7833 986.52 1007.18 1039.58 Down Sell SSLT 269.98 275.58 277.97 281.1833 283.57 286.78 292.38 Down Sell SBIN 2425.58 2501.13 2528.67 2576.683 2604.22 2652.23 2727.78 Down Sell SUNPHARMA 722.95 755.3 767.95 787.65 800.3 820 852.35 Down Sell TCS 2519.68 2618.83 2653.52 2717.983 2752.67 2817.13 2916.28 Down Sell TATAMOTORS 472.5 499 508.4 525.5 534.9 552 578.5 Down Sell TATAPOWER 79.7 82.65 83.75 85.6 86.7 88.55 91.5 Down Sell TATASTEEL 454.05 472.2 478.9 490.35 497.05 508.5 526.65 Down Sell TECHM 2343.25 2410.7 2442.25 2478.15 2509.7 2545.6 2613.05 Down Sell ULTRACEMCO 2462.68 2541.43 2571.37 2620.183 2650.12 2698.93 2777.68 Down Sell MCDOWELL-N 549.07 566.57 574.63 584.0667 592.13 601.57 619.07 Down Sell WIPRO 277.42 290.12 294.83 302.8167 307.53 315.52 328.22 Down Sell
  • 6. 24th Sept’14 Equity Bazaar Amit Pawar (Research Associate) amit.pawar@choiceindia.com Rohan Shinde (Research Associate) rohan.shinde@choiceindia.com Deveya Gaglani (Research Advisor) deveya.gaglani@chocieindia.com For Private Circulation Only Website: www.choiceindia.com https://twitter.com/ChoiceBroking https://www.youtube.com/user/ChoiceBroking http://www.slideshare.net/choiceindiabroking https://plus.google.com/115293033595831069270/posts https://www.facebook.com/pages/Choice-Equity-Broking-Pvt-Ltd/352491718249644 https://www.linkedin.com/company/choice-international-limited?trk=parent_company_logo
  • 7. 24th Sept’14 Equity Bazaar Disclaimer This is solely for information of clients of Choice India and does not construe to be an investment advice. It is also not intended as an offer or solicitation for the purchase and sale of any financial instruments. Any action taken by you on the basis of the information contained herein is your responsibility alone and Choice India its subsidiaries or its employees or associates will not be liable in any manner for the consequences of such action taken by you. We have exercised due diligence in checking the correctness and authenticity of the information contained in this recommendation, but Choice India or any of its subsidiaries or associates or employees shall not be in any way responsible for any loss or damage that may arise to any person from any inadvertent error in the information contained in this recommendation or any action taken on basis of this information. Technical analysis studies market psychology, price patterns and volume levels. It is used to forecast future price and market movements. Technical analysis is complementary to fundamental analysis and news sources. The recommendations issued herewith might be contrary to recommendations issued by Choice India in the company research undertaken as the recommendations stated in this report is derived purely from technical analysis. Choice India has based this document on information obtained from sources it believes to be reliable but which it has not independently verified; Choice India makes no guarantee, representation or warranty and accepts no responsibility or liability as to its accuracy or completeness. The opinions contained within the report are based upon publicly available information at the time of publication and are subject to change without notice. The information and any disclosures provided herein are in summary form and have been prepared for informational purposes. The recommendations and suggested price levels are intended purely for trading purposes. The recommendations are valid for the day of the report however trading trends and volumes might vary substantially on an intraday basis and the recommendations may be subject to change. The information and any disclosures provided herein may be considered confidential. Any use, distribution, modification, copying, forwarding or disclosure by any person is strictly prohibited. The information and any disclosures provided herein do not constitute a solicitation or offer to purchase or sell any security or other financial product or instrument. The current performance may be unaudited. Past performance does not guarantee future returns. There can be no assurance that investments will achieve any targeted rates of return, and there is no guarantee against the loss of your entire investment. POTENTIAL CONFLICT OF INTEREST DISCLOSURE (as on date of report) Disclosure of interest statement – • Analyst interest of the stock /Instrument(s): - No. • Firm interest of the stock / Instrument (s): - No.