1. 07th Oct’ 14 Currency Highlights
USDINR
USDINR Technical View:
USDINR short term trend is at important price level suggesting that if the short term trend reverses will force to change dollar intermediate uptrend to downtrend.
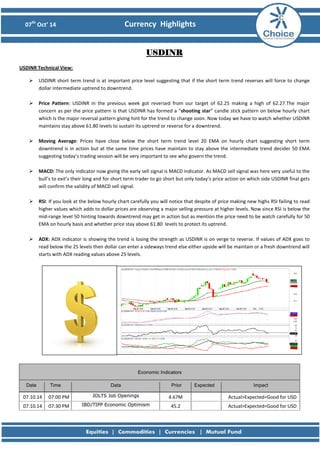
Price Pattern: USDINR in the previous week got reversed from our target of 62.25 making a high of 62.27.The major concern as per the price pattern is that USDINR has formed a “shooting star” candle stick pattern on below hourly chart which is the major reversal pattern giving hint for the trend to change soon. Now today we have to watch whether USDINR maintains stay above 61.80 levels to sustain its uptrend or reverse for a downtrend.
Moving Average: Prices have close below the short term trend level 20 EMA on hourly chart suggesting short term downtrend is in action but at the same time prices have maintain to stay above the intermediate trend decider 50 EMA suggesting today’s trading session will be very important to see who govern the trend.
MACD: The only indicator now giving the early sell signal is MACD indicator. As MACD sell signal was here very useful to the bull’s to exit’s their long and for short term trader to go short but only today’s price action on which side USDINR final gets will confirm the validity of MACD sell signal.
RSI: If you look at the below hourly chart carefully you will notice that despite of price making new highs RSI failing to read higher values which adds to dollar prices are observing a major selling pressure at higher levels. Now since RSI is below the mid-range level 50 hinting towards downtrend may get in action but as mention the price need to be watch carefully for 50 EMA on hourly basis and whether price stay above 61.80 levels to protect its uptrend.
ADX: ADX indicator is showing the trend is losing the strength as USDINR is on verge to reverse. If values of ADX goes to read below the 25 levels then dollar can enter a sideways trend else either upside will be maintain or a fresh downtrend will starts with ADX reading values above 25 levels.
Economic Indicators
Date
Time
Data
Prior
Expected
Impact
07.10.14
07:00 PM
JOLTS Job Openings
4.67M
Actual>Expected=Good for USD
07.10.14
07:30 PM
IBD/TIPP Economic Optimism
45.2
Actual>Expected=Good for USD
2. 07th Oct’ 14 Currency Highlights
EURINR
EURINR Technical View:
Prices of EURINR acted exactly as mentioned in the previous “Currency Highlights” report with its continuation of strong downtrend.
Price Pattern: EURINR continues its strong downtrend as prices are continuously reversing from its intraday highs. Trend remains strongly bearish till a strong price reversal upside will only make EURINR to change its downtrend. Till then the pair will be sell on rise.
Moving Average: Both 50 & 20 EMA ‘s on hourly chart are showing the ongoing strong downtrend as prices are failing to close above this key trend deciding EMA’s on hourly chart. If a price in today’s trading session approach this EMA’s then it will be sell opportunity till prices do not close successfully above both EMA’s on hourly basis.
MACD: MACD indicator continues to show its sell signal acting with the price downtrend. Now MACD if reverse to buy signal should not be consider till price makes a definitive upside reversal pattern. However with any new sell signal generated by MACD can be consider for shorting the pair.
RSI: RSI continues to shows its loss of momentum for the pair as prices are approaching lower levels each day. Now only a strong price reversal pattern will make RSI to read above the mid-range levels 50 giving hint for trend reversal. Till then RSI will continue to shows the ongoing downtrend for the pair.
ADX: ADX indicator will give no hint till prices do not get reverse for the uptrend. However if prices continues its strong downtrend ADX will move above 25 levels but with limited trending strength for the pair.
Economic Indicators
Date
Time
Data
Prior
Expected
Impact
07.10.14
11:30 PM
German Industrial Production m/m
1.9%
Actual>Expected=Good for EUR
07.10.14
12:15 PM
French Gov Budget Balance
-84.1B
Actual>Expected=Good for EUR
3. 07th Oct’ 14 Currency Highlights
GBPINR
GBPINR Technical View:
GBPINR finally breaks its sideways trend reversing to short term downtrend.
Moving Average: When prices are closing below the both 50 & 20 EMA’s with a successful negative crossover confirming the short term trend remains bearish till prices do not close above the both EMA’s. Now since the trend of pound has changed from sideways to downtrend pound will be selling on rise till no major price reversal pattern is form.
MACD: MACD as per its nature have given the early sell signal for the pair. The sell signal remains valid giving a selling opportunity for the pair with soon to approach its oversold region making price to trade at much lower levels.
RSI: RSI finally breaks its sideways range for the sideways market not only showing the weakness for the pair but also confirms the short term downtrend as its values are reading below the mid-range 50 levels.
ADX: ADX indicator in today’s trading session will starts to move at higher values leaving its trading nature for the pair with soon to read values above the 50 levels making a strong trending nature to get followed in the pair.
Economic Indicators
Date
Time
Data
Prior
Expected
Impact
07.10.14
02:00 PM
Manufacturing Production m/m
0.3%
Actual>Expected=Good for GBP
07.10.14
02:00 PM
Industrial Production m/m
0.5%
Actual>Expected=Good for GBP
07.10.14
02:00 PM
10-y Bond Auction
No consistent Effect
4. 07th Oct’ 14 Currency Highlights
JPYINR
JPYINR Technical View:
Yen below hourly chart shows how prices have failed to closed above important levels with resuming its earlier downtrend.
Moving Average: The 50 & 20 EMA’s on the below hourly chart clearly shows how price have failed to trade and close above the both EMA’s pushing prices back to its earlier downtrend. Now till prices do not close successfully with a positive crossover for both EMA’s on hourly basis JPYINR trend remains strongly bearish.
MACD: MACD indicator has turned to sell signal near over brought levels confirming the downtrend for yen. Here also one important thing to note to ignore any MACD buy signal till no major price upside reversal is from. However one can trade on sell signal going with the downtrend.
RSI: RSI has shown again the loss of momentum for the pair with prices failed to stay higher. RSI has also now started reading below the mid-range 50 levels confirming the continuation of downtrend for the pair till RSI do not get back above 50 levels.
ADX: ADX indicator continues to shows its trendless nature as its values are reading well below the 25 levels. Now with a strong reversal in price will only make ADX to read values above 25 levels showing the trending nature for the pair.
Economic Indicators
Date
Time
Data
Prior
Expected
Impact
07.10.14
04:00 AM
Monetary Policy Statement
More Hawkish=Good for JPY
07.10.14
09:15 AM
30-y Bond Auction
No Consistent Effect
07.10.14
10:30 AM
Leading Indicators
105.4%
Actual>Expected=Good for JPY
07.10.14
11:30 AM
BOJ Press Conference
More Hawkish=Good for JPY
6. 07th Oct’ 14 Currency Highlights
Disclaimer
This is solely for information of clients of Choice India and does not construe to be an investment advice. It is also not intended as an offer or solicitation for the purchase and sale of any financial instruments. Any action taken by you on the basis of the information contained herein is your responsibility alone and Choice India its subsidiaries or its employees or associates will not be liable in any manner for the consequences of such action taken by you. We have exercised due diligence in checking the correctness and authenticity of the information contained in this recommendation, but Choice India or any of its subsidiaries or associates or employees shall not be in any way responsible for any loss or damage that may arise to any person from any inadvertent error in the information contained in this recommendation or any action taken on basis of this information. Technical analysis studies market psychology, price patterns and volume levels. It is used to forecast future price and market movements. Technical analysis is complementary to fundamental analysis and news sources. The recommendations issued herewith might be contrary to recommendations issued by Choice India in the company research undertaken as the recommendations stated in this report is derived purely from technical analysis. Choice India has based this document on information obtained from sources it believes to be reliable but which it has not independently verified; Choice India makes no guarantee, representation or warranty and accepts no responsibility or liability as to its accuracy or completeness. The opinions contained within the report are based upon publicly available information at the time of publication and are subject to change without notice. The information and any disclosures provided herein are in summary form and have been prepared for informational purposes. The recommendations and suggested price levels are intended purely for trading purposes. The recommendations are valid for the day of the report however trading trends and volumes might vary substantially on an intraday basis and the recommendations may be subject to change. The information and any disclosures provided herein may be considered confidential. Any use, distribution, modification, copying, forwarding or disclosure by any person is strictly prohibited. The information and any disclosures provided herein do not constitute a solicitation or offer to purchase or sell any security or other financial product or instrument. The current performance may be unaudited. Past performance does not guarantee future returns. There can be no assurance that investments will achieve any targeted rates of return, and there is no guarantee against the loss of your entire investment.
POTENTIAL CONFLICT OF INTEREST DISCLOSURE (as on date of report) Disclosure of interest statement – • Analyst interest of the stock /Instrument(s): - No. • Firm interest of the stock / Instrument (s): - No.