SlideShare a Scribd company logo
10th Nov’14 Currency Highlights 
USDINR 
USDINR Technical View: 
 Finally, USDINR has changed its downtrend to a short term uptrend with 62.00 levels is the major resistance 
 Price Pattern: The price of USDINR pair in the friday’s trading session reversed for a short term uptrend with USDINR making a high of 61.88 levels making the pair strong for a short term. The pair has the major resistance at the psychological level 62.00 and if USDINR in today’s trading session trades and close above the level then, intermediate uptrend will start with next target of 62.25 levels. 
 Moving Average: The below hourly chart shows, there is the positive crossover of 50 & 20 EMA’s which strongly confirms the uptrend. Till this buy signal of both the averages continues to hold, the uptrend will remain valid. 
 MACD: The MACD indicator as per its nature has given the buy signal with its positive crossover suggesting the trend is strong till the prices trades above 61.60 levels. MACD will continue to hold its buy signal as the overall momentum for the pair is positive. 
 RSI: Momentum indicator RSI is also showing the strong gain in its strength as its reading values above the mid-range level 50. This also confirms the positive momentum will remain intact for the pair till RSI continues to read above the 50 levels and soon approaching the over-brought levels making the short-term uptrend to turn into intermediate uptrend. 
 ADX: After sideways ranges in USDINR, ADX indicator has now moved to read values above the 20 levels suggesting the trending phase as started for the pair. In today’s trading session ADX will continue to read higher values above the 25 levels confirming the pair’s intermediate uptrend. 
Economic Indicators Date Time Data Prior Expected Impact 
10.11.14 
No Data For USD Today
10th Nov’14 Currency Highlights 
EURINR 
EURINR Technical View: 
 The EURINR major trend is bearish, but with rally in USDINR prices EURINR also got some support in friday’s trading session. 
 Price Pattern: The pair major trend continues to remain down, as EURUSD is observing the bearishness making the pair to remain weak. The prices getting support for intraday upside was due the short term uptrend in USDINR. The price pattern shows the pair is selling on rise till there is no major reversal price pattern for upsides is form. 
 Moving Average: Prices continues to trade well below the 50 & 20 EMA’s which firmly confirms the major trend to remain down till prices do not trade above the both averages. However if prices are able to close above 20 EMA on hourly basis then it will hint towards the upcoming reversal. 
 MACD: The indicator has given buy signal as the price rally in previous session. But as mentioned earlier currently it will be better to ignore any signal generating from MACD till there is no confirm price reversal for upside. 
 RSI: RSI indicator has gain some strength as its now reading values above the oversold region. But from the below hourly chart, RSI is below mid-range levels 50 suggesting the weakness still exits for the pair. If in today’s trading session RSI maintains to stay and read above mid-range level 50 then this will hint the trend may change soon. 
 ADX: The ADX indicator now continues to read above the 25 levels as the trending phase still exits for the pair. If ADX from here moves to read lower values then this will hint towards the pair may enter a consolidation phase before changing its downtrend to uptrend. 
Economic Indicators Date Time Data Prior Expected Impact 
10.11.14 
02:30 PM Italian Industrial Production m/m 
0.3% 
Actual > Expected=Good for EUR 
10.11.14 
03:00 PM Sentix Investor Confidence 
-13.7 
Actual > Expected=Good for EUR
10th Nov’14 Currency Highlights 
GBPINR 
GBPINR Technical View: 
 Like EURINR, GBPINR major downtrend continues showing no sign of reversal. 
 Price Pattern: GBPINR price pattern continues to remain for bearish with deprecation of pound against major currencies. In the friday’s trading session price do not get support from the rally in USDINR which suggest the pair will continue to take clues from the trend in GBPUSD pair. 
 Moving Average: As the pair is in downtrend, so each day prices are trading well below the 50 & 20 EMA’s. If in today’s trading session prices are able to trade and close above the 20 EMA then this will suggest GBPINR is on the verge to reverse its trend, but a definite confirmation will come with prices to trade and close above the 50 EMA. 
 MACD: MACD indicator is now only the leading indicator to give a buy signal but the validity of this signal will be tested in today’s trading session whether prices are able to trade above the 98.00 levels changing the trend for the pair. 
 RSI: Despite of the prices able to close from its intraday lows in the previous trading session, momentum indicator RSI has started to read from the oversold region. But RSI is still under mid-range level 50, so it will be wait and watch to see in today’s trading session whether RSI starts to read above the 50 levels or again fall back at oversold region. 
 ADX: ADX indicator is now hinting towards the trading phase may start for GBPINR as it will read lower values. This also suggests the pair will enter a sideways phase before reversal for uptrend. 
Economic Indicators Date Time Data Prior Expected Impact 
10.11.14 
No Data For GBP Today
10th Nov’14 Currency Highlights 
JPYINR 
JPYINR Technical View: 
 Downtrend continues for the pair, as globally yen remains in a strong downtrend against major world currencies. 
 Price Pattern: The JPYINR price pattern remains bearish and showing no sign of trend reversal. The prices are getting some support from the uptrend in USDINR but as the major trend is down the pair will be sell on rise till there is no definite reversal price pattern is form. If USDINR observes weakness in today’s trading session, then JPYINR will start to trade at new lows. 
 Moving Average: From the below hourly chart, prices continues to trade below both the averages making the pair weak. Till there is no successful crossover of both the averages the downtrend will remain intact for the pair and also the 50 EMA will act as the major resistance and give opportunity for trader’s to sell the pair. 
 MACD: In JPYINR pair, MACD is now the only leading indicator to give a buy signal but since the major trend is bearish it will be better to ignore this buy signal. But if MACD reverse to give a sell signal then it can be surely be consider. 
 RSI: After staying and reading at oversold region for few days. RSI finally has shown some strength as its reading values above the 30 levels. But since the pair momentum is negative it will be tough for RSI to read and stay above the mid-range level 50. 
 ADX: The indicator is now reversing from the higher levels for the trending phase. If ADX continues to read lower values this will hints towards JPYINR will enter a sideways trend. 
Economic Indicators Date Time Data Prior Expected Impact 
10.11.14 
No Data for JPY Today
10th Nov’14 Currency Highlights 
Amit Pawar (Research Associate) amit.pawar@choiceindia.com 
Rohan Shinde (Research Associate) rohan.shinde@choiceindia.com 
Deveya Gaglani (Research Advisor) deveya.gaglani@chocieindia.com 
For Private Circulation Only Website: www.choiceindia.com 
https://twitter.com/ChoiceBroking https://plus.google.com/115293033595831069270/posts 
https://www.youtube.com/user/ChoiceBroking http://www.slideshare.net/choiceindiabroking 
https://www.facebook.com/choicebroking 
https://www.linkedin.com/company/choice-international-limited
10th Nov’14 Currency Highlights 
Disclaimer 
This is solely for information of clients of Choice Broking and does not construe to be an investment advice. It is also not intended as an offer or solicitation for the purchase and sale of any financial instruments. Any action taken by you on the basis of the information contained herein is your responsibility alone and Choice Broking its subsidiaries or its employees or associates will not be liable in any manner for the consequences of such action taken by you. We have exercised due diligence in checking the correctness and authenticity of the information contained in this recommendation, but Choice Broking or any of its subsidiaries or associates or employees shall not be in any way responsible for any loss or damage that may arise to any person from any inadvertent error in the information contained in this recommendation or any action taken on basis of this information. Technical analysis studies market psychology, price patterns and volume levels. It is used to forecast future price and market movements. Technical analysis is complementary to fundamental analysis and news sources. The recommendations issued here with might be contrary to recommendations issued by Choice Broking in the company research undertaken as the recommendations stated in this report is derived purely from technical analysis. Choice Broking has based this document on information obtained from sources it believes to be reliable but which it has not independently verified; Choice Broking makes no guarantee, representation or warranty and accepts no responsibility or liability as to its accuracy or completeness. The opinions contained within the report are based upon publicly available information at the time of publication and are subject to change without notice. The information and any disclosures provided herein are in summary form and have been prepared for informational purposes. The recommendations and suggested price levels are intended purely for trading purposes. The recommendations are valid for the day of the report however trading trends and volumes might vary substantially on an intraday basis and the recommendations may be subject to change. The information and any disclosures provided herein may be considered confidential. Any use, distribution, modification, copying, forwarding or disclosure by any person is strictly prohibited. The information and any disclosures provided herein do not constitute a solicitation or offer to purchase or sell any security or other financial product or instrument. The current performance may be unaudited. Past performance does not guarantee future returns. There can be no assurance that investments will achieve any targeted rates of return, and there is no guarantee against the loss of your entire investment. 
POTENTIAL CONFLICT OF INTEREST DISCLOSURE (as on date of report) Disclosure of interest statement – • Analyst interest of the stock /Instrument(s): - No. • Firm interest of the stock / Instrument (s): - No.

More Related Content

What's hot

Currency highlights 17.11.14
Currency highlights 17.11.14Currency highlights 17.11.14
Currency highlights 17.11.14choice broking
 
Currency highlights 26.09.14
Currency highlights 26.09.14Currency highlights 26.09.14
Currency highlights 26.09.14choice broking
 
Currency highlights 01.10.14
Currency highlights 01.10.14Currency highlights 01.10.14
Currency highlights 01.10.14choice broking
 
Currency highlights 07.10.14
Currency highlights 07.10.14Currency highlights 07.10.14
Currency highlights 07.10.14choice broking
 
Currency highlights 17.10.14
Currency highlights 17.10.14Currency highlights 17.10.14
Currency highlights 17.10.14choice broking
 
Currency highlights 10.10.14
Currency highlights 10.10.14Currency highlights 10.10.14
Currency highlights 10.10.14choice broking
 
Currency Highlights 30.09.14
Currency Highlights 30.09.14Currency Highlights 30.09.14
Currency Highlights 30.09.14choice broking
 
Currency high lights 09.02.17
Currency high lights 09.02.17Currency high lights 09.02.17
Currency high lights 09.02.17
Choice Equity
 
Currency high lights 14.02.17
Currency high lights 14.02.17Currency high lights 14.02.17
Currency high lights 14.02.17
Choice Equity
 
May 3, 2015 with charts
May 3, 2015 with chartsMay 3, 2015 with charts
May 3, 2015 with charts
Scutify
 
Stop Trading Support And Resistance The Wrong Way
Stop Trading Support And Resistance The Wrong WayStop Trading Support And Resistance The Wrong Way
Stop Trading Support And Resistance The Wrong Way
NetpicksTrading
 
Option Queen Newsletter July 20, 2014 with charts
Option Queen Newsletter July 20, 2014 with chartsOption Queen Newsletter July 20, 2014 with charts
Option Queen Newsletter July 20, 2014 with charts
Scutify
 
April 24, 2016.docx with charts
April 24, 2016.docx with chartsApril 24, 2016.docx with charts
April 24, 2016.docx with charts
Scutify
 

What's hot (18)

Currency highlights 17.11.14
Currency highlights 17.11.14Currency highlights 17.11.14
Currency highlights 17.11.14
 
Currency highlights 26.09.14
Currency highlights 26.09.14Currency highlights 26.09.14
Currency highlights 26.09.14
 
Currency highlights 01.10.14
Currency highlights 01.10.14Currency highlights 01.10.14
Currency highlights 01.10.14
 
Currency highlights 07.10.14
Currency highlights 07.10.14Currency highlights 07.10.14
Currency highlights 07.10.14
 
Cur241120140912141
Cur241120140912141Cur241120140912141
Cur241120140912141
 
Currency highlights 17.10.14
Currency highlights 17.10.14Currency highlights 17.10.14
Currency highlights 17.10.14
 
Currency highlights
Currency highlightsCurrency highlights
Currency highlights
 
Currency highlights
Currency highlightsCurrency highlights
Currency highlights
 
Currency highlights 10.10.14
Currency highlights 10.10.14Currency highlights 10.10.14
Currency highlights 10.10.14
 
Currency Highlights 30.09.14
Currency Highlights 30.09.14Currency Highlights 30.09.14
Currency Highlights 30.09.14
 
Currency highlights
Currency highlightsCurrency highlights
Currency highlights
 
Currency high lights 09.02.17
Currency high lights 09.02.17Currency high lights 09.02.17
Currency high lights 09.02.17
 
Currency high lights 14.02.17
Currency high lights 14.02.17Currency high lights 14.02.17
Currency high lights 14.02.17
 
Currency highlights
Currency highlightsCurrency highlights
Currency highlights
 
May 3, 2015 with charts
May 3, 2015 with chartsMay 3, 2015 with charts
May 3, 2015 with charts
 
Stop Trading Support And Resistance The Wrong Way
Stop Trading Support And Resistance The Wrong WayStop Trading Support And Resistance The Wrong Way
Stop Trading Support And Resistance The Wrong Way
 
Option Queen Newsletter July 20, 2014 with charts
Option Queen Newsletter July 20, 2014 with chartsOption Queen Newsletter July 20, 2014 with charts
Option Queen Newsletter July 20, 2014 with charts
 
April 24, 2016.docx with charts
April 24, 2016.docx with chartsApril 24, 2016.docx with charts
April 24, 2016.docx with charts
 

Viewers also liked

Equity bazaar 28.10.14
Equity bazaar 28.10.14Equity bazaar 28.10.14
Equity bazaar 28.10.14choice broking
 
Equity bazaar 26.09.14
Equity bazaar 26.09.14Equity bazaar 26.09.14
Equity bazaar 26.09.14choice broking
 
Commodities Call Tracker for September 2014
Commodities Call Tracker for September 2014Commodities Call Tracker for September 2014
Commodities Call Tracker for September 2014
choice broking
 

Viewers also liked (13)

Aaj ka trend 05.11.14
Aaj ka trend 05.11.14Aaj ka trend 05.11.14
Aaj ka trend 05.11.14
 
Aaj ka trend 25.09.14
Aaj ka trend 25.09.14Aaj ka trend 25.09.14
Aaj ka trend 25.09.14
 
Aaj ka trend 100914
Aaj ka trend 100914Aaj ka trend 100914
Aaj ka trend 100914
 
Aaj ka trend 14.10.14
Aaj ka trend 14.10.14Aaj ka trend 14.10.14
Aaj ka trend 14.10.14
 
Equity bazaar
Equity bazaarEquity bazaar
Equity bazaar
 
Equity bazaar 28.10.14
Equity bazaar 28.10.14Equity bazaar 28.10.14
Equity bazaar 28.10.14
 
Currency highlights
Currency highlightsCurrency highlights
Currency highlights
 
Equity bazaar 26.09.14
Equity bazaar 26.09.14Equity bazaar 26.09.14
Equity bazaar 26.09.14
 
Aaj ka trend 17.11.14
Aaj ka trend 17.11.14Aaj ka trend 17.11.14
Aaj ka trend 17.11.14
 
Aaj ka trend 19.11.14
Aaj ka trend 19.11.14Aaj ka trend 19.11.14
Aaj ka trend 19.11.14
 
Aaj ka trend 12.11.14
Aaj ka trend 12.11.14Aaj ka trend 12.11.14
Aaj ka trend 12.11.14
 
Commodities Call Tracker for September 2014
Commodities Call Tracker for September 2014Commodities Call Tracker for September 2014
Commodities Call Tracker for September 2014
 
Currency highlights
Currency highlightsCurrency highlights
Currency highlights
 

Similar to Currency highlights 10.11.14

Currency highlights 21.10.14
Currency highlights 21.10.14Currency highlights 21.10.14
Currency highlights 21.10.14choice broking
 
Currency highlights 08.10.14
Currency highlights 08.10.14Currency highlights 08.10.14
Currency highlights 08.10.14choice broking
 
Currency highlights 25.09.14
Currency highlights 25.09.14Currency highlights 25.09.14
Currency highlights 25.09.14choice broking
 
Currency highlights 22.09.14
Currency highlights 22.09.14Currency highlights 22.09.14
Currency highlights 22.09.14choice broking
 
Currency highlights 31.10.14
Currency highlights 31.10.14Currency highlights 31.10.14
Currency highlights 31.10.14choice broking
 
Currency highlights 07.11.14
Currency highlights 07.11.14Currency highlights 07.11.14
Currency highlights 07.11.14choice broking
 
Currency high lights 14.06.16
Currency high lights 14.06.16Currency high lights 14.06.16
Currency high lights 14.06.16
Choice Equity
 
Equity bazaar 11.11.14
Equity bazaar 11.11.14Equity bazaar 11.11.14
Equity bazaar 11.11.14choice broking
 
Currency high lights 07.02.17
Currency high lights 07.02.17Currency high lights 07.02.17
Currency high lights 07.02.17
Choice Equity
 
GOLD: Bearish, Targets Further Weakness
GOLD: Bearish, Targets Further WeaknessGOLD: Bearish, Targets Further Weakness
GOLD: Bearish, Targets Further Weakness
FXTechstrategy.com
 
Weekly Technical Report :30 April 2019
Weekly Technical Report :30 April 2019Weekly Technical Report :30 April 2019
Weekly Technical Report :30 April 2019
Axis Direct
 
QNBFS Daily Technical Trader Qatar - September 09, 2021 التحليل الفني اليومي ...
QNBFS Daily Technical Trader Qatar - September 09, 2021 التحليل الفني اليومي ...QNBFS Daily Technical Trader Qatar - September 09, 2021 التحليل الفني اليومي ...
QNBFS Daily Technical Trader Qatar - September 09, 2021 التحليل الفني اليومي ...
QNB Group
 
Equity bazaar 07.11.14
Equity bazaar 07.11.14Equity bazaar 07.11.14
Equity bazaar 07.11.14choice broking
 

Similar to Currency highlights 10.11.14 (18)

Currency highlights 21.10.14
Currency highlights 21.10.14Currency highlights 21.10.14
Currency highlights 21.10.14
 
Currency highlights 08.10.14
Currency highlights 08.10.14Currency highlights 08.10.14
Currency highlights 08.10.14
 
Currency highlights 25.09.14
Currency highlights 25.09.14Currency highlights 25.09.14
Currency highlights 25.09.14
 
Currency highlights 22.09.14
Currency highlights 22.09.14Currency highlights 22.09.14
Currency highlights 22.09.14
 
Currency highlights
Currency highlightsCurrency highlights
Currency highlights
 
Currency highlights 31.10.14
Currency highlights 31.10.14Currency highlights 31.10.14
Currency highlights 31.10.14
 
Currency highlights
Currency highlightsCurrency highlights
Currency highlights
 
Currency highlights
Currency highlightsCurrency highlights
Currency highlights
 
Currency highlights 07.11.14
Currency highlights 07.11.14Currency highlights 07.11.14
Currency highlights 07.11.14
 
Currency high lights 14.06.16
Currency high lights 14.06.16Currency high lights 14.06.16
Currency high lights 14.06.16
 
Equity bazaar 11.11.14
Equity bazaar 11.11.14Equity bazaar 11.11.14
Equity bazaar 11.11.14
 
Currency high lights 07.02.17
Currency high lights 07.02.17Currency high lights 07.02.17
Currency high lights 07.02.17
 
GOLD: Bearish, Targets Further Weakness
GOLD: Bearish, Targets Further WeaknessGOLD: Bearish, Targets Further Weakness
GOLD: Bearish, Targets Further Weakness
 
Equity bazaar 3.11.14
Equity bazaar 3.11.14Equity bazaar 3.11.14
Equity bazaar 3.11.14
 
Currency highlights
Currency highlightsCurrency highlights
Currency highlights
 
Weekly Technical Report :30 April 2019
Weekly Technical Report :30 April 2019Weekly Technical Report :30 April 2019
Weekly Technical Report :30 April 2019
 
QNBFS Daily Technical Trader Qatar - September 09, 2021 التحليل الفني اليومي ...
QNBFS Daily Technical Trader Qatar - September 09, 2021 التحليل الفني اليومي ...QNBFS Daily Technical Trader Qatar - September 09, 2021 التحليل الفني اليومي ...
QNBFS Daily Technical Trader Qatar - September 09, 2021 التحليل الفني اليومي ...
 
Equity bazaar 07.11.14
Equity bazaar 07.11.14Equity bazaar 07.11.14
Equity bazaar 07.11.14
 

Currency highlights 10.11.14

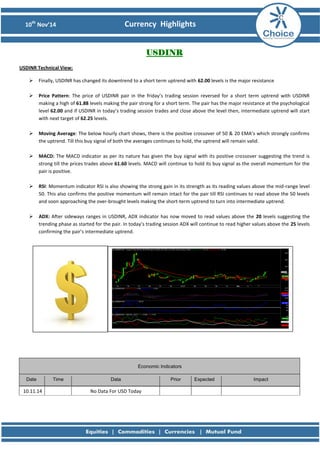
  • 1. 10th Nov’14 Currency Highlights USDINR USDINR Technical View:  Finally, USDINR has changed its downtrend to a short term uptrend with 62.00 levels is the major resistance  Price Pattern: The price of USDINR pair in the friday’s trading session reversed for a short term uptrend with USDINR making a high of 61.88 levels making the pair strong for a short term. The pair has the major resistance at the psychological level 62.00 and if USDINR in today’s trading session trades and close above the level then, intermediate uptrend will start with next target of 62.25 levels.  Moving Average: The below hourly chart shows, there is the positive crossover of 50 & 20 EMA’s which strongly confirms the uptrend. Till this buy signal of both the averages continues to hold, the uptrend will remain valid.  MACD: The MACD indicator as per its nature has given the buy signal with its positive crossover suggesting the trend is strong till the prices trades above 61.60 levels. MACD will continue to hold its buy signal as the overall momentum for the pair is positive.  RSI: Momentum indicator RSI is also showing the strong gain in its strength as its reading values above the mid-range level 50. This also confirms the positive momentum will remain intact for the pair till RSI continues to read above the 50 levels and soon approaching the over-brought levels making the short-term uptrend to turn into intermediate uptrend.  ADX: After sideways ranges in USDINR, ADX indicator has now moved to read values above the 20 levels suggesting the trending phase as started for the pair. In today’s trading session ADX will continue to read higher values above the 25 levels confirming the pair’s intermediate uptrend. Economic Indicators Date Time Data Prior Expected Impact 10.11.14 No Data For USD Today
  • 2. 10th Nov’14 Currency Highlights EURINR EURINR Technical View:  The EURINR major trend is bearish, but with rally in USDINR prices EURINR also got some support in friday’s trading session.  Price Pattern: The pair major trend continues to remain down, as EURUSD is observing the bearishness making the pair to remain weak. The prices getting support for intraday upside was due the short term uptrend in USDINR. The price pattern shows the pair is selling on rise till there is no major reversal price pattern for upsides is form.  Moving Average: Prices continues to trade well below the 50 & 20 EMA’s which firmly confirms the major trend to remain down till prices do not trade above the both averages. However if prices are able to close above 20 EMA on hourly basis then it will hint towards the upcoming reversal.  MACD: The indicator has given buy signal as the price rally in previous session. But as mentioned earlier currently it will be better to ignore any signal generating from MACD till there is no confirm price reversal for upside.  RSI: RSI indicator has gain some strength as its now reading values above the oversold region. But from the below hourly chart, RSI is below mid-range levels 50 suggesting the weakness still exits for the pair. If in today’s trading session RSI maintains to stay and read above mid-range level 50 then this will hint the trend may change soon.  ADX: The ADX indicator now continues to read above the 25 levels as the trending phase still exits for the pair. If ADX from here moves to read lower values then this will hint towards the pair may enter a consolidation phase before changing its downtrend to uptrend. Economic Indicators Date Time Data Prior Expected Impact 10.11.14 02:30 PM Italian Industrial Production m/m 0.3% Actual > Expected=Good for EUR 10.11.14 03:00 PM Sentix Investor Confidence -13.7 Actual > Expected=Good for EUR
  • 3. 10th Nov’14 Currency Highlights GBPINR GBPINR Technical View:  Like EURINR, GBPINR major downtrend continues showing no sign of reversal.  Price Pattern: GBPINR price pattern continues to remain for bearish with deprecation of pound against major currencies. In the friday’s trading session price do not get support from the rally in USDINR which suggest the pair will continue to take clues from the trend in GBPUSD pair.  Moving Average: As the pair is in downtrend, so each day prices are trading well below the 50 & 20 EMA’s. If in today’s trading session prices are able to trade and close above the 20 EMA then this will suggest GBPINR is on the verge to reverse its trend, but a definite confirmation will come with prices to trade and close above the 50 EMA.  MACD: MACD indicator is now only the leading indicator to give a buy signal but the validity of this signal will be tested in today’s trading session whether prices are able to trade above the 98.00 levels changing the trend for the pair.  RSI: Despite of the prices able to close from its intraday lows in the previous trading session, momentum indicator RSI has started to read from the oversold region. But RSI is still under mid-range level 50, so it will be wait and watch to see in today’s trading session whether RSI starts to read above the 50 levels or again fall back at oversold region.  ADX: ADX indicator is now hinting towards the trading phase may start for GBPINR as it will read lower values. This also suggests the pair will enter a sideways phase before reversal for uptrend. Economic Indicators Date Time Data Prior Expected Impact 10.11.14 No Data For GBP Today
  • 4. 10th Nov’14 Currency Highlights JPYINR JPYINR Technical View:  Downtrend continues for the pair, as globally yen remains in a strong downtrend against major world currencies.  Price Pattern: The JPYINR price pattern remains bearish and showing no sign of trend reversal. The prices are getting some support from the uptrend in USDINR but as the major trend is down the pair will be sell on rise till there is no definite reversal price pattern is form. If USDINR observes weakness in today’s trading session, then JPYINR will start to trade at new lows.  Moving Average: From the below hourly chart, prices continues to trade below both the averages making the pair weak. Till there is no successful crossover of both the averages the downtrend will remain intact for the pair and also the 50 EMA will act as the major resistance and give opportunity for trader’s to sell the pair.  MACD: In JPYINR pair, MACD is now the only leading indicator to give a buy signal but since the major trend is bearish it will be better to ignore this buy signal. But if MACD reverse to give a sell signal then it can be surely be consider.  RSI: After staying and reading at oversold region for few days. RSI finally has shown some strength as its reading values above the 30 levels. But since the pair momentum is negative it will be tough for RSI to read and stay above the mid-range level 50.  ADX: The indicator is now reversing from the higher levels for the trending phase. If ADX continues to read lower values this will hints towards JPYINR will enter a sideways trend. Economic Indicators Date Time Data Prior Expected Impact 10.11.14 No Data for JPY Today
  • 5. 10th Nov’14 Currency Highlights Amit Pawar (Research Associate) amit.pawar@choiceindia.com Rohan Shinde (Research Associate) rohan.shinde@choiceindia.com Deveya Gaglani (Research Advisor) deveya.gaglani@chocieindia.com For Private Circulation Only Website: www.choiceindia.com https://twitter.com/ChoiceBroking https://plus.google.com/115293033595831069270/posts https://www.youtube.com/user/ChoiceBroking http://www.slideshare.net/choiceindiabroking https://www.facebook.com/choicebroking https://www.linkedin.com/company/choice-international-limited
  • 6. 10th Nov’14 Currency Highlights Disclaimer This is solely for information of clients of Choice Broking and does not construe to be an investment advice. It is also not intended as an offer or solicitation for the purchase and sale of any financial instruments. Any action taken by you on the basis of the information contained herein is your responsibility alone and Choice Broking its subsidiaries or its employees or associates will not be liable in any manner for the consequences of such action taken by you. We have exercised due diligence in checking the correctness and authenticity of the information contained in this recommendation, but Choice Broking or any of its subsidiaries or associates or employees shall not be in any way responsible for any loss or damage that may arise to any person from any inadvertent error in the information contained in this recommendation or any action taken on basis of this information. Technical analysis studies market psychology, price patterns and volume levels. It is used to forecast future price and market movements. Technical analysis is complementary to fundamental analysis and news sources. The recommendations issued here with might be contrary to recommendations issued by Choice Broking in the company research undertaken as the recommendations stated in this report is derived purely from technical analysis. Choice Broking has based this document on information obtained from sources it believes to be reliable but which it has not independently verified; Choice Broking makes no guarantee, representation or warranty and accepts no responsibility or liability as to its accuracy or completeness. The opinions contained within the report are based upon publicly available information at the time of publication and are subject to change without notice. The information and any disclosures provided herein are in summary form and have been prepared for informational purposes. The recommendations and suggested price levels are intended purely for trading purposes. The recommendations are valid for the day of the report however trading trends and volumes might vary substantially on an intraday basis and the recommendations may be subject to change. The information and any disclosures provided herein may be considered confidential. Any use, distribution, modification, copying, forwarding or disclosure by any person is strictly prohibited. The information and any disclosures provided herein do not constitute a solicitation or offer to purchase or sell any security or other financial product or instrument. The current performance may be unaudited. Past performance does not guarantee future returns. There can be no assurance that investments will achieve any targeted rates of return, and there is no guarantee against the loss of your entire investment. POTENTIAL CONFLICT OF INTEREST DISCLOSURE (as on date of report) Disclosure of interest statement – • Analyst interest of the stock /Instrument(s): - No. • Firm interest of the stock / Instrument (s): - No.