1. 15th Sept 2014 Currency Highlights
USDINR
USDINR Technical View:
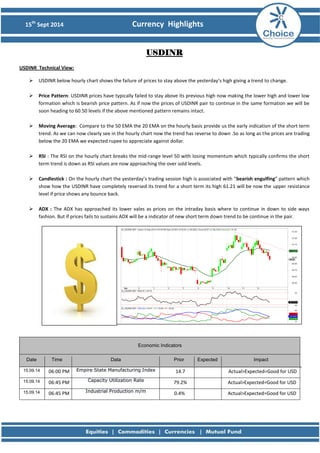
USDINR below hourly chart shows the failure of prices to stay above the yesterday’s high giving a trend to change.
Price Pattern: USDINR prices have typically failed to stay above its previous high now making the lower high and lower low formation which is bearish price pattern. As if now the prices of USDINR pair to continue in the same formation we will be soon heading to 60.50 levels if the above mentioned pattern remains intact.
Moving Average: Compare to the 50 EMA the 20 EMA on the hourly basis provide us the early indication of the short term trend. As we can now clearly see in the hourly chart now the trend has reverse to down .So as long as the prices are trading below the 20 EMA we expected rupee to appreciate against dollar.
RSI : The RSI on the hourly chart breaks the mid-range level 50 with losing momentum which typically confirms the short term trend is down as RSI values are now approaching the over sold levels.
Candlestick : On the hourly chart the yesterday’s trading session high is associated with “bearish engulfing” pattern which show how the USDINR have completely reversed its trend for a short term its high 61.21 will be now the upper resistance level if price shows any bounce back.
ADX : The ADX has approached its lower vales as prices on the intraday basis where to continue in down to side ways fashion. But if prices fails to sustains ADX will be a indicator of new short term down trend to be continue in the pair.
Economic Indicators Date Time Data Prior Expected Impact
15.09.14
06:00 PM Empire State Manufacturing Index
14.7
Actual>Expected=Good for USD
15.09.14
06:45 PM Capacity Utilization Rate
79.2%
Actual>Expected=Good for USD
15.09.14
06:45 PM Industrial Production m/m
0.4%
Actual>Expected=Good for USD
2. 15th Sept 2014 Currency Highlights
EURINR
EURINR Technical View:
The EURINR below hourly chart with prices now trading at sideways mode.
Price Pattern : On the hourly the EURINR prices falls in the similar line with USDINR with its hourly chart pattern formation is a sideways pattern if any further breaking the yesterday’s low 78.70 EURINR will be ready to fill its down gap for the next intermediate target of 78.40 else any bounce from this level will pull it back toward 79.10 and higher levels.
Moving Average: The prices of the EURINR are now trading in a sideways range where the short term 20 EMA on the hourly basis confirms the same. As seen in the chart prices are now trading below the 20 EMA which inputs the intraday trend will be down for the pair if only prices starts trading above the 20 EMA will push EURINR to higher levels.
RSI: The RSI now is acting with tandem with price as now near the oversold region .The only prices to protect the low with RSI will gain the momentum pushing it to higher levels else RSI will be heading towards the over sold region with prices to fill the gap.
ADX : The ADX as shown in the hourly chart is completely losing its momentum as the prices of the EURINR are now in the sideways mode. But it’s a typical characteristics of RSI that it will be turning soon up with prices either with uptrend or down trend in EURINR.
Economic Indicators Date Time Data Prior Expected Impact
15.09.14
2:30 PM Trade Balance
13.8B
Actual>Expected=Good for EUR
3. 15th Sept 2014 Currency Highlights
GBPINR
GBPINR Technical View:
The below is the hourly chart of GBPINR with prices are now showing a early weakness if today the prices starts trading below the yesterday’s low of 98.7600
Moving Average : The short term trend decider 20 EMA is acting very good signal for knowing the short term trend. Now if the prices starts trading below the 20 EMA as of now they are GBPINR will enter for a sharp correction to fill its down gap or else any up move which bring the prices back above the 20 EMA on hourly basis GBPNR wil breaks its recent high 99.37.
RSI : RSI on the hourly chart is now has turned down from the over brought region with RSI losing its strength. Other major concern is the RSI on the hourly chart is below the mid – range level 50 with prices at crucial level if fails to sustains higher RSI will sooner approach its lower level with prices to fall.
ADX : The ADX is now showing the trading nature of GBPINR will soon follow to get to trending move in GBPINR as the values of ADX starts getting on to higher value on hourly basis if it fails to sustain above 25 level on hourly basis the GBPINR will enter the sideways trend.
Economic Indicators Date Time Data Prior Expected Impact
15.09.14
4:31 AM Right move HPI m/m
-2.9%
Actual>Expected=Good for GBP
4. 15th Sept 2014 Currency Highlights
JPYINR
JPYINR Technical View:
The below is the hourly chart of JPYINR with prices now are much lower values which shows its inter market relationship with USDJPY pair where Japanese yen is in depreciation.
Moving Average : In below hourly chart prices of JPYINR are trading well below the 20 EMA which suggest the strong down trend in the pair continues with a strong appreciation of rupee against yen.
RSI : RSI have successively failed with losing momentum as the prices are now making new low. On the below hourly chart RSI has successively failed to stay above the mid-range levels 50 showing the downtrend is in no mood to reverse.
ADX : The ADX is just bottoming out from its lower levels showing a strong trend continuing in the JPYINR. If any change of trend comes we expected the ADX values will be in a tight range for JPYINR to enter a sideways trend .
Economic Indicators Date Time Data Prior Expected Impact
15.09.14
No Data for JPY Today
6. 15th Sept 2014 Currency Highlights
Disclaimer
This is solely for information of clients of Choice India and does not construe to be an investment advice. It is also not intended as an offer or solicitation for the purchase and sale of any financial instruments. Any action taken by you on the basis of the information contained herein is your responsibility alone and Choice India its subsidiaries or its employees or associates will not be liable in any manner for the consequences of such action taken by you. We have exercised due diligence in checking the correctness and authenticity of the information contained in this recommendation, but Choice India or any of its subsidiaries or associates or employees shall not be in any way responsible for any loss or damage that may arise to any person from any inadvertent error in the information contained in this recommendation or any action taken on basis of this information. Technical analysis studies market psychology, price patterns and volume levels. It is used to forecast future price and market movements. Technical analysis is complementary to fundamental analysis and news sources. The recommendations issued herewith might be contrary to recommendations issued by Choice India in the company research undertaken as the recommendations stated in this report is derived purely from technical analysis. Choice India has based this document on information obtained from sources it believes to be reliable but which it has not independently verified; Choice India makes no guarantee, representation or warranty and accepts no responsibility or liability as to its accuracy or completeness. The opinions contained within the report are based upon publicly available information at the time of publication and are subject to change without notice. The information and any disclosures provided herein are in summary form and have been prepared for informational purposes. The recommendations and suggested price levels are intended purely for trading purposes. The recommendations are valid for the day of the report however trading trends and volumes might vary substantially on an intraday basis and the recommendations may be subject to change. The information and any disclosures provided herein may be considered confidential. Any use, distribution, modification, copying, forwarding or disclosure by any person is strictly prohibited. The information and any disclosures provided herein do not constitute a solicitation or offer to purchase or sell any security or other financial product or instrument. The current performance may be unaudited. Past performance does not guarantee future returns. There can be no assurance that investments will achieve any targeted rates of return, and there is no guarantee against the loss of your entire investment.
POTENTIAL CONFLICT OF INTEREST DISCLOSURE (as on date of report) Disclosure of interest statement – • Analyst interest of the stock /Instrument(s): - No. • Firm interest of the stock / Instrument (s): - No.