1. 18th Sept 2014 Currency Highlights
USDINR
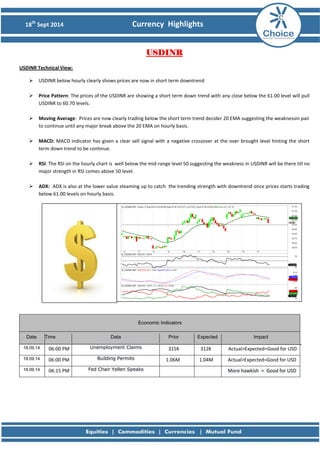
USDINR Technical View:
USDINR below hourly clearly shows prices are now in short term downtrend
Price Pattern: The prices of the USDINR are showing a short term down trend with any close below the 61.00 level will pull USDINR to 60.70 levels.
Moving Average: Prices are now clearly trading below the short term trend decider 20 EMA suggesting the weaknessin pair to continue until any major break above the 20 EMA on hourly basis.
MACD: MACD indicator has given a clear sell signal with a negative crossover at the over brought level hinting the short term down trend to be continue.
RSI: The RSI on the hourly chart is well below the mid-range level 50 suggesting the weakness in USDINR will be there till no major strength in RSI comes above 50 level.
ADX: ADX is also at the lower value steaming up to catch the trending strength with downtrend once prices starts trading below 61.00 levels on hourly basis.
Economic Indicators Date Time Data Prior Expected Impact
18.09.14
06:00 PM Unemployment Claims
315K
312K
Actual>Expected=Good for USD
18.09.14
06:00 PM Building Permits
1.06M
1.04M
Actual>Expected=Good for USD
18.09.14
06:15 PM Fed Chair Yellen Speaks
More hawkish = Good for USD
2. 18th Sept 2014 Currency Highlights
EURINR
EURINR Technical View:
The EURINR below hourly chart suggest prices as the current trend is down.
Price Pattern: The price pattern of the EURINR is showing the sideways to downtrend fashion. As the break of the 79.00 level on hourly basis will put EURINR back to the 78.50 levels.
Moving Average: The short term moving average 20 EMA is also confirming the trend to be down with add confirmation to our view with respect to the price pattern
MACD: The MACD indicator now has given a clear sell signal once the major confirmation comes from price MACD will soon approach to over sold region.
RSI: RSI is clearly giving the weakness in the pair with its now well below the mid –range level 50
ADX: ADX is now catching the strength for the trend to begin which we expect to be a down trend as ADX will start reading the higher values.
Economic Indicators Date Time Data Prior Expected Impact
18.09.14
3:45 PM
No Data For EURO Today
3. 18th Sept 2014 Currency Highlights
GBPINR
GBPINR Technical View:
The below is the hourly chart of GBPINR with prices are now at crucial price zone.
Moving Average: The short term trend decider 20 EMA is will be the only hope for the short term bullishness in pound. With any move to take the prices below the 20 EMA on hourly basis will be strong confirmation for GBPINR to be bearish.
MACD: The MACD indicator is confirming the sideways trend in GBPINR as prices are trading at the crucial levels. Only a strong down or up break will change the MACD values.
RSI: RSI is now the only indicator which suggesting the strength to hold as its above the mid-range level 50. Any reading below will add confirmation of change of pound from sideways to down trend.
ADX : The ADX has starts getting strength as is now it sis reading above the 20 levels. This is the early indication nof a strong trending move to come in GBPINR with respect to the price move.
Economic Indicators Date Time Data Prior Expected Impact
18.09.14
2:00 PM Retail Sales m/m
0.1%
0.4%
Actual>Expected=Good for GBP
18.09.14
3:30 PM CBI Industrial Order Expectations
11
9
Actual>Expected=Good for GBP
4. 18th Sept 2014 Currency Highlights
JPYINR
JPYINR Technical View:
The below is the hourly chart of JPYINR with prices are confirming the downtrend.
Moving Average: The prices of JPYINR are now trading well below the 20 EMA which clearly signal the downtrend in the yen.
MACD: MACD indicator has clearly given the negative crossover signal confirming the intermediate trend in JPYINR is down with a strong depreciation in yen to continue against rupee.
RSI: RSI is also clearly signaling the downtrend as its values are near the oversold region and to remain below the mid – range level 50 adding confirmation of downtrend to continue.
ADX: ADX is now catching the strength confirming the downtrend in JPYINR will continue as prices to read at more lower levels.
Economic Indicators Date Time Data Prior Expected Impact
18.09.14
05:20 AM Trade Balance
-1.02T
-0.99T
Actual>Expected=Good for JPY
18.09.14
12:05 PM BOJ Gov Kuroda Speaks
More hawkish = Good for JPY
6. 18th Sept 2014 Currency Highlights
Disclaimer
This is solely for information of clients of Choice India and does not construe to be an investment advice. It is also not intended as an offer or solicitation for the purchase and sale of any financial instruments. Any action taken by you on the basis of the information contained herein is your responsibility alone and Choice India its subsidiaries or its employees or associates will not be liable in any manner for the consequences of such action taken by you. We have exercised due diligence in checking the correctness and authenticity of the information contained in this recommendation, but Choice India or any of its subsidiaries or associates or employees shall not be in any way responsible for any loss or damage that may arise to any person from any inadvertent error in the information contained in this recommendation or any action taken on basis of this information. Technical analysis studies market psychology, price patterns and volume levels. It is used to forecast future price and market movements. Technical analysis is complementary to fundamental analysis and news sources. The recommendations issued herewith might be contrary to recommendations issued by Choice India in the company research undertaken as the recommendations stated in this report is derived purely from technical analysis. Choice India has based this document on information obtained from sources it believes to be reliable but which it has not independently verified; Choice India makes no guarantee, representation or warranty and accepts no responsibility or liability as to its accuracy or completeness. The opinions contained within the report are based upon publicly available information at the time of publication and are subject to change without notice. The information and any disclosures provided herein are in summary form and have been prepared for informational purposes. The recommendations and suggested price levels are intended purely for trading purposes. The recommendations are valid for the day of the report however trading trends and volumes might vary substantially on an intraday basis and the recommendations may be subject to change. The information and any disclosures provided herein may be considered confidential. Any use, distribution, modification, copying, forwarding or disclosure by any person is strictly prohibited. The information and any disclosures provided herein do not constitute a solicitation or offer to purchase or sell any security or other financial product or instrument. The current performance may be unaudited. Past performance does not guarantee future returns. There can be no assurance that investments will achieve any targeted rates of return, and there is no guarantee against the loss of your entire investment.
POTENTIAL CONFLICT OF INTEREST DISCLOSURE (as on date of report) Disclosure of interest statement – • Analyst interest of the stock /Instrument(s): - No. • Firm interest of the stock / Instrument (s): - No.