Download to read offline
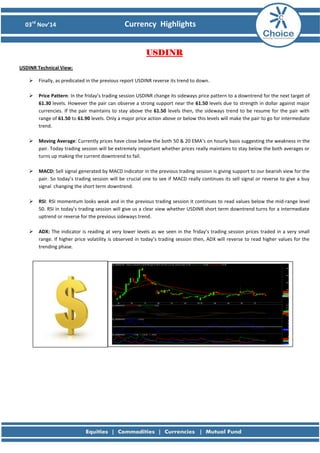
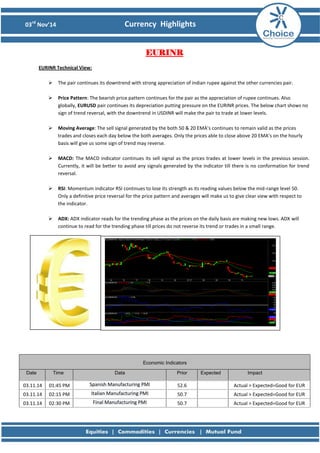
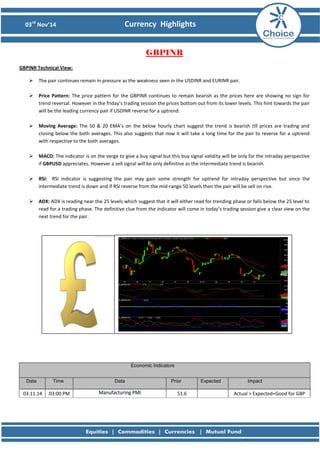
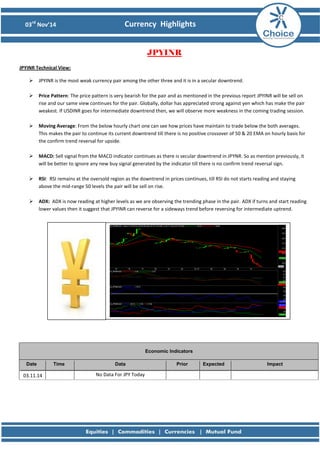


The document provides a technical analysis of currency pairs USDINR, EURINR, GBPINR, and JPYINR. It finds that USDINR and JPYINR are in downtrends, while EURINR and GBPINR remain under pressure. Moving averages and technical indicators like MACD and RSI suggest bearish trends. Economic data from the US and Europe could impact the currency pairs if they are better than expected. The analysis provides targets and support levels for the currency pairs and will monitor technical indicators to see if trends confirm or reverse.


