
Recommended
More Related Content
What's hot
What's hot (20)
Similar to Techno buy dlinkindia
Similar to Techno buy dlinkindia (18)
Recently uploaded
Recently uploaded (20)
Techno buy dlinkindia
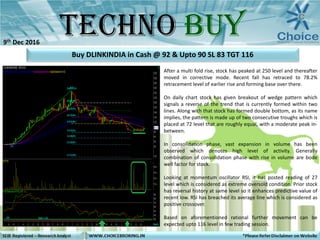
- 1. After a multi fold rise, stock has peaked at 250 level and thereafter moved in corrective mode. Recent fall has retraced to 78.2% retracement level of earlier rise and forming base over there. On daily chart stock has given breakout of wedge pattern which signals a reverse of the trend that is currently formed within two lines. Along with that stock has formed double bottom, as its name implies, the pattern is made up of two consecutive troughs which is placed at 72 level that are roughly equal, with a moderate peak in- between. In consolidation phase, vast expansion in volume has been observed which denotes high level of activity. Generally combination of consolidation phase with rise in volume are bode well factor for stock. Looking at momentum oscillator RSI, it has posted reading of 27 level which is considered as extreme oversold condition. Prior stock has reversal history at same level so it enhances predictive value of recent low. RSI has breached its average line which is considered as positive crossover. Based on aforementioned rational further movement can be expected upto 116 level in few trading session. Buy DLINKINDIA in Cash @ 92 & Upto 90 SL 83 TGT 116 9th Dec 2016
- 2. Contact Us Disclaimer This is solely for information of clients of Choice Broking and does not construe to be an investment advice. It is also not intended as an offer or solicitation for the purchase and sale of any financial instruments. Any action taken by you on the basis of the information contained herein is your responsibility alone and Choice Broking its subsidiaries or its employees or associates will not be liable in any manner for the consequences of such action taken by you. We have exercised due diligence in checking the correctness and authenticity of the information contained in this recommendation, but Choice Broking or any of its subsidiaries or associates or employees shall not be in any way responsible for any loss or damage that may arise to any person from any inadvertent error in the information contained in this recommendation or any action taken on basis of this information. Technical analysis studies market psychology, price patterns and volume levels. It is used to forecast future price and market movements. Technical analysis is complementary to fundamental analysis and news sources. The recommendations issued herewith might be contrary to recommendations issued by Choice Broking in the company research undertaken as the recommendations stated in this report is derived purely from technical analysis. Choice Broking has based this document on information obtained from sources it believes to be reliable but which it has not independently verified; Choice Broking makes no guarantee, representation or warranty and accepts no responsibility or liability as to its accuracy or completeness. The opinions contained within the report are based upon publicly available information at the time of publication and are subject to change without notice. The information and any disclosures provided herein are in summary form and have been prepared for informational purposes. The recommendations and suggested price levels are intended purely for trading purposes. The recommendations are valid for the day of the report however trading trends and volumes might vary substantially on an intraday basis and the recommendations may be subject to change. The information and any disclosures provided herein may be considered confidential. Any use, distribution, modification, copying, forwarding or disclosure by any person is strictly prohibited. The information and any disclosures provided herein do not constitute a solicitation or offer to purchase or sell any security or other financial product or instrument. The current performance may be unaudited. Past performance does not guarantee future returns. There can be no assurance that investments will achieve any targeted rates of return, and there is no guarantee against the loss of your entire investment. POTENTIAL CONFLICT OF INTEREST DISCLOSURE (as on date of report) Disclosure of interest statement – • Analyst interest of the stock /Instrument(s): - No. • Firm interest of the stock / Instrument (s): - No. www.choiceindia.comcustomercare@choiceindia.com Research Team Mr. Sumeet Bagadia Associate Director Kkunal Parar Sr. Research Associate Amit Pathania Research Associate Kapil Shah Research Associate Vikas Chaudhari Research Associate Rohan Patil Research Associate Trirashmi Ghoderao Research Advisor Neeraj Yadav Research Advisor WWW.CHOICEBROKING.IN 9th Dec 2016 Kapil Shah Digitally signed by Kapil Shah DN: cn=Kapil Shah, o=Choice Equity Pvt Ltd, ou=Research Team, email=kapil.shah@choiceindia.com, c=US Date: 2016.12.09 16:20:45 +05'30'