SlideShare a Scribd company logo
1 of 23
Download to read offline
Jeanette Schwarz Young, CFP®
, CMT, M.S.
Jordan Young, CMT
83 Highwood Terrace
Weehawken, New Jersey 07086
www.OptnQueen.com
February 22, 2015
The Option Queen Letter
By the Option Royals
It is very disheartening to hear people with aspirations of leadership soft peddle their opinions on
very serious issues to national security, in the name of censorship and polling numbers. Former
NYC Mayor Rudy Giuliani delivered his very passionate and honest opinions in a February 13th
speech regarding Islamic extremism. This address was reminiscent of famous speeches of times
past such as Ronald Reagan’s “a time for choosing” and Lyndon Johnson’s “American Promise.”
Sadly, we were reminded that today’s media, shaped by instant polling numbers, split second
news and sentence long stories, such honesty and passion is, more often than not, a dangerous
gamble. We were saddened to see several Presidential hopefuls meet the former Mayor’s words
with weak mealy mouthed statements, hoping to move on to the next less controversial topic as
soon as humanly possible.. Not one of the Presidential hopefuls interviewed had a backbone.
Their comments were, at best, wishy washy and without any value at all. This highlights a
second problem now faced by our government. The lack of backbone among leaders forged
through our instant gratification society not only has detrimental effects on domestic policy, but
created a perception of weakness among some of the less democratic leaders on the world stage.
The market rejoiced in the Friday session feeling that the Greek tragedy would be resolved and
hoping for the stabilization of the EU. The series of new highs printed in the S&P 500 this past
week, were without increased volume, which, is not a “good thing.”
Here is the down and dirty on the markets to date: the strong US dollar is killing our export
business but the US risk free interest rates are considerably higher than that elsewhere and our
currency is strong. Our economy will slow down because the multinationals will be unable to
export as much as the used to, the oil industry is contracting and not expanding and simply put,
people will be losing their jobs. Did Syria solve its problems, no? Is there peace in Iran and
Iraq? Is Egypt in the clear? Are Greece, Spain, Italy, Portugal and Turkey all in the clear now?
Is Putin standing down from the Ukraine? Is there a peace that we haven’t heard about? No!
The US looks safe and money is pouring into our markets. The sentiment indicators are wildly
bullish….and now would be a good time to take some of your profits off the table and perhaps
invest them in places which have more upside potential. Months ago we suggested the EU as a
possible place. Be open to other places.
The S&P 500 rallied in the Friday session adding 12 handles (points) and printing a new life of
contract high. The candlestick seen for that session had a wide range for that day. The close was
near the high for the day and we have signs of exhaustion in this market. We are overbought as
measured by the stochastic indicator and the RSI, but we continue to point to higher levels.
Remember we can remain overbought for a long time. We have been overbought for most of
February. Sadly, the volume is not confirming the action seen and we are concerned that there is
not more volume. We are above the Ichimoku Clouds for all time-frames. The 5-period
exponential moving average is 2095.58. The top of the Bollinger Band is 2122.21 and the lower
edge is seen at 1985.75. The most frequently traded price in the Friday session was 2094. The
daily 1% by 3-box point and figure chart has multiple internal upside trendlines and an upside
target of 2819.43. There is nothing negative about this chart. The 60 minute 0.1% by 3-box
point and figure chart is also very positive. We continue to advise that you keep your trailing
stops tight. We believe that so long as the market rallies that trend following systems will be in
the market and that this rally can last a bit longer. We are prepared for retreats and also
understand that those who missed the upswing in the market will take any retreat as an
opportunity to dog-pile into the market.
The NASDAQ 100 gained 28 handles (points) in the Friday session completing an eight day
rally. Unfortunately, this rally as well as the previous day’s rally did not show heavy volume.
We have signs of exhaustion in this market. As to our indicators, the stochastic indicator, our
own indicator and the RSI continue to point higher albeit at overbought levels. The Thomas
DeMark Expert indicator is pointing lower. We did see this index print a new high for the year
in the Friday session. The most frequently traded price in the Friday session was 4412.80-
4414.40. The 5-period exponential moving average is 4398.44. The top of the Bollinger Band is
4454.02 and the lower edge is seen at 4090.29. We can project a new high of 4615.25 based on
the range shown on the daily chart. The 60 minute 0.1% by 3-box chart is extremely positive
with nothing negative, save the lack of volume, to be of concern. The daily 1% by 3-box chart
has an upside target of 4711.59, again, there is nothing negative on this chart. We are above the
Ichimoku Clouds for all time-frames. Again as with the S&P 500 keep your trailing stops tight.
The Russell 2000 underperformed in the Friday session adding 1.10 on the day in a very long
tailed doji-like candlestick. This session did print a life of contract high and printed a marginally
high close on the day. The Friday session marked the ninth rally day in a row, which is unusual
to see. The 5-period exponential moving average is 1224.44. The top of the Bollinger Band is
1240.24 and the lower edge is seen at 1163.75. The upward trending channel lines are 1213.70
and 1240.10. The stochastic indicator has just issued a sell-signal but the RSI continues to
remain flattish. Our own indicator has issued a sell-signal. The most frequently traded price was
1226.40. The high volume price was 1225.60 which accounted for 7.1% of the day’s volume.
The Russell 2000 looks as though we might see some profit taking within a session or two. Keep
your stops tight.
Crude oil seems to be in a trading range between 48.13 and 55.01. All of the indicators that we
follow herein are issuing a sell-signal, but to be clear, they haven’t worked well at all and
trendlines have worked much better. The 5-period exponential moving average is 51.73. The
top of the Bollinger Band is 55.86 and the lower edge is seen at 44.49. The Bollinger Bands are
becoming narrow again indicating to us that another push, either to the downside or the upside
will appear soon. The 60 minute 0.2% by 3-box chart shows a broken uptrend line and a very
firm downtrend line, the chart does not look very positive. The daily 1% by 3-box chart has an
internal uptrend line and a very firm downtrend line. The market looks as though it could be
consolidating or in a trading range. Time will tell us which way this market will break. The
most frequently traded price in the Friday session was 51.80. Until or unless this market breaks
above the 55 area or below the 48 area, we will stand aside and wait for a direction. If you are a
risk taker, it might be okay to try to use the range as sells and buys. We are less inclined to do
this because we remember how violent the breakouts can become.
Gold needs to hold the 1197.20 level or the door will be opened to 1168.6, 1142.60 and 1131.90.
The 5-period exponential moving average is 1211.41. The top of the Bollinger Band is 1309.70
and the lower edge is seen at 1187.50. The less steep down trending channel lines are 124367
and 1198.75. The steeper down trending channel lines are 1232.23 and 1188.90. The indicators
are oversold and continue to issue a sell-signal. The chart looks awful. The daily 1% by 3-box
point and figure chart looks as though this market is consolidating but continues to look negative.
The 60 minute 0.2% by 3-box point and figure chart has a downside target of 1165.54 and lots of
internal downtrend lines. There isn’t anything positive about that chart. The most frequently
traded price in the Friday session was 1208.00. We closed inside the Ichimoku Clouds for the
daily time-frame and below the clouds for both the weekly and the monthly time-frames. Stand
aside this market and wait for a clear breakdown or break to the upside. Right now, we favor the
downside.
The US Dollar Index spent this past week consolidating, closing the Friday session at 94.39. The
Bollinger Bands are currently contracting and the upper band is at 95.34 and the lower band is at
93.74. The 20-period simple moving average is 94.54, which the index is currently below and the
5-period simple moving average is 94.37, which the index is just above. The RSI has been
making lower lows and continues to point lower while our own indicator is issuing a buy signal.
Starting with the daily chart, we can see the index has formed a triangle and has an inflection
point around March 15th
. We are currently resting on the 94.40 trend line. Below this level we
find 93.96 followed by 92.66. We continue to need to go out to the monthly chart to see the next
level of resistance which is 97.38. The 30 minute 0.05 x 3 point and figure chart shows we have
moved into a down trend and currently have an unactivated downside target at 93.70. There are
two activated upside targets at 95.20 and 95.55. The index will likely continue to back and fill,
possibly pulling back just slightly before making another drive to the upside.
Risk
Trading Futures, Options on Futures, and retail off-exchange foreign currency transactions
involves substantial risk of loss and is not suitable for all investors. You should carefully
consider whether trading is suitable for you in light of your circumstances, knowledge, and
financial resources. You may lose all or more of your initial investment

More Related Content

What's hot

April 10, 2016
April 10, 2016April 10, 2016
April 10, 2016Scutify
 
December 14, 2015.docx with charts
December 14, 2015.docx with chartsDecember 14, 2015.docx with charts
December 14, 2015.docx with chartsScutify
 
Deceember 28,2015 with charts
Deceember 28,2015 with chartsDeceember 28,2015 with charts
Deceember 28,2015 with chartsScutify
 
November 22, 2015 with charts
November 22, 2015 with chartsNovember 22, 2015 with charts
November 22, 2015 with chartsScutify
 
February 14 2016.docx with charts
February 14 2016.docx with chartsFebruary 14 2016.docx with charts
February 14 2016.docx with chartsScutify
 
May 1, 2016.docx with charts
May 1, 2016.docx with chartsMay 1, 2016.docx with charts
May 1, 2016.docx with chartsScutify
 
June 19, 2016.docx with charts
June 19, 2016.docx with chartsJune 19, 2016.docx with charts
June 19, 2016.docx with chartsScutify
 
April 24, 2016.docx with charts
April 24, 2016.docx with chartsApril 24, 2016.docx with charts
April 24, 2016.docx with chartsScutify
 
September 4, 2016.docx with charts
September 4, 2016.docx with chartsSeptember 4, 2016.docx with charts
September 4, 2016.docx with chartsScutify
 
March 20, 2016.docx with charts
March 20, 2016.docx    with chartsMarch 20, 2016.docx    with charts
March 20, 2016.docx with chartsScutify
 
May 15, 2016.docx with charts
May 15, 2016.docx with chartsMay 15, 2016.docx with charts
May 15, 2016.docx with chartsScutify
 
May 22, 2016.docx edited
May 22, 2016.docx editedMay 22, 2016.docx edited
May 22, 2016.docx editedScutify
 
January 10, 2016
January 10, 2016January 10, 2016
January 10, 2016Scutify
 
May 8, 2016.docx with charts
May 8, 2016.docx with chartsMay 8, 2016.docx with charts
May 8, 2016.docx with chartsScutify
 
July 10, 2016.docx with charts
July 10, 2016.docx with chartsJuly 10, 2016.docx with charts
July 10, 2016.docx with chartsScutify
 
April 17, 2016.docx with charts jcy edits
April 17, 2016.docx with charts jcy editsApril 17, 2016.docx with charts jcy edits
April 17, 2016.docx with charts jcy editsScutify
 
July 24, 2016.docx with charts
July 24, 2016.docx with chartsJuly 24, 2016.docx with charts
July 24, 2016.docx with chartsScutify
 
June 26, 2016 edited.docx with charts
June 26, 2016 edited.docx with chartsJune 26, 2016 edited.docx with charts
June 26, 2016 edited.docx with chartsScutify
 
July 31, 2016.docx with charts
July 31, 2016.docx with chartsJuly 31, 2016.docx with charts
July 31, 2016.docx with chartsScutify
 
February 21, 2016.docx with charts
February 21, 2016.docx with charts February 21, 2016.docx with charts
February 21, 2016.docx with charts Scutify
 

What's hot (20)

April 10, 2016
April 10, 2016April 10, 2016
April 10, 2016
 
December 14, 2015.docx with charts
December 14, 2015.docx with chartsDecember 14, 2015.docx with charts
December 14, 2015.docx with charts
 
Deceember 28,2015 with charts
Deceember 28,2015 with chartsDeceember 28,2015 with charts
Deceember 28,2015 with charts
 
November 22, 2015 with charts
November 22, 2015 with chartsNovember 22, 2015 with charts
November 22, 2015 with charts
 
February 14 2016.docx with charts
February 14 2016.docx with chartsFebruary 14 2016.docx with charts
February 14 2016.docx with charts
 
May 1, 2016.docx with charts
May 1, 2016.docx with chartsMay 1, 2016.docx with charts
May 1, 2016.docx with charts
 
June 19, 2016.docx with charts
June 19, 2016.docx with chartsJune 19, 2016.docx with charts
June 19, 2016.docx with charts
 
April 24, 2016.docx with charts
April 24, 2016.docx with chartsApril 24, 2016.docx with charts
April 24, 2016.docx with charts
 
September 4, 2016.docx with charts
September 4, 2016.docx with chartsSeptember 4, 2016.docx with charts
September 4, 2016.docx with charts
 
March 20, 2016.docx with charts
March 20, 2016.docx    with chartsMarch 20, 2016.docx    with charts
March 20, 2016.docx with charts
 
May 15, 2016.docx with charts
May 15, 2016.docx with chartsMay 15, 2016.docx with charts
May 15, 2016.docx with charts
 
May 22, 2016.docx edited
May 22, 2016.docx editedMay 22, 2016.docx edited
May 22, 2016.docx edited
 
January 10, 2016
January 10, 2016January 10, 2016
January 10, 2016
 
May 8, 2016.docx with charts
May 8, 2016.docx with chartsMay 8, 2016.docx with charts
May 8, 2016.docx with charts
 
July 10, 2016.docx with charts
July 10, 2016.docx with chartsJuly 10, 2016.docx with charts
July 10, 2016.docx with charts
 
April 17, 2016.docx with charts jcy edits
April 17, 2016.docx with charts jcy editsApril 17, 2016.docx with charts jcy edits
April 17, 2016.docx with charts jcy edits
 
July 24, 2016.docx with charts
July 24, 2016.docx with chartsJuly 24, 2016.docx with charts
July 24, 2016.docx with charts
 
June 26, 2016 edited.docx with charts
June 26, 2016 edited.docx with chartsJune 26, 2016 edited.docx with charts
June 26, 2016 edited.docx with charts
 
July 31, 2016.docx with charts
July 31, 2016.docx with chartsJuly 31, 2016.docx with charts
July 31, 2016.docx with charts
 
February 21, 2016.docx with charts
February 21, 2016.docx with charts February 21, 2016.docx with charts
February 21, 2016.docx with charts
 

Similar to February 22, 2015 with charts

September 14, 2014 with charts
September 14, 2014 with chartsSeptember 14, 2014 with charts
September 14, 2014 with chartsScutify
 
September 21, 2014 with charts
September 21, 2014 with chartsSeptember 21, 2014 with charts
September 21, 2014 with chartsScutify
 
September 7, 2014 with charts
September 7, 2014 with chartsSeptember 7, 2014 with charts
September 7, 2014 with chartsScutify
 
August 31, 2014 with Charts
August 31, 2014 with ChartsAugust 31, 2014 with Charts
August 31, 2014 with ChartsScutify
 
February 1, 2015 with charts
February 1, 2015 with chartsFebruary 1, 2015 with charts
February 1, 2015 with chartsScutify
 
The Option Queen Letter for July 27 2014
The Option Queen Letter for July 27 2014The Option Queen Letter for July 27 2014
The Option Queen Letter for July 27 2014Scutify
 
Option Queen Newsletter July 20, 2014 with charts
Option Queen Newsletter July 20, 2014 with chartsOption Queen Newsletter July 20, 2014 with charts
Option Queen Newsletter July 20, 2014 with chartsScutify
 
November 23, 2014 with charts
November 23, 2014 with chartsNovember 23, 2014 with charts
November 23, 2014 with chartsScutify
 
January 24, 2015 with charts
January 24, 2015 with chartsJanuary 24, 2015 with charts
January 24, 2015 with chartsScutify
 
September 28, 2014 with charts
September 28, 2014 with chartsSeptember 28, 2014 with charts
September 28, 2014 with chartsScutify
 
January 18, 2015 with charts
January 18, 2015 with chartsJanuary 18, 2015 with charts
January 18, 2015 with chartsScutify
 
November 2, 2014 with charts
November 2, 2014 with chartsNovember 2, 2014 with charts
November 2, 2014 with chartsScutify
 
January 11, 2015 with charts
January 11, 2015 with chartsJanuary 11, 2015 with charts
January 11, 2015 with chartsScutify
 
October 19, 2014 with charts
October 19, 2014 with chartsOctober 19, 2014 with charts
October 19, 2014 with chartsScutify
 
November 9, 2014 with charts
November 9, 2014 with chartsNovember 9, 2014 with charts
November 9, 2014 with chartsScutify
 
December 14, 2014 with charts
December 14, 2014 with chartsDecember 14, 2014 with charts
December 14, 2014 with chartsScutify
 

Similar to February 22, 2015 with charts (16)

September 14, 2014 with charts
September 14, 2014 with chartsSeptember 14, 2014 with charts
September 14, 2014 with charts
 
September 21, 2014 with charts
September 21, 2014 with chartsSeptember 21, 2014 with charts
September 21, 2014 with charts
 
September 7, 2014 with charts
September 7, 2014 with chartsSeptember 7, 2014 with charts
September 7, 2014 with charts
 
August 31, 2014 with Charts
August 31, 2014 with ChartsAugust 31, 2014 with Charts
August 31, 2014 with Charts
 
February 1, 2015 with charts
February 1, 2015 with chartsFebruary 1, 2015 with charts
February 1, 2015 with charts
 
The Option Queen Letter for July 27 2014
The Option Queen Letter for July 27 2014The Option Queen Letter for July 27 2014
The Option Queen Letter for July 27 2014
 
Option Queen Newsletter July 20, 2014 with charts
Option Queen Newsletter July 20, 2014 with chartsOption Queen Newsletter July 20, 2014 with charts
Option Queen Newsletter July 20, 2014 with charts
 
November 23, 2014 with charts
November 23, 2014 with chartsNovember 23, 2014 with charts
November 23, 2014 with charts
 
January 24, 2015 with charts
January 24, 2015 with chartsJanuary 24, 2015 with charts
January 24, 2015 with charts
 
September 28, 2014 with charts
September 28, 2014 with chartsSeptember 28, 2014 with charts
September 28, 2014 with charts
 
January 18, 2015 with charts
January 18, 2015 with chartsJanuary 18, 2015 with charts
January 18, 2015 with charts
 
November 2, 2014 with charts
November 2, 2014 with chartsNovember 2, 2014 with charts
November 2, 2014 with charts
 
January 11, 2015 with charts
January 11, 2015 with chartsJanuary 11, 2015 with charts
January 11, 2015 with charts
 
October 19, 2014 with charts
October 19, 2014 with chartsOctober 19, 2014 with charts
October 19, 2014 with charts
 
November 9, 2014 with charts
November 9, 2014 with chartsNovember 9, 2014 with charts
November 9, 2014 with charts
 
December 14, 2014 with charts
December 14, 2014 with chartsDecember 14, 2014 with charts
December 14, 2014 with charts
 

More from Scutify

September 25, 2016 market commentary
September 25, 2016 market commentarySeptember 25, 2016 market commentary
September 25, 2016 market commentaryScutify
 
Commsec 2014 Year in Review
Commsec 2014 Year in ReviewCommsec 2014 Year in Review
Commsec 2014 Year in ReviewScutify
 
December 29, 2014 with charts
December 29, 2014 with chartsDecember 29, 2014 with charts
December 29, 2014 with chartsScutify
 
Document
DocumentDocument
DocumentScutify
 
Gold threatens four
Gold threatens fourGold threatens four
Gold threatens fourScutify
 
Features of Trading stocks on Scutify
Features of Trading stocks on ScutifyFeatures of Trading stocks on Scutify
Features of Trading stocks on ScutifyScutify
 

More from Scutify (6)

September 25, 2016 market commentary
September 25, 2016 market commentarySeptember 25, 2016 market commentary
September 25, 2016 market commentary
 
Commsec 2014 Year in Review
Commsec 2014 Year in ReviewCommsec 2014 Year in Review
Commsec 2014 Year in Review
 
December 29, 2014 with charts
December 29, 2014 with chartsDecember 29, 2014 with charts
December 29, 2014 with charts
 
Document
DocumentDocument
Document
 
Gold threatens four
Gold threatens fourGold threatens four
Gold threatens four
 
Features of Trading stocks on Scutify
Features of Trading stocks on ScutifyFeatures of Trading stocks on Scutify
Features of Trading stocks on Scutify
 

Recently uploaded

03_Emmanuel Ndiaye_Degroof Petercam.pptx
03_Emmanuel Ndiaye_Degroof Petercam.pptx03_Emmanuel Ndiaye_Degroof Petercam.pptx
03_Emmanuel Ndiaye_Degroof Petercam.pptxFinTech Belgium
 
The Economic History of the U.S. Lecture 19.pdf
The Economic History of the U.S. Lecture 19.pdfThe Economic History of the U.S. Lecture 19.pdf
The Economic History of the U.S. Lecture 19.pdfGale Pooley
 
06_Joeri Van Speybroek_Dell_MeetupDora&Cybersecurity.pdf
06_Joeri Van Speybroek_Dell_MeetupDora&Cybersecurity.pdf06_Joeri Van Speybroek_Dell_MeetupDora&Cybersecurity.pdf
06_Joeri Van Speybroek_Dell_MeetupDora&Cybersecurity.pdfFinTech Belgium
 
Call Girls Koregaon Park Call Me 7737669865 Budget Friendly No Advance Booking
Call Girls Koregaon Park Call Me 7737669865 Budget Friendly No Advance BookingCall Girls Koregaon Park Call Me 7737669865 Budget Friendly No Advance Booking
Call Girls Koregaon Park Call Me 7737669865 Budget Friendly No Advance Bookingroncy bisnoi
 
Solution Manual for Financial Accounting, 11th Edition by Robert Libby, Patri...
Solution Manual for Financial Accounting, 11th Edition by Robert Libby, Patri...Solution Manual for Financial Accounting, 11th Edition by Robert Libby, Patri...
Solution Manual for Financial Accounting, 11th Edition by Robert Libby, Patri...ssifa0344
 
The Economic History of the U.S. Lecture 20.pdf
The Economic History of the U.S. Lecture 20.pdfThe Economic History of the U.S. Lecture 20.pdf
The Economic History of the U.S. Lecture 20.pdfGale Pooley
 
Call US đź“ž 9892124323 âś… Kurla Call Girls In Kurla ( Mumbai ) secure service
Call US đź“ž 9892124323 âś… Kurla Call Girls In Kurla ( Mumbai ) secure serviceCall US đź“ž 9892124323 âś… Kurla Call Girls In Kurla ( Mumbai ) secure service
Call US đź“ž 9892124323 âś… Kurla Call Girls In Kurla ( Mumbai ) secure servicePooja Nehwal
 
Vip Call US đź“ž 7738631006 âś…Call Girls In Sakinaka ( Mumbai )
Vip Call US đź“ž 7738631006 âś…Call Girls In Sakinaka ( Mumbai )Vip Call US đź“ž 7738631006 âś…Call Girls In Sakinaka ( Mumbai )
Vip Call US đź“ž 7738631006 âś…Call Girls In Sakinaka ( Mumbai )Pooja Nehwal
 
Solution Manual for Principles of Corporate Finance 14th Edition by Richard B...
Solution Manual for Principles of Corporate Finance 14th Edition by Richard B...Solution Manual for Principles of Corporate Finance 14th Edition by Richard B...
Solution Manual for Principles of Corporate Finance 14th Edition by Richard B...ssifa0344
 
The Economic History of the U.S. Lecture 17.pdf
The Economic History of the U.S. Lecture 17.pdfThe Economic History of the U.S. Lecture 17.pdf
The Economic History of the U.S. Lecture 17.pdfGale Pooley
 
Dividend Policy and Dividend Decision Theories.pptx
Dividend Policy and Dividend Decision Theories.pptxDividend Policy and Dividend Decision Theories.pptx
Dividend Policy and Dividend Decision Theories.pptxanshikagoel52
 
The Economic History of the U.S. Lecture 23.pdf
The Economic History of the U.S. Lecture 23.pdfThe Economic History of the U.S. Lecture 23.pdf
The Economic History of the U.S. Lecture 23.pdfGale Pooley
 
The Economic History of the U.S. Lecture 21.pdf
The Economic History of the U.S. Lecture 21.pdfThe Economic History of the U.S. Lecture 21.pdf
The Economic History of the U.S. Lecture 21.pdfGale Pooley
 
(ANIKA) Budhwar Peth Call Girls Just Call 7001035870 [ Cash on Delivery ] Pun...
(ANIKA) Budhwar Peth Call Girls Just Call 7001035870 [ Cash on Delivery ] Pun...(ANIKA) Budhwar Peth Call Girls Just Call 7001035870 [ Cash on Delivery ] Pun...
(ANIKA) Budhwar Peth Call Girls Just Call 7001035870 [ Cash on Delivery ] Pun...ranjana rawat
 
VIP Kolkata Call Girl Serampore 👉 8250192130 Available With Room
VIP Kolkata Call Girl Serampore 👉 8250192130  Available With RoomVIP Kolkata Call Girl Serampore 👉 8250192130  Available With Room
VIP Kolkata Call Girl Serampore 👉 8250192130 Available With Roomdivyansh0kumar0
 
Andheri Call Girls In 9825968104 Mumbai Hot Models
Andheri Call Girls In 9825968104 Mumbai Hot ModelsAndheri Call Girls In 9825968104 Mumbai Hot Models
Andheri Call Girls In 9825968104 Mumbai Hot Modelshematsharma006
 
Booking open Available Pune Call Girls Shivane 6297143586 Call Hot Indian Gi...
Booking open Available Pune Call Girls Shivane  6297143586 Call Hot Indian Gi...Booking open Available Pune Call Girls Shivane  6297143586 Call Hot Indian Gi...
Booking open Available Pune Call Girls Shivane 6297143586 Call Hot Indian Gi...Call Girls in Nagpur High Profile
 
The Economic History of the U.S. Lecture 18.pdf
The Economic History of the U.S. Lecture 18.pdfThe Economic History of the U.S. Lecture 18.pdf
The Economic History of the U.S. Lecture 18.pdfGale Pooley
 
Instant Issue Debit Cards - High School Spirit
Instant Issue Debit Cards - High School SpiritInstant Issue Debit Cards - High School Spirit
Instant Issue Debit Cards - High School Spiritegoetzinger
 

Recently uploaded (20)

03_Emmanuel Ndiaye_Degroof Petercam.pptx
03_Emmanuel Ndiaye_Degroof Petercam.pptx03_Emmanuel Ndiaye_Degroof Petercam.pptx
03_Emmanuel Ndiaye_Degroof Petercam.pptx
 
The Economic History of the U.S. Lecture 19.pdf
The Economic History of the U.S. Lecture 19.pdfThe Economic History of the U.S. Lecture 19.pdf
The Economic History of the U.S. Lecture 19.pdf
 
06_Joeri Van Speybroek_Dell_MeetupDora&Cybersecurity.pdf
06_Joeri Van Speybroek_Dell_MeetupDora&Cybersecurity.pdf06_Joeri Van Speybroek_Dell_MeetupDora&Cybersecurity.pdf
06_Joeri Van Speybroek_Dell_MeetupDora&Cybersecurity.pdf
 
Call Girls Koregaon Park Call Me 7737669865 Budget Friendly No Advance Booking
Call Girls Koregaon Park Call Me 7737669865 Budget Friendly No Advance BookingCall Girls Koregaon Park Call Me 7737669865 Budget Friendly No Advance Booking
Call Girls Koregaon Park Call Me 7737669865 Budget Friendly No Advance Booking
 
Solution Manual for Financial Accounting, 11th Edition by Robert Libby, Patri...
Solution Manual for Financial Accounting, 11th Edition by Robert Libby, Patri...Solution Manual for Financial Accounting, 11th Edition by Robert Libby, Patri...
Solution Manual for Financial Accounting, 11th Edition by Robert Libby, Patri...
 
The Economic History of the U.S. Lecture 20.pdf
The Economic History of the U.S. Lecture 20.pdfThe Economic History of the U.S. Lecture 20.pdf
The Economic History of the U.S. Lecture 20.pdf
 
Call US đź“ž 9892124323 âś… Kurla Call Girls In Kurla ( Mumbai ) secure service
Call US đź“ž 9892124323 âś… Kurla Call Girls In Kurla ( Mumbai ) secure serviceCall US đź“ž 9892124323 âś… Kurla Call Girls In Kurla ( Mumbai ) secure service
Call US đź“ž 9892124323 âś… Kurla Call Girls In Kurla ( Mumbai ) secure service
 
Vip Call US đź“ž 7738631006 âś…Call Girls In Sakinaka ( Mumbai )
Vip Call US đź“ž 7738631006 âś…Call Girls In Sakinaka ( Mumbai )Vip Call US đź“ž 7738631006 âś…Call Girls In Sakinaka ( Mumbai )
Vip Call US đź“ž 7738631006 âś…Call Girls In Sakinaka ( Mumbai )
 
Solution Manual for Principles of Corporate Finance 14th Edition by Richard B...
Solution Manual for Principles of Corporate Finance 14th Edition by Richard B...Solution Manual for Principles of Corporate Finance 14th Edition by Richard B...
Solution Manual for Principles of Corporate Finance 14th Edition by Richard B...
 
The Economic History of the U.S. Lecture 17.pdf
The Economic History of the U.S. Lecture 17.pdfThe Economic History of the U.S. Lecture 17.pdf
The Economic History of the U.S. Lecture 17.pdf
 
Dividend Policy and Dividend Decision Theories.pptx
Dividend Policy and Dividend Decision Theories.pptxDividend Policy and Dividend Decision Theories.pptx
Dividend Policy and Dividend Decision Theories.pptx
 
The Economic History of the U.S. Lecture 23.pdf
The Economic History of the U.S. Lecture 23.pdfThe Economic History of the U.S. Lecture 23.pdf
The Economic History of the U.S. Lecture 23.pdf
 
The Economic History of the U.S. Lecture 21.pdf
The Economic History of the U.S. Lecture 21.pdfThe Economic History of the U.S. Lecture 21.pdf
The Economic History of the U.S. Lecture 21.pdf
 
(ANIKA) Budhwar Peth Call Girls Just Call 7001035870 [ Cash on Delivery ] Pun...
(ANIKA) Budhwar Peth Call Girls Just Call 7001035870 [ Cash on Delivery ] Pun...(ANIKA) Budhwar Peth Call Girls Just Call 7001035870 [ Cash on Delivery ] Pun...
(ANIKA) Budhwar Peth Call Girls Just Call 7001035870 [ Cash on Delivery ] Pun...
 
VIP Kolkata Call Girl Serampore 👉 8250192130 Available With Room
VIP Kolkata Call Girl Serampore 👉 8250192130  Available With RoomVIP Kolkata Call Girl Serampore 👉 8250192130  Available With Room
VIP Kolkata Call Girl Serampore 👉 8250192130 Available With Room
 
Andheri Call Girls In 9825968104 Mumbai Hot Models
Andheri Call Girls In 9825968104 Mumbai Hot ModelsAndheri Call Girls In 9825968104 Mumbai Hot Models
Andheri Call Girls In 9825968104 Mumbai Hot Models
 
Commercial Bank Economic Capsule - April 2024
Commercial Bank Economic Capsule - April 2024Commercial Bank Economic Capsule - April 2024
Commercial Bank Economic Capsule - April 2024
 
Booking open Available Pune Call Girls Shivane 6297143586 Call Hot Indian Gi...
Booking open Available Pune Call Girls Shivane  6297143586 Call Hot Indian Gi...Booking open Available Pune Call Girls Shivane  6297143586 Call Hot Indian Gi...
Booking open Available Pune Call Girls Shivane 6297143586 Call Hot Indian Gi...
 
The Economic History of the U.S. Lecture 18.pdf
The Economic History of the U.S. Lecture 18.pdfThe Economic History of the U.S. Lecture 18.pdf
The Economic History of the U.S. Lecture 18.pdf
 
Instant Issue Debit Cards - High School Spirit
Instant Issue Debit Cards - High School SpiritInstant Issue Debit Cards - High School Spirit
Instant Issue Debit Cards - High School Spirit
 

February 22, 2015 with charts

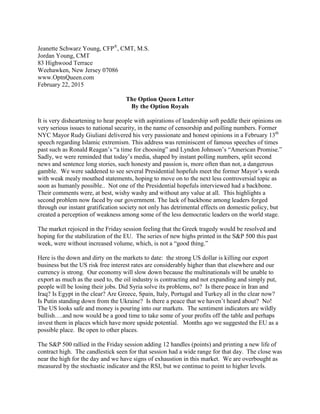
  • 1. Jeanette Schwarz Young, CFP® , CMT, M.S. Jordan Young, CMT 83 Highwood Terrace Weehawken, New Jersey 07086 www.OptnQueen.com February 22, 2015 The Option Queen Letter By the Option Royals It is very disheartening to hear people with aspirations of leadership soft peddle their opinions on very serious issues to national security, in the name of censorship and polling numbers. Former NYC Mayor Rudy Giuliani delivered his very passionate and honest opinions in a February 13th speech regarding Islamic extremism. This address was reminiscent of famous speeches of times past such as Ronald Reagan’s “a time for choosing” and Lyndon Johnson’s “American Promise.” Sadly, we were reminded that today’s media, shaped by instant polling numbers, split second news and sentence long stories, such honesty and passion is, more often than not, a dangerous gamble. We were saddened to see several Presidential hopefuls meet the former Mayor’s words with weak mealy mouthed statements, hoping to move on to the next less controversial topic as soon as humanly possible.. Not one of the Presidential hopefuls interviewed had a backbone. Their comments were, at best, wishy washy and without any value at all. This highlights a second problem now faced by our government. The lack of backbone among leaders forged through our instant gratification society not only has detrimental effects on domestic policy, but created a perception of weakness among some of the less democratic leaders on the world stage. The market rejoiced in the Friday session feeling that the Greek tragedy would be resolved and hoping for the stabilization of the EU. The series of new highs printed in the S&P 500 this past week, were without increased volume, which, is not a “good thing.” Here is the down and dirty on the markets to date: the strong US dollar is killing our export business but the US risk free interest rates are considerably higher than that elsewhere and our currency is strong. Our economy will slow down because the multinationals will be unable to export as much as the used to, the oil industry is contracting and not expanding and simply put, people will be losing their jobs. Did Syria solve its problems, no? Is there peace in Iran and Iraq? Is Egypt in the clear? Are Greece, Spain, Italy, Portugal and Turkey all in the clear now? Is Putin standing down from the Ukraine? Is there a peace that we haven’t heard about? No! The US looks safe and money is pouring into our markets. The sentiment indicators are wildly bullish….and now would be a good time to take some of your profits off the table and perhaps invest them in places which have more upside potential. Months ago we suggested the EU as a possible place. Be open to other places. The S&P 500 rallied in the Friday session adding 12 handles (points) and printing a new life of contract high. The candlestick seen for that session had a wide range for that day. The close was near the high for the day and we have signs of exhaustion in this market. We are overbought as measured by the stochastic indicator and the RSI, but we continue to point to higher levels.
  • 2. Remember we can remain overbought for a long time. We have been overbought for most of February. Sadly, the volume is not confirming the action seen and we are concerned that there is not more volume. We are above the Ichimoku Clouds for all time-frames. The 5-period exponential moving average is 2095.58. The top of the Bollinger Band is 2122.21 and the lower edge is seen at 1985.75. The most frequently traded price in the Friday session was 2094. The daily 1% by 3-box point and figure chart has multiple internal upside trendlines and an upside target of 2819.43. There is nothing negative about this chart. The 60 minute 0.1% by 3-box point and figure chart is also very positive. We continue to advise that you keep your trailing stops tight. We believe that so long as the market rallies that trend following systems will be in the market and that this rally can last a bit longer. We are prepared for retreats and also understand that those who missed the upswing in the market will take any retreat as an opportunity to dog-pile into the market.
  • 3.
  • 4.
  • 5. The NASDAQ 100 gained 28 handles (points) in the Friday session completing an eight day rally. Unfortunately, this rally as well as the previous day’s rally did not show heavy volume. We have signs of exhaustion in this market. As to our indicators, the stochastic indicator, our own indicator and the RSI continue to point higher albeit at overbought levels. The Thomas DeMark Expert indicator is pointing lower. We did see this index print a new high for the year in the Friday session. The most frequently traded price in the Friday session was 4412.80- 4414.40. The 5-period exponential moving average is 4398.44. The top of the Bollinger Band is 4454.02 and the lower edge is seen at 4090.29. We can project a new high of 4615.25 based on the range shown on the daily chart. The 60 minute 0.1% by 3-box chart is extremely positive with nothing negative, save the lack of volume, to be of concern. The daily 1% by 3-box chart has an upside target of 4711.59, again, there is nothing negative on this chart. We are above the Ichimoku Clouds for all time-frames. Again as with the S&P 500 keep your trailing stops tight.
  • 6.
  • 7.
  • 8.
  • 9. The Russell 2000 underperformed in the Friday session adding 1.10 on the day in a very long tailed doji-like candlestick. This session did print a life of contract high and printed a marginally high close on the day. The Friday session marked the ninth rally day in a row, which is unusual to see. The 5-period exponential moving average is 1224.44. The top of the Bollinger Band is 1240.24 and the lower edge is seen at 1163.75. The upward trending channel lines are 1213.70 and 1240.10. The stochastic indicator has just issued a sell-signal but the RSI continues to remain flattish. Our own indicator has issued a sell-signal. The most frequently traded price was 1226.40. The high volume price was 1225.60 which accounted for 7.1% of the day’s volume. The Russell 2000 looks as though we might see some profit taking within a session or two. Keep your stops tight.
  • 10.
  • 11.
  • 12. Crude oil seems to be in a trading range between 48.13 and 55.01. All of the indicators that we follow herein are issuing a sell-signal, but to be clear, they haven’t worked well at all and trendlines have worked much better. The 5-period exponential moving average is 51.73. The top of the Bollinger Band is 55.86 and the lower edge is seen at 44.49. The Bollinger Bands are becoming narrow again indicating to us that another push, either to the downside or the upside will appear soon. The 60 minute 0.2% by 3-box chart shows a broken uptrend line and a very firm downtrend line, the chart does not look very positive. The daily 1% by 3-box chart has an internal uptrend line and a very firm downtrend line. The market looks as though it could be consolidating or in a trading range. Time will tell us which way this market will break. The most frequently traded price in the Friday session was 51.80. Until or unless this market breaks above the 55 area or below the 48 area, we will stand aside and wait for a direction. If you are a risk taker, it might be okay to try to use the range as sells and buys. We are less inclined to do this because we remember how violent the breakouts can become.
  • 13.
  • 14.
  • 15.
  • 16. Gold needs to hold the 1197.20 level or the door will be opened to 1168.6, 1142.60 and 1131.90. The 5-period exponential moving average is 1211.41. The top of the Bollinger Band is 1309.70
  • 17. and the lower edge is seen at 1187.50. The less steep down trending channel lines are 124367 and 1198.75. The steeper down trending channel lines are 1232.23 and 1188.90. The indicators are oversold and continue to issue a sell-signal. The chart looks awful. The daily 1% by 3-box point and figure chart looks as though this market is consolidating but continues to look negative. The 60 minute 0.2% by 3-box point and figure chart has a downside target of 1165.54 and lots of internal downtrend lines. There isn’t anything positive about that chart. The most frequently traded price in the Friday session was 1208.00. We closed inside the Ichimoku Clouds for the daily time-frame and below the clouds for both the weekly and the monthly time-frames. Stand aside this market and wait for a clear breakdown or break to the upside. Right now, we favor the downside.
  • 18.
  • 19.
  • 20. The US Dollar Index spent this past week consolidating, closing the Friday session at 94.39. The Bollinger Bands are currently contracting and the upper band is at 95.34 and the lower band is at 93.74. The 20-period simple moving average is 94.54, which the index is currently below and the 5-period simple moving average is 94.37, which the index is just above. The RSI has been making lower lows and continues to point lower while our own indicator is issuing a buy signal. Starting with the daily chart, we can see the index has formed a triangle and has an inflection point around March 15th . We are currently resting on the 94.40 trend line. Below this level we find 93.96 followed by 92.66. We continue to need to go out to the monthly chart to see the next level of resistance which is 97.38. The 30 minute 0.05 x 3 point and figure chart shows we have moved into a down trend and currently have an unactivated downside target at 93.70. There are two activated upside targets at 95.20 and 95.55. The index will likely continue to back and fill, possibly pulling back just slightly before making another drive to the upside.
  • 21.
  • 22.
  • 23. Risk Trading Futures, Options on Futures, and retail off-exchange foreign currency transactions involves substantial risk of loss and is not suitable for all investors. You should carefully consider whether trading is suitable for you in light of your circumstances, knowledge, and financial resources. You may lose all or more of your initial investment