1. 10th Sept 2014 Currency Highlights
USDINR
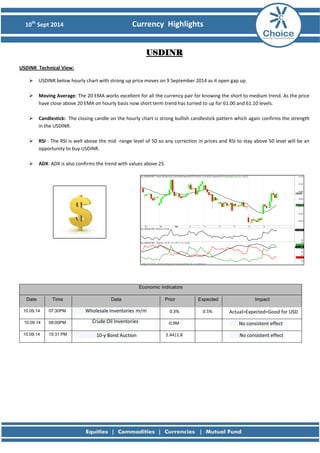
USDINR Technical View:
USDINR below hourly chart with strong up price moves on 9 September 2014 as it open gap up.
Moving Average: The 20 EMA works excellent for all the currency pair for knowing the short to medium trend. As the price have close above 20 EMA on hourly basis now short term trend has turned to up for 61.00 and 61.10 levels.
Candlestick: The closing candle on the hourly chart is strong bullish candlestick pattern which again confirms the strength in the USDINR.
RSI : The RSI is well above the mid -range level of 50 so any correction in prices and RSI to stay above 50 level will be an opportunity to buy USDINR.
ADX: ADX is also confirms the trend with values above 25.
Economic Indicators Date Time Data Prior Expected Impact
10.09.14
07:30PM Wholesale Inventories m/m
0.3%
0.5%
Actual>Expected=Good for USD
10.09.14
08:00PM Crude Oil Inventories
-0.9M
No consistent effect
10.09.14
10:31 PM 10-y Bond Auction
2.44|2.8
No consistent effect
2. 10th Sept 2014 Currency Highlights
EURINR
EURINR Technical View:
The EURINR below hourly chart represent the price are now near a important levels.
Moving Average: Prices of the pair EURINR are now just at 20EMA on hourly basis as the price will stay above the 20 EMA on hourly basis EURINR to fill the up gaps it made recently.
Candlestick: The First hourly candle for which EURINR formed its low is strong bullish candlestick pattern which confirms a short term uptrend in EURINR.
RSI: The RSI has now well above the oversold region of 30 on hourly basis which now confirm the uptrend.
ADX: ADX on hourly chart is flat but well above trend decider level of 25 so again any correction will be an buying opportunity in EURINR.
Economic Indicators Date Time Data Prior Expected Impact
10.09.14
11:00 AM French Final Non-Farm Payrolls q/q
0.1%
0.1%
Actual>Expected=Good for EUR
10.09.14
12:15 PM French Industrial Production m/m
1.3%
-0.4%
Actual>Expected=Good for EUR
10.09.14
Tentative German 10-y Bond Auction
No consistent effect
3. 10th Sept 2014 Currency Highlights
GBPINR
GBPINR Technical View:
The below is the hourly chart of GBPINR with prices at important reversal point.
Moving Average : The GBPINR prices are near 20 EMA on hourly chart and with prices to stay above on hourly basis GBPINR will fill its up gap it made recently for target of 99.00 level.
Candlestick Pattern : Like the USDINR & EURINR GBPINR has made a low with strong bullish candlestick pattern confirming the trend.
RSI : RSI on the hourly chart is breaks the oversold region 30 and to stay above it on hourly basis suggesting the more steam for GBPINR for short term uptrend.
ADX : ADX is above the 25 levels on the hourly basis any correction with ADX staying above 25 levels on hourly basis will give a strong trending move upside.
Economic Indicators Date Time Data Prior Expected Impact
10.09.14
07:15 PM Inflation Report Hearings
More hawkish =Good for GBP
4. 10th Sept 2014 Currency Highlights
JPYINR
JPYINR Technical View:
The below is the hourly chart of JPYINR with prices at important resistance level.
Moving Average : In below hourly chart prices has just near 20 EMA and prices staying above the 20 EMA on hourly basis will confirm its short term uptrend.
RSI : RSI has risen from its oversold 30 level with price supporting it still has steam for higher level supporting our view of short term uptrend in JPYINR.
ADX: ADX is just falling but well above the 25 level on hourly basis again it will be a supporter for JPYINR prices to move upwards
Economic Indicators Date Time Data Prior Expected Impact
10.09.14
05:20 AM Core Machinery Orders m/m
4.1%
8.8%
Actual>Expected=Good for JPY
10.09.14
05:20 AM PPI y/y
4.1%
4.3%
Actual>Expected=Good for JPY
6. 10th Sept 2014 Currency Highlights
Disclaimer
This is solely for information of clients of Choice India and does not construe to be an investment advice. It is also not intended as an offer or solicitation for the purchase and sale of any financial instruments. Any action taken by you on the basis of the information contained herein is your responsibility alone and Choice India its subsidiaries or its employees or associates will not be liable in any manner for the consequences of such action taken by you. We have exercised due diligence in checking the correctness and authenticity of the information contained in this recommendation, but Choice India or any of its subsidiaries or associates or employees shall not be in any way responsible for any loss or damage that may arise to any person from any inadvertent error in the information contained in this recommendation or any action taken on basis of this information. Technical analysis studies market psychology, price patterns and volume levels. It is used to forecast future price and market movements. Technical analysis is complementary to fundamental analysis and news sources. The recommendations issued herewith might be contrary to recommendations issued by Choice India in the company research undertaken as the recommendations stated in this report is derived purely from technical analysis. Choice India has based this document on information obtained from sources it believes to be reliable but which it has not independently verified; Choice India makes no guarantee, representation or warranty and accepts no responsibility or liability as to its accuracy or completeness. The opinions contained within the report are based upon publicly available information at the time of publication and are subject to change without notice. The information and any disclosures provided herein are in summary form and have been prepared for informational purposes. The recommendations and suggested price levels are intended purely for trading purposes. The recommendations are valid for the day of the report however trading trends and volumes might vary substantially on an intraday basis and the recommendations may be subject to change. The information and any disclosures provided herein may be considered confidential. Any use, distribution, modification, copying, forwarding or disclosure by any person is strictly prohibited. The information and any disclosures provided herein do not constitute a solicitation or offer to purchase or sell any security or other financial product or instrument. The current performance may be unaudited. Past performance does not guarantee future returns. There can be no assurance that investments will achieve any targeted rates of return, and there is no guarantee against the loss of your entire investment.
POTENTIAL CONFLICT OF INTEREST DISCLOSURE (as on date of report) Disclosure of interest statement – • Analyst interest of the stock /Instrument(s): - No. • Firm interest of the stock / Instrument (s): - No.