1. 08th Oct’ 14 Currency Highlights
USDINR
USDINR Technical View:
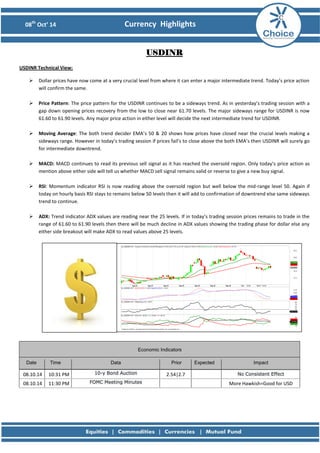
Dollar prices have now come at a very crucial level from where it can enter a major intermediate trend. Today’s price action will confirm the same.
Price Pattern: The price pattern for the USDINR continues to be a sideways trend. As in yesterday’s trading session with a gap down opening prices recovery from the low to close near 61.70 levels. The major sideways range for USDINR is now 61.60 to 61.90 levels. Any major price action in either level will decide the next intermediate trend for USDINR.
Moving Average: The both trend decider EMA’s 50 & 20 shows how prices have closed near the crucial levels making a sideways range. However in today’s trading session if prices fail’s to close above the both EMA’s then USDINR will surely go for intermediate downtrend.
MACD: MACD continues to read its previous sell signal as it has reached the oversold region. Only today’s price action as mention above either side will tell us whether MACD sell signal remains valid or reverse to give a new buy signal.
RSI: Momentum indicator RSI is now reading above the oversold region but well below the mid-range level 50. Again if today on hourly basis RSI stays to remains below 50 levels then it will add to confirmation of downtrend else same sideways trend to continue.
ADX: Trend indicator ADX values are reading near the 25 levels. If in today’s trading session prices remains to trade in the range of 61.60 to 61.90 levels then there will be much decline in ADX values showing the trading phase for dollar else any either side breakout will make ADX to read values above 25 levels.
Economic Indicators Date Time Data Prior Expected Impact
08.10.14
10:31 PM 10-y Bond Auction
2.54|2.7
No Consistent Effect
08.10.14
11:30 PM FOMC Meeting Minutes
More Hawkish=Good for USD
2. 08th Oct’ 14 Currency Highlights
EURINR
EURINR Technical View:
EURINR is still in downtrend till no major price action is form to reverse the trend to up.
Price Pattern: As seen in the below hourly chart prices of EURINR are making new lows each day with continuation of its strong downtrend. As mention till no major price action is form to reverse the trend EURINR will be sell on rise and also the weakest currency among others.
Moving Average: EURINR prices are continuously trading and closing below the trend decider EMA’s 50 & 20.So any upward move with prices staying below the both EMA’s will be a selling opportunity for the pair
MACD: Sell signal of MACD indicator continues with ongoing strong downtrend in EURINR prices. Here it will be better to ignore any buy signal from MACD till no major price reversal for upside is form.
RSI: Momentum in EURINR continues to remain weak with RSI reading values below mid-range level 50. Till RSI does not read its values well above the 50 levels EURINR will continue to shows its weak momentum.
ADX: ADX after reading the values below the 25 levels is now moving higher hinting the starts of trending phase for the pair. Here prices needs to be watchful if ADX is showing trending phase with prices still to make new lows in the coming trading session.
Economic Indicators Date Time Data Prior Expected Impact
08.10.14
No Data for EURO Today
3. 08th Oct’ 14 Currency Highlights
GBPINR
GBPINR Technical View:
GBPINR now confirms its intermediate trend is down with the weakness in GBPUSD pair.
Price Pattern: The price pattern for pound prices are in strong downtrend with sell on rise will be the best strategy for pound till no major price reversal for upside is form. Here the inter-market relationship of GBPINR with GBPUSD is also playing the major role for weakness in the pair giving confirmation for the downtrend in GBPINR.
Moving Average: From the below hourly chart for the pound it is clearly showing how prices are well below both EMA’s. This make pound to remain in strong downtrend till there no successful positive crossover of both EMA’s.
MACD: MACD continues its sell signal showing the continuation of downtrend in GBPINR prices. Now here also any buy signal given by the MACD indicator will be better to ignore till prices closes below the both EMA’s.
RSI: Momentum indicator RSI is strongly confirming downtrend for pound as its reading values below the mid-range level 50. Till RSI reads values below the mid-range level 50 pound will be sell on rise.
ADX: ADX indicator is showing the strong trending phase for the pair. As long as ADX is reading above the 25 levels pound will continue to be in a trending phase making downtrend to remain intact.
Economic Indicators Date Time Data Prior Expected Impact
08.10.14
04:31 AM BRC Shop Price Index y/y
-1.6%
Actual>Expected=Good for GBP
08.10.14
Halifax HPI m/m
0.1%
0.2%
Actual>Expected=Good for GBP
4. 08th Oct’ 14 Currency Highlights
JPYINR
JPYINR Technical View:
JPYINR has completely changed its downtrend and reverse its intermediate trend to up.
Price Pattern: JPYINR prices pattern show that is now the strongest currency among the other three. The inter-market relationship of the strong yen against dollar is also adding the ongoing strength for the pair.
Moving Average: Prices of yen have completely changed its trend with prices not only trading and closing above the 50 & 20 EMA’s on hourly basis but also made the positive crossover strongly confirming the trend is up till prices do not close below the both EMA’s
MACD: MACD indicator has completely change its previous sell signal to new buy signal going with the price action. Now MACD to approach over brought region and to remain valid as prices to make new highs.
RSI: RSI shows the strong gain in momentum going with the price action. With RSI breaking the mid-range level 50 and staying above it suggesting the pair to remain strong till RSI is reading above 50 levels.
ADX: ADX indicator also changed its previous trading phase to trending phase with its values now reading above the trending phase levels 25 suggesting the uptrend to remain intact.
Economic Indicators Date Time Data Prior Expected Impact
08.10.14
05:20 AM Current Account
0.10T
0.19T
Actual>Expected=Good for JPY
08.10.14
10:30 AM BOJ Monthly Report
More Hawkish=Good for JPY
08.10.14
10:30 AM Economy Watchers Sentiment
47.4
48.2
Actual>Expected=Good for JPY
6. 08th Oct’ 14 Currency Highlights
Disclaimer
This is solely for information of clients of Choice India and does not construe to be an investment advice. It is also not intended as an offer or solicitation for the purchase and sale of any financial instruments. Any action taken by you on the basis of the information contained herein is your responsibility alone and Choice India its subsidiaries or its employees or associates will not be liable in any manner for the consequences of such action taken by you. We have exercised due diligence in checking the correctness and authenticity of the information contained in this recommendation, but Choice India or any of its subsidiaries or associates or employees shall not be in any way responsible for any loss or damage that may arise to any person from any inadvertent error in the information contained in this recommendation or any action taken on basis of this information. Technical analysis studies market psychology, price patterns and volume levels. It is used to forecast future price and market movements. Technical analysis is complementary to fundamental analysis and news sources. The recommendations issued herewith might be contrary to recommendations issued by Choice India in the company research undertaken as the recommendations stated in this report is derived purely from technical analysis. Choice India has based this document on information obtained from sources it believes to be reliable but which it has not independently verified; Choice India makes no guarantee, representation or warranty and accepts no responsibility or liability as to its accuracy or completeness. The opinions contained within the report are based upon publicly available information at the time of publication and are subject to change without notice. The information and any disclosures provided herein are in summary form and have been prepared for informational purposes. The recommendations and suggested price levels are intended purely for trading purposes. The recommendations are valid for the day of the report however trading trends and volumes might vary substantially on an intraday basis and the recommendations may be subject to change. The information and any disclosures provided herein may be considered confidential. Any use, distribution, modification, copying, forwarding or disclosure by any person is strictly prohibited. The information and any disclosures provided herein do not constitute a solicitation or offer to purchase or sell any security or other financial product or instrument. The current performance may be unaudited. Past performance does not guarantee future returns. There can be no assurance that investments will achieve any targeted rates of return, and there is no guarantee against the loss of your entire investment.
POTENTIAL CONFLICT OF INTEREST DISCLOSURE (as on date of report) Disclosure of interest statement – • Analyst interest of the stock /Instrument(s): - No. • Firm interest of the stock / Instrument (s): - No.