1. 22nd Sept’ 2014 Currency Highlights
USDINR
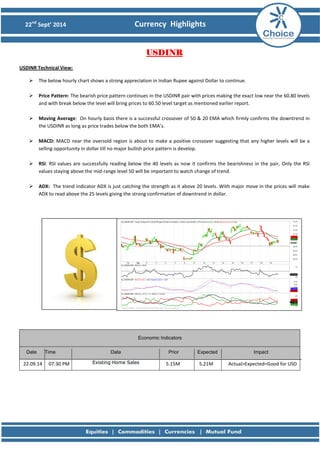
USDINR Technical View:
The below hourly chart shows a strong appreciation in Indian Rupee against Dollar to continue.
Price Pattern: The bearish price pattern continues in the USDINR pair with prices making the exact low near the 60.80 levels and with break below the level will bring prices to 60.50 level target as mentioned earlier report.
Moving Average: On hourly basis there is a successful crossover of 50 & 20 EMA which firmly confirms the downtrend in the USDINR as long as price trades below the both EMA’s.
MACD: MACD near the oversold region is about to make a positive crossover suggesting that any higher levels will be a selling opportunity in dollar till no major bullish price pattern is develop.
RSI: RSI values are successfully reading below the 40 levels as now it confirms the bearishness in the pair, Only the RSI values staying above the mid-range level 50 will be important to watch change of trend.
ADX: The trend indicator ADX is just catching the strength as it above 20 levels. With major move in the prices will make ADX to read above the 25 levels giving the strong confirmation of downtrend in dollar.
Economic Indicators Date Time Data Prior Expected Impact
22.09.14
07:30 PM Existing Home Sales
5.15M
5.21M
Actual>Expected=Good for USD
2. 22nd Sept’ 2014 Currency Highlights
EURINR
EURINR Technical View:
The EURINR below hourly chart clearly shows strong depreciation of Euro currency.
Price Pattern: In the yesterday’s trading session EURINR broken the intermediate trend line as seen in the chart and price for the all day traded well below the trend line breakout level 79.10 it will be soon approaching the 78.00 levels.
Moving Average: In EURINR with the break of the trend line there is 50 & 20 EMA negative crossover which makes the pair has enter a intermediate downtrend till the prices do not trade above the79.10 level.
MACD: MACD indicator is moving above the oversold region but again here with any up move but below the 79.10 level on hourly basis will be a selling opportunity.
RSI: RSI with range to stay below the mid-range level 50 strongly confirming downtrend in EURINR as long prices do not trade above the 50 level. So again with small strength in RSI values will provide opportunity to sell the pair.
ADX: Trending indicator ADX is now confirming the trending nature of the currency as its values are reading at 25 levels. ADX indicator is also giving the early hint of the strong down trending nature to follow in the pair.
Economic Indicators Date Time Data Prior Expected Impact
22.09.14
06:30 PM ECB President Draghi Speaks
More Hawkish = Good for EUR
22.09.14
07:30 PM Consumer Confidence
-10
-11
Actual>Expected=Good for EUR
3. 22nd Sept’ 2014 Currency Highlights
GBPINR
GBPINR Technical View:
GBPINR below hourly chart shows prices at the extremely crucial level for the start of its downtrend.
Moving Average: Both 50 EMA & 20 EMA on the below chart shows how prices are now at major support with break of 99.50 level will bring a strong downtrend in the pound to take its prices for the next target of 98.50 level.
MACD: MACD indicator has given the selling signal with an early confirmation for the downtrend in pound which as it is below the overbrought levels. Sooner values of MACD will approach the oversold region making pound for a intermediate bearishness
RSI: RSI values are refusing to break the mid-range 50 which is the only hope for the buyers in the pair. With break of this level today will make a strong confirmation of the downtrend in pound else RSI staying above the level will be early signal to seller’s of the pair to get alert.
ADX: ADX is still showing the non-trending nature as its values reading below the 25 level. With the break of the 99.50 levels in price ADX will show its strong trending nature of the pair.
Economic Indicators Date Time Data Prior Expected Impact
22.09.14
No Data For GBP Today
4. 22nd Sept’ 2014 Currency Highlights
JPYINR
JPYINR Technical View:
The below is the hourly chart of JPYINR shows the continuation of downtrend.
Moving Average: Prices of JPYINR are trading well below the both EMA 50 & 20 showing the continuation of the downtrend in the pair till prices do not trade above both EMA’s .
MACD: MACD has given as positive crossover on the hourly which has brings yen to close near the high in yesterday’s trading session. But the overall price pattern strong shows bearishness in the pair so any up move in the pair will be a selling opportunity.
RSI: RSI values are bottoming out from the oversold region. As the prices are moving higher in the yesterday’s intraday session but RSI if stayed below the mid-range level 50 will pull price back to lower values else to stay above 50 will be an early signal of reversal in JPYINR.
ADX: ADX after showing its strong trending nature in JPYINR is now hinting towards non-trending nature but the strong confirmation will come from the price movement only.
Economic Indicators Date Time Data Prior Expected Impact
22.09.14
No Data For JPY Today
6. 22nd Sept’ 2014 Currency Highlights
Disclaimer
This is solely for information of clients of Choice India and does not construe to be an investment advice. It is also not intended as an offer or solicitation for the purchase and sale of any financial instruments. Any action taken by you on the basis of the information contained herein is your responsibility alone and Choice India its subsidiaries or its employees or associates will not be liable in any manner for the consequences of such action taken by you. We have exercised due diligence in checking the correctness and authenticity of the information contained in this recommendation, but Choice India or any of its subsidiaries or associates or employees shall not be in any way responsible for any loss or damage that may arise to any person from any inadvertent error in the information contained in this recommendation or any action taken on basis of this information. Technical analysis studies market psychology, price patterns and volume levels. It is used to forecast future price and market movements. Technical analysis is complementary to fundamental analysis and news sources. The recommendations issued herewith might be contrary to recommendations issued by Choice India in the company research undertaken as the recommendations stated in this report is derived purely from technical analysis. Choice India has based this document on information obtained from sources it believes to be reliable but which it has not independently verified; Choice India makes no guarantee, representation or warranty and accepts no responsibility or liability as to its accuracy or completeness. The opinions contained within the report are based upon publicly available information at the time of publication and are subject to change without notice. The information and any disclosures provided herein are in summary form and have been prepared for informational purposes. The recommendations and suggested price levels are intended purely for trading purposes. The recommendations are valid for the day of the report however trading trends and volumes might vary substantially on an intraday basis and the recommendations may be subject to change. The information and any disclosures provided herein may be considered confidential. Any use, distribution, modification, copying, forwarding or disclosure by any person is strictly prohibited. The information and any disclosures provided herein do not constitute a solicitation or offer to purchase or sell any security or other financial product or instrument. The current performance may be unaudited. Past performance does not guarantee future returns. There can be no assurance that investments will achieve any targeted rates of return, and there is no guarantee against the loss of your entire investment.
POTENTIAL CONFLICT OF INTEREST DISCLOSURE (as on date of report) Disclosure of interest statement – • Analyst interest of the stock /Instrument(s): - No. • Firm interest of the stock / Instrument (s): - No.