Equity bazaar 10.10.14
•
0 likes•178 views

The document provides a technical analysis of the Nifty, Bank Nifty, Tata Steel stock, and derivatives. For Nifty, it notes a sharp bounce but sellers trying to dominate, and recommends buy positions above 8030 and sell below 7950. For Bank Nifty, it recommends buy above 15900 and sell below 15400. For Tata Steel, it recommends buy above 473 with a target of 520. It also provides support and resistance levels for various stocks and recommends overall bullish or bearish positions.

Recommended
More Related Content
What's hot
What's hot (15)
Viewers also liked
Viewers also liked (14)
Similar to Equity bazaar 10.10.14
Similar to Equity bazaar 10.10.14 (20)
Equity bazaar 10.10.14
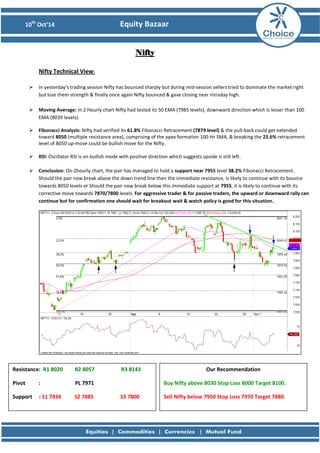
- 1. 10th Oct’14 Equity Bazaar Nifty Nifty Technical View: In yesterday’s trading session Nifty has bounced sharply but during mid-session sellers tried to dominate the market right but lose them strength & finally once again Nifty bounced & gave closing near intraday high. Moving Average: In 2 Hourly chart Nifty had tested its 50 EMA (7985 levels), downward direction which is lesser than 100 EMA (8039 levels). Fibonacci Analysis: Nifty had verified its 61.8% Fibonacci Retracement (7879 level) & the pull-back could get extended toward 8050 (multiple resistance area), comprising of the apex formation 100-Hr SMA, & breaking the 23.6% retracement level of 8050 up-move could be bullish move for the Nifty. RSI: Oscillator RSI is on bullish mode with positive direction which suggests upside is still left. Conclusion: On-2hourly chart, the pair has managed to hold a support near 7955 level 38.2% Fibonacci Retracement. Should the pair now break above the down trend line then the immediate resistance, is likely to continue with its bounce towards 8050 levels or Should the pair now break below this immediate support at 7955, it is likely to continue with its corrective move towards 7870/7800 levels. For aggressive trader & for passive traders, the upward or downward rally can continue but for confirmation one should wait for breakout wait & watch policy is good for this situation. Resistance: R1 8020 R2 8057 R3 8143 Pivot : PL 7971 Support : S1 7934 S2 7885 S3 7800 Our Recommendation Buy Nifty above 8030 Stop Loss 8000 Target 8100. Sell Nifty below 7950 Stop Loss 7970 Target 7880.
- 2. 10th Oct’14 Equity Bazaar Bank Nifty Bank Nifty Technical View: Yesterday, Bank Nifty gave sharp bounce after the gap up opening & buyers continued to dominate the market right from its lower level. Finally Bank Nifty has given almost 324 points upward rally from its day low. Candlestick Pattern: According to Daily chart, Bank Nifty has made “Long Green Candle” which means bulls were more aggressive & demanded more & more share whatever prices increases. Moving Average: In 2-hourly chart, The Bank Nifty is trading above the 50 EMA (15583) & near 100 EMA (15890) with broad distance which is an indication of ongoing bearish trend. Fibonacci Analysis: On the upside, 15889 the 23.6% Fibonacci levels are likely to provide immediate resistances to this pair, breaking which it can extend the upward rally towards the 16347 levels. Moreover, a sustained trading above 15606 can cause the pair 38.2% Fibonacci level considering the strong support. RSI: RSI currently near 65.92 levels & it is expected to bounce to 70 levels. Conclusion: The charts suggest that Bank Nifty may bounce further and expecting to breach the resistance at 15890. A key resistance lies at 15890 (see also the 200 Hour moving average) for belligerent trader & for flaccid traders wait & watch policy is good in this situation. Resistance: R1 15955 R2 16107 R3 16500 Pivot : PL 15717 Support : S1 15565 S2 15327 S3 14940 Our Recommendation Buy BNF above 15900 Stop Loss 15800 Target: 16300. Sell BNF below 15400 Stop Loss 15500 Target: 15000.
- 3. 10th Oct’14 Equity Bazaar Stock of the Day TATA STEEL View: After sideway correction Tata Steel has given downward trend line breakout and in yesterday’s trading session, we had seen gap up opening in Tata Steel. Candlestick Pattern: On daily chart we have seen “Bullish Engulfing Candlesticks” which clearly say’s buyers are demanded more & more share whatever prices increases. This could be the pre intimation of trend reversal. Moving Average: In Daily chart, Tata Steel has traded near its 50 SMA & below its 100 SMA. RSI: RSI currently trade near 56.82 levels expecting that still lots of upside is still left. Conclusion: The charts suggest that Tata Steel trades in upside track consequently tumble can be used as buying opportunities to test sophisticated levels for the day. For short term there is a possibility of upward rally and the next resistance would be watch around Rs.486/515 level. Resistance : R1 472 R2 477 R3 489 Pivot : PL 465 Support : S1 440 S2 452 S3 439 Our Recommendation Buy Tata Steel above 473 Stop Loss 465 Target: 520
- 4. 10th Oct’14 Equity Bazaar Derivative Analysis FIIS Data: FII’s are the net Seller on 9 th October 2014 is Rs 20.89 Cr and Dll’s are the net Buyer on 9 th October 2014 is Rs 623.24 Cr. Option Data: 8200 CE has the highest OI with 60 lakhs and 8100 CE has the second highest OI with 52 lakhs and 7800 PE has the highest OI with 63 lakhs and 7900 PE has the second highest OI with 51 lakhs. Open Interest: The above options data shows nifty has now a strong support at 8000 and resistance at 8200 the trend change level as per option data is 8100. Intraday Option Strategy: (A) Buy Nifty 8000 calls and Sell Nifty 8200 puts if buy level is breached. (B) Sell Nifty 8200 calls and Buy Nifty 7700 puts if sell level is breached.
- 5. 10th Oct’14 Equity Bazaar Symbol S3 S2 S1 P R1 R2 R3 Trend Action ACC 1322.48 1369.28 1399.17 1416.08 1445.97 1462.88 1509.68 UP Buy AMBUJACEM 199.97 207.07 211.43 214.17 218.53 221.27 228.37 UP Buy ASIANPAINT 614.83 632.88 644.02 650.93 662.07 668.98 687.03 UP Buy AXISBANK 368.47 377.27 382.33 386.07 391.13 394.87 403.67 UP Buy BAJAJ-AUTO 2267.32 2315.27 2345.68 2363.22 2393.63 2411.17 2459.12 UP Buy BANKBARODA 834.03 853.83 862.47 873.63 882.27 893.43 913.23 Down Sell BHEL 192.15 203.95 211.5 215.75 223.30 227.55 239.35 UP Buy BPCL 643.58 659.23 665.47 674.88 681.12 690.53 706.18 Down Sell BHARTIARTL 386.3 395.15 400.05 404.00 408.90 412.85 421.7 UP Buy CAIRN 285.52 291.32 294.93 297.12 300.73 302.92 308.72 UP Buy CIPLA 559.03 576.83 584.27 594.63 602.07 612.43 630.23 Down Sell COALINDIA 330.67 336.72 340.03 342.77 346.08 348.82 354.87 UP Buy DLF 141.75 146.95 149.9 152.15 155.10 157.35 162.55 UP Buy DRREDDY 2817.47 2906.62 2946.58 2995.77 3035.73 3084.92 3174.07 Down Sell GAIL 429.15 437.8 442.3 446.45 450.95 455.1 463.75 UP Buy GRASIM 3372.6 3432.4 3464.6 3492.20 3524.40 3552 3611.8 UP Buy HCLTECH 1614.17 1653.17 1674.33 1692.17 1713.33 1731.17 1770.17 UP Buy HDFCBANK 833.53 858.23 872.92 882.93 897.62 907.63 932.33 UP Buy HEROMOTOCO 2750.32 2784.32 2801.63 2818.32 2835.63 2852.32 2886.32 UP Buy HINDALCO 141.02 148.42 153.13 155.82 160.53 163.22 170.62 UP Buy HINDUNILVR 708.62 723.07 731.08 737.52 745.53 751.97 766.42 UP Buy HDFC 985.63 1010.78 1026.72 1035.93 1051.87 1061.08 1086.23 UP Buy ITC 356.98 361.43 363.47 365.88 367.92 370.33 374.78 Down Sell ICICIBANK 1399.8 1439.6 1464.00 1479.40 1503.80 1519.2 1559 UP Buy IDFC 134.28 137.18 138.97 140.08 141.87 142.98 145.88 UP Buy INDUSINDBK 608.17 617.42 621.78 626.67 631.03 635.92 645.17 Down Sell INFY 3486.03 3574.13 3610.47 3662.23 3698.57 3750.33 3838.43 Down Sell JINDALSTEL 153.98 160.43 163.07 166.88 169.52 173.33 179.78 Down Sell KOTAKBANK 968.18 992.68 1007.97 1017.18 1032.47 1041.68 1066.18 UP Buy LT 1405.47 1441.97 1464.43 1478.47 1500.93 1514.97 1551.47 UP Buy LUPIN 1281.93 1311.23 1324.77 1340.53 1354.07 1369.83 1399.13 Sideway No Action M&M 1308.72 1339.12 1353.13 1369.52 1383.53 1399.92 1430.32 Down Sell MARUTI 2888.48 2941.03 2973.62 2993.58 3026.17 3046.13 3098.68 UP Buy NMDC 153.37 157.37 158.98 161.37 162.98 165.37 169.37 Down Sell NTPC 139.05 141.2 142.05 143.35 144.20 145.5 147.65 Down Sell ONGC 396.23 403.58 407.52 410.93 414.87 418.28 425.63 UP Buy POWERGRID 134.88 136.48 137.27 138.08 138.87 139.68 141.28 Down Sell PNB 855.62 877.62 891.23 899.62 913.23 921.62 943.62 UP Buy RELIANCE 911.93 930.98 942.82 950.03 961.87 969.08 988.13 UP Buy SSLT 250.27 255.52 258.68 260.77 263.93 266.02 271.27 UP Buy SBIN 2323.02 2395.52 2437.53 2468.02 2510.03 2540.52 2613.02 UP Buy SUNPHARMA 772.33 791.68 803.22 811.03 822.57 830.38 849.73 UP Buy TCS 2631.68 2668.48 2687.27 2705.28 2724.07 2742.08 2778.88 UP Buy TATAMOTORS 500.4 509.6 515.1 518.80 524.30 528 537.2 UP Buy TATAPOWER 79.53 81.73 83.12 83.93 85.32 86.13 88.33 UP Buy TATASTEEL 440.12 452.42 459.98 464.72 472.28 477.02 489.32 UP Buy TECHM 2121.12 2238.42 2287.43 2355.72 2404.73 2473.02 2590.32 Down Sell ULTRACEMCO 2492.88 2531.73 2551.27 2570.58 2590.12 2609.43 2648.28 UP Buy WIPRO 552.92 571.82 579.53 590.72 598.43 609.62 628.52 Down Sell ZEEL 288.58 304.43 314.67 320.28 330.52 336.13 351.98 UP Buy
- 6. 10th Oct’14 Equity Bazaar Amit Pawar (Research Associate) amit.pawar@choiceindia.com Rohan Shinde (Research Associate) rohan.shinde@choiceindia.com Deveya Gaglani (Research Advisor) deveya.gaglani@chocieindia.com For Private Circulation Only Website: www.choiceindia.com https://twitter.com/ChoiceBroking https://www.youtube.com/user/ChoiceBroking http://www.slideshare.net/choiceindiabroking https://plus.google.com/115293033595831069270/posts https://www.facebook.com/pages/Choice-Equity-Broking-Pvt-Ltd/352491718249644 https://www.linkedin.com/company/choice-international-limited?trk=parent_company_logo
- 7. 10th Oct’14 Equity Bazaar Disclaimer This is solely for information of clients of Choice India and does not construe to be an investment advice. It is also not intended as an offer or solicitation for the purchase and sale of any financial instruments. Any action taken by you on the basis of the information contained herein is your responsibility alone and Choice India its subsidiaries or its employees or associates will not be liable in any manner for the consequences of such action taken by you. We have exercised due diligence in checking the correctness and authenticity of the information contained in this recommendation, but Choice India or any of its subsidiaries or associates or employees shall not be in any way responsible for any loss or damage that may arise to any person from any inadvertent error in the information contained in this recommendation or any action taken on basis of this information. Technical analysis studies market psychology, price patterns and volume levels. It is used to forecast future price and market movements. Technical analysis is complementary to fundamental analysis and news sources. The recommendations issued herewith might be contrary to recommendations issued by Choice India in the company research undertaken as the recommendations stated in this report is derived purely from technical analysis. Choice India has based this document on information obtained from sources it believes to be reliable but which it has not independently verified; Choice India makes no guarantee, representation or warranty and accepts no responsibility or liability as to its accuracy or completeness. The opinions contained within the report are based upon publicly available information at the time of publication and are subject to change without notice. The information and any disclosures provided herein are in summary form and have been prepared for informational purposes. The recommendations and suggested price levels are intended purely for trading purposes. The recommendations are valid for the day of the report however trading trends and volumes might vary substantially on an intraday basis and the recommendations may be subject to change. The information and any disclosures provided herein may be considered confidential. Any use, distribution, modification, copying, forwarding or disclosure by any person is strictly prohibited. The information and any disclosures provided herein do not constitute a solicitation or offer to purchase or sell any security or other financial product or instrument. The current performance may be unaudited. Past performance does not guarantee future returns. There can be no assurance that investments will achieve any targeted rates of return, and there is no guarantee against the loss of your entire investment. POTENTIAL CONFLICT OF INTEREST DISCLOSURE (as on date of report) Disclosure of interest statement – • Analyst interest of the stock /Instrument(s): - No. • Firm interest of the stock / Instrument (s): - No.