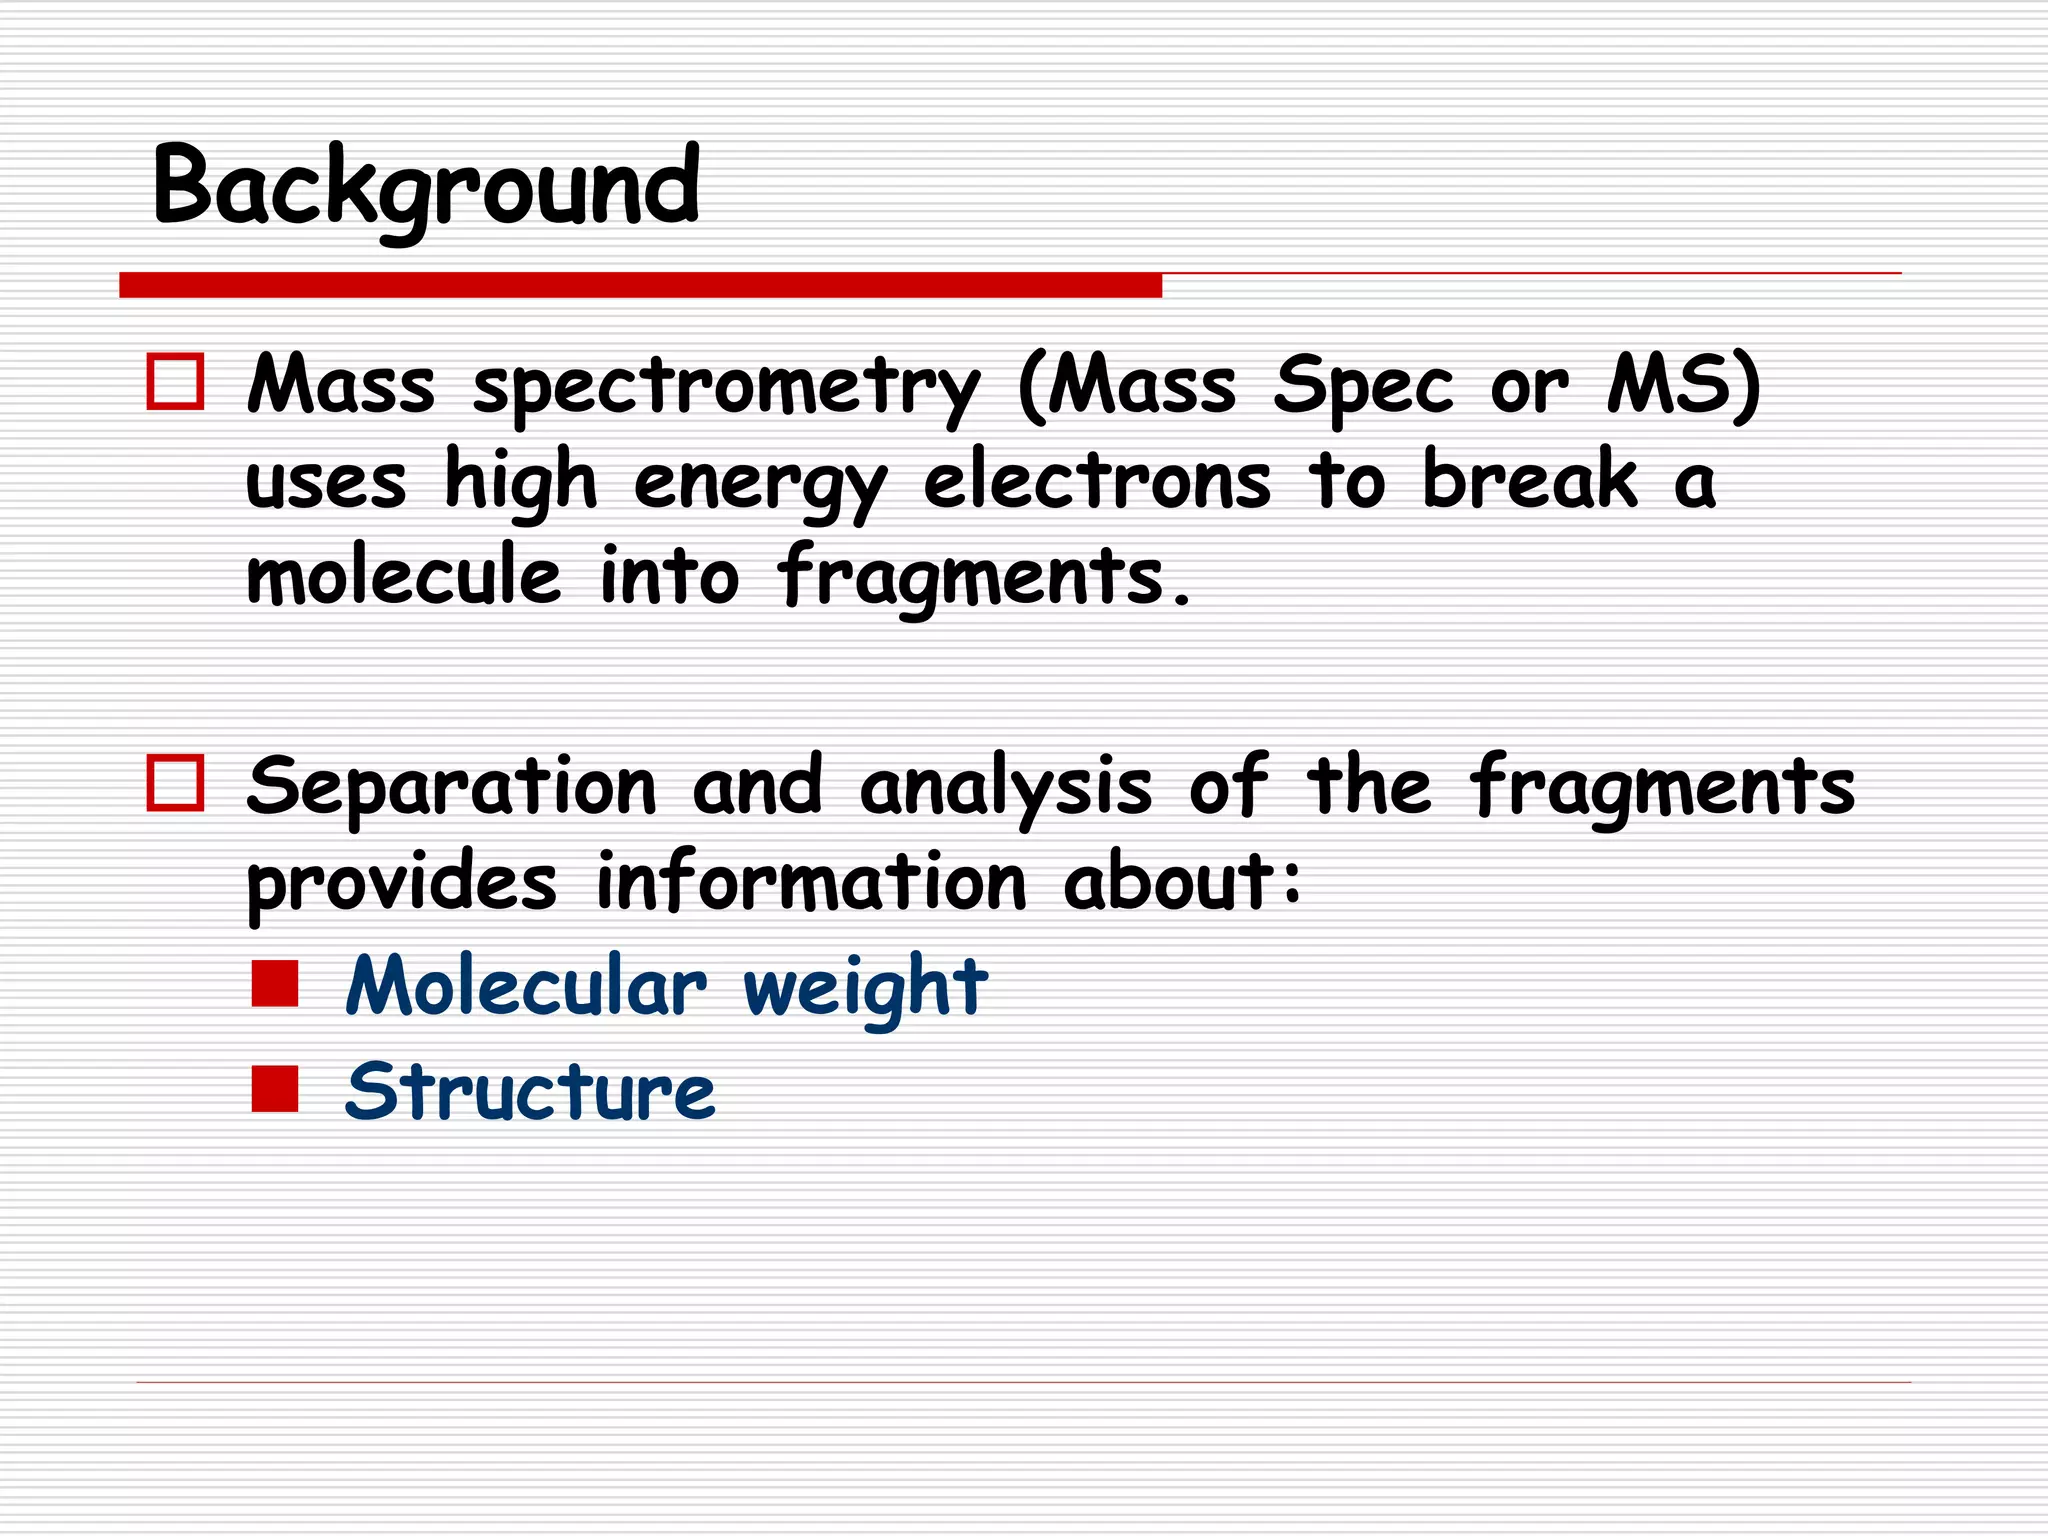
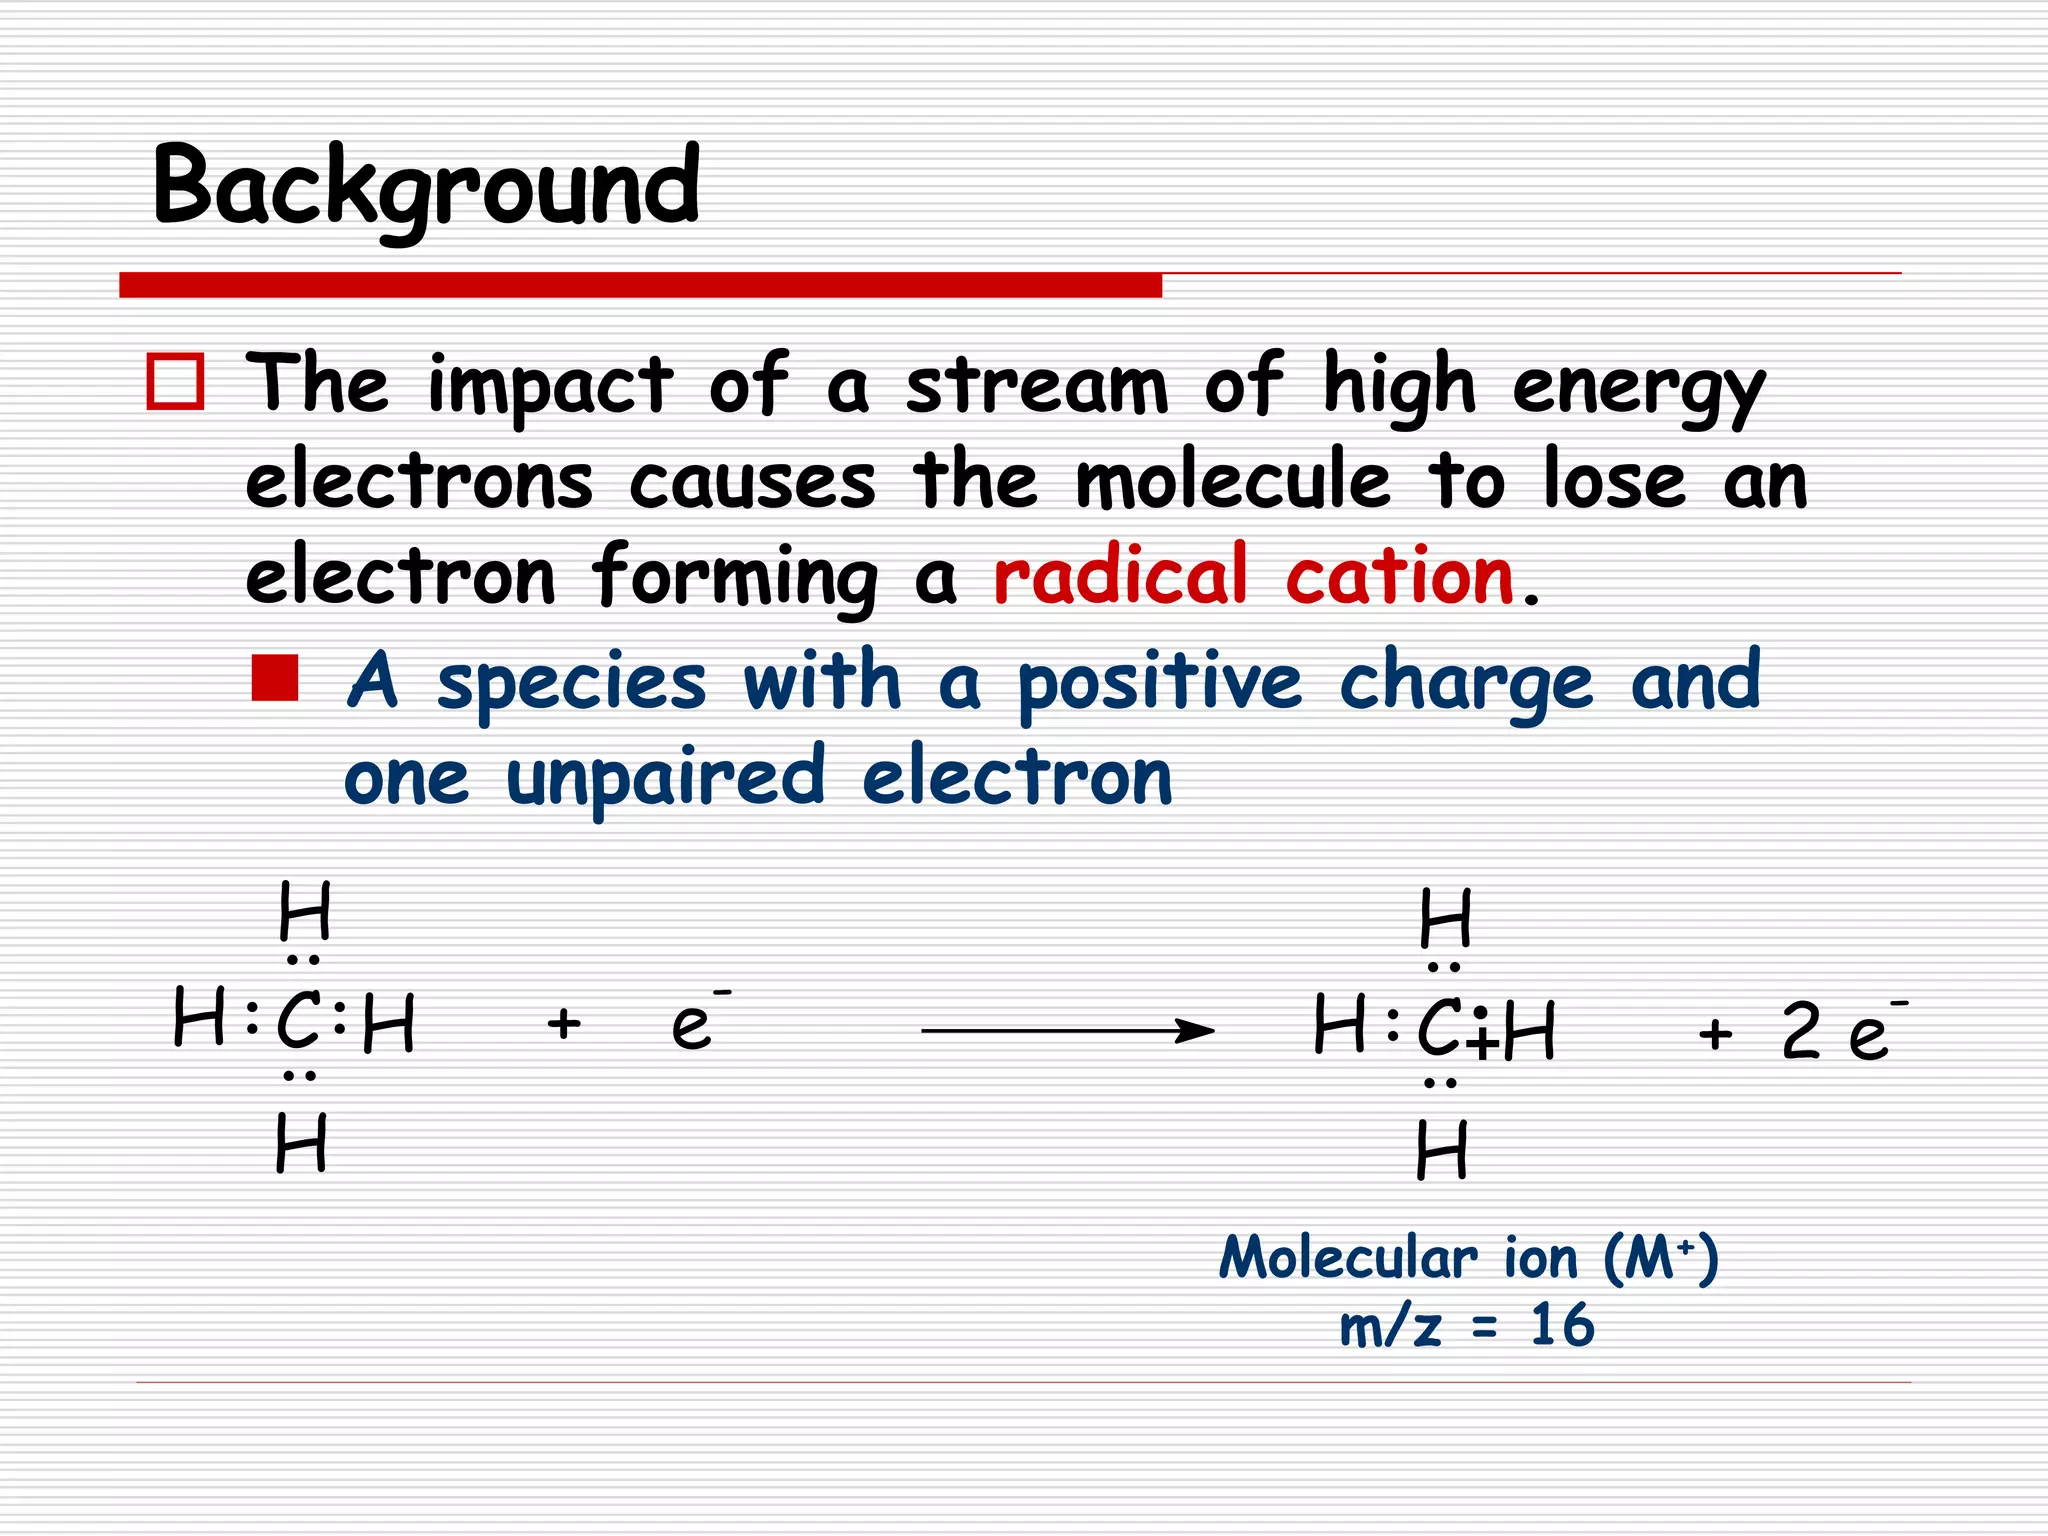
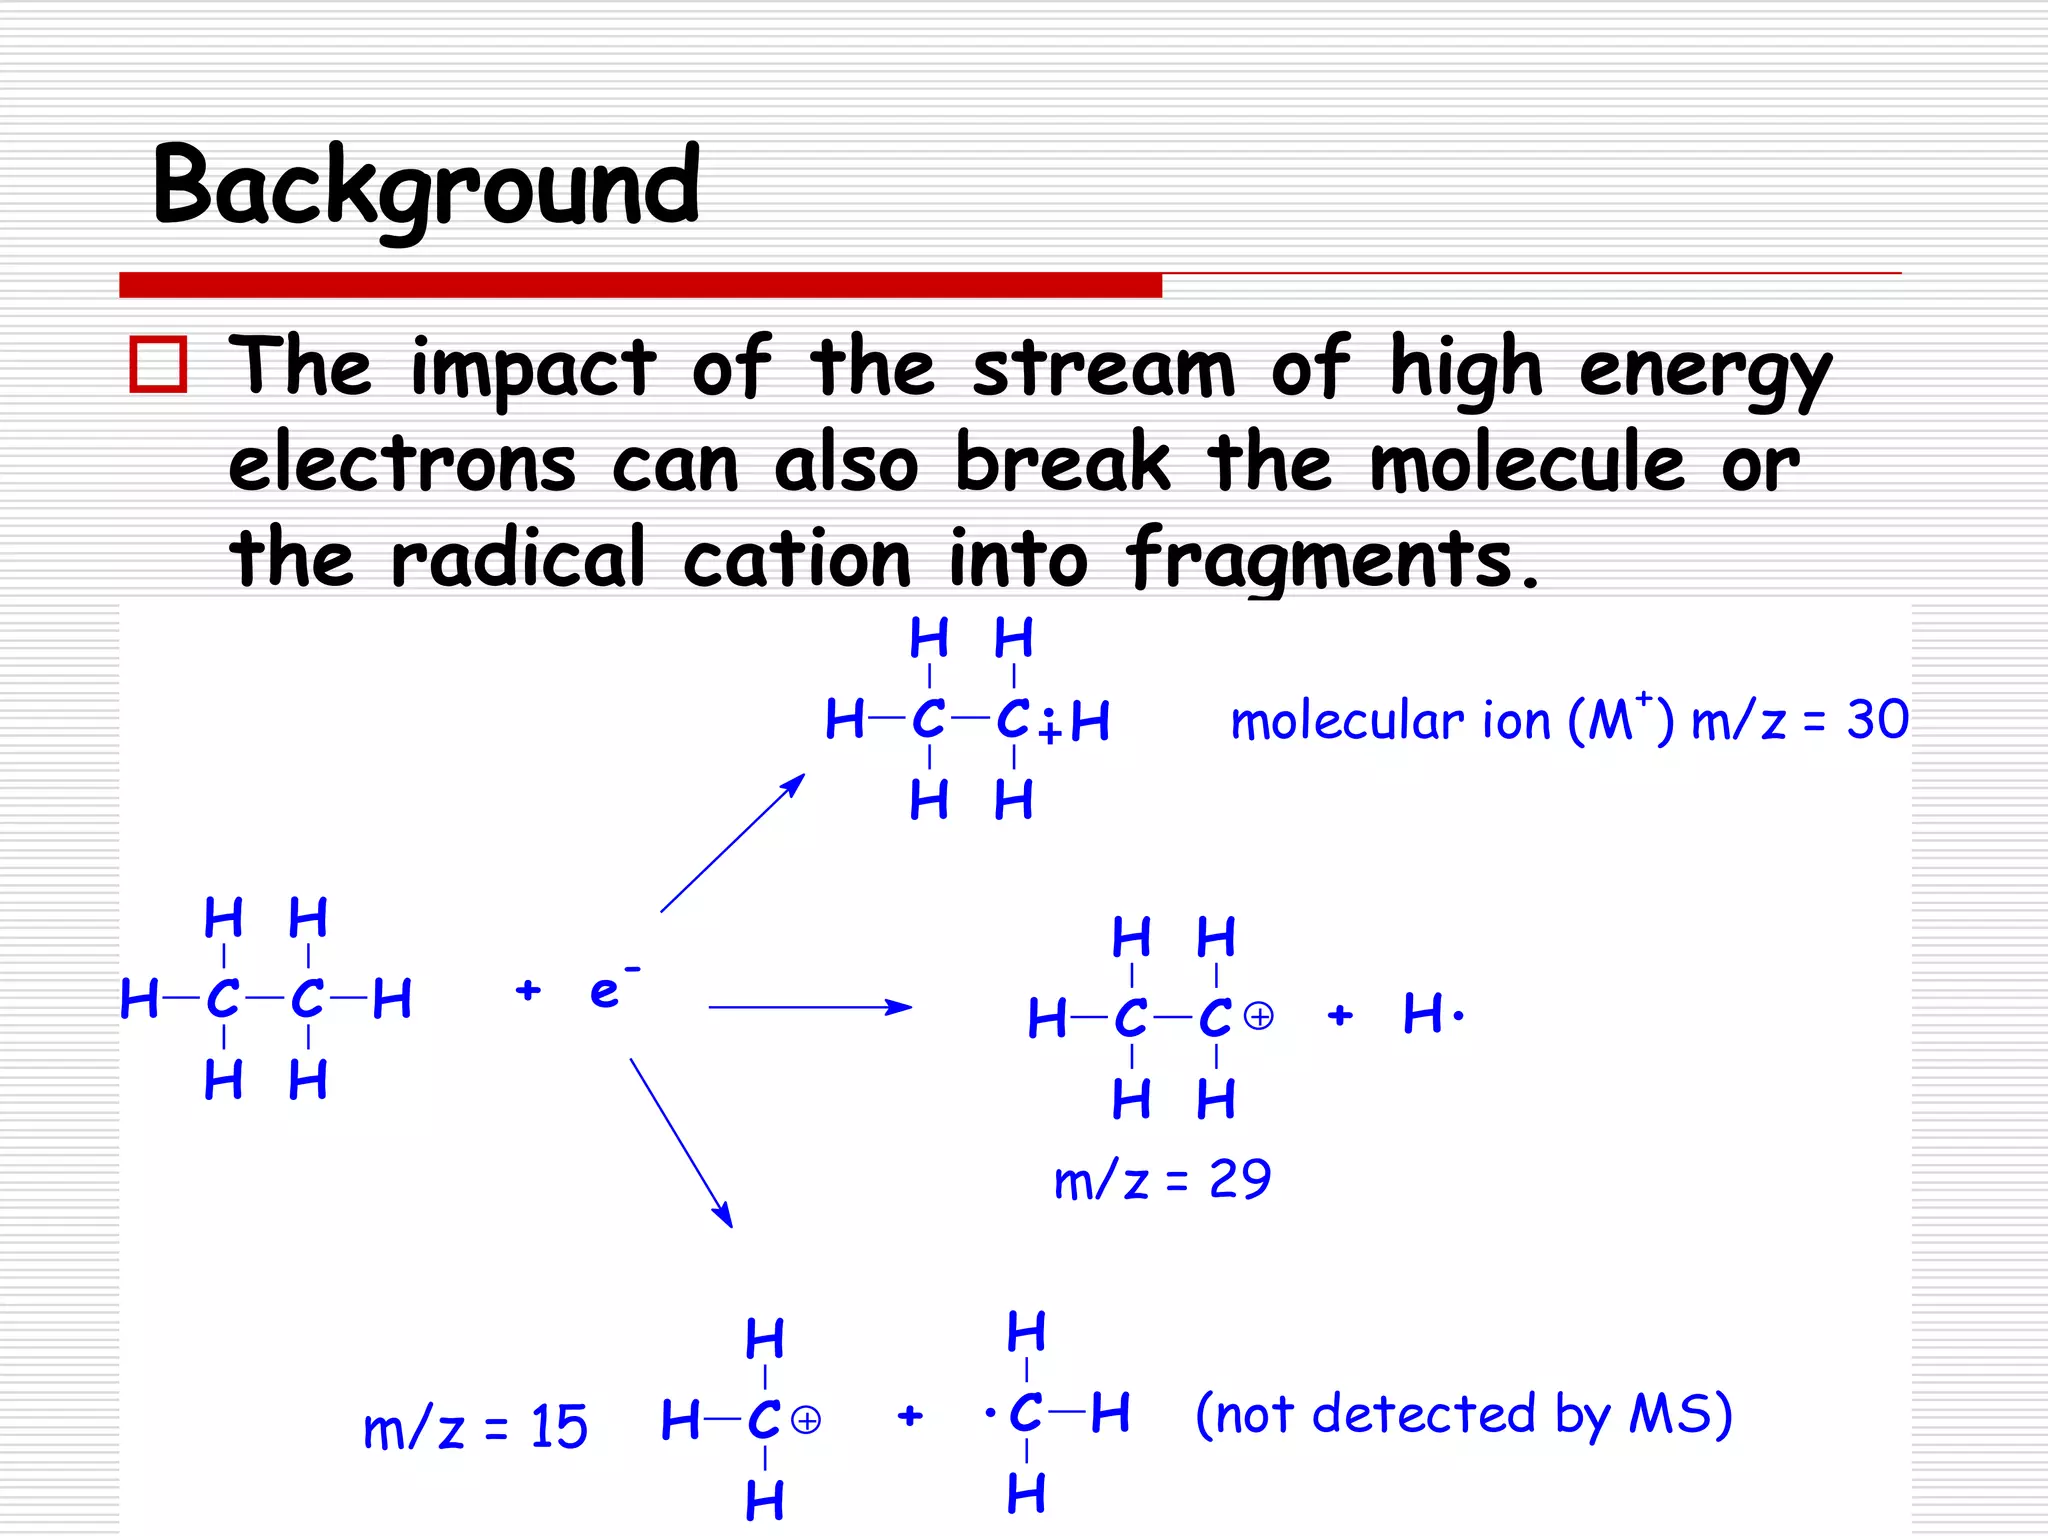
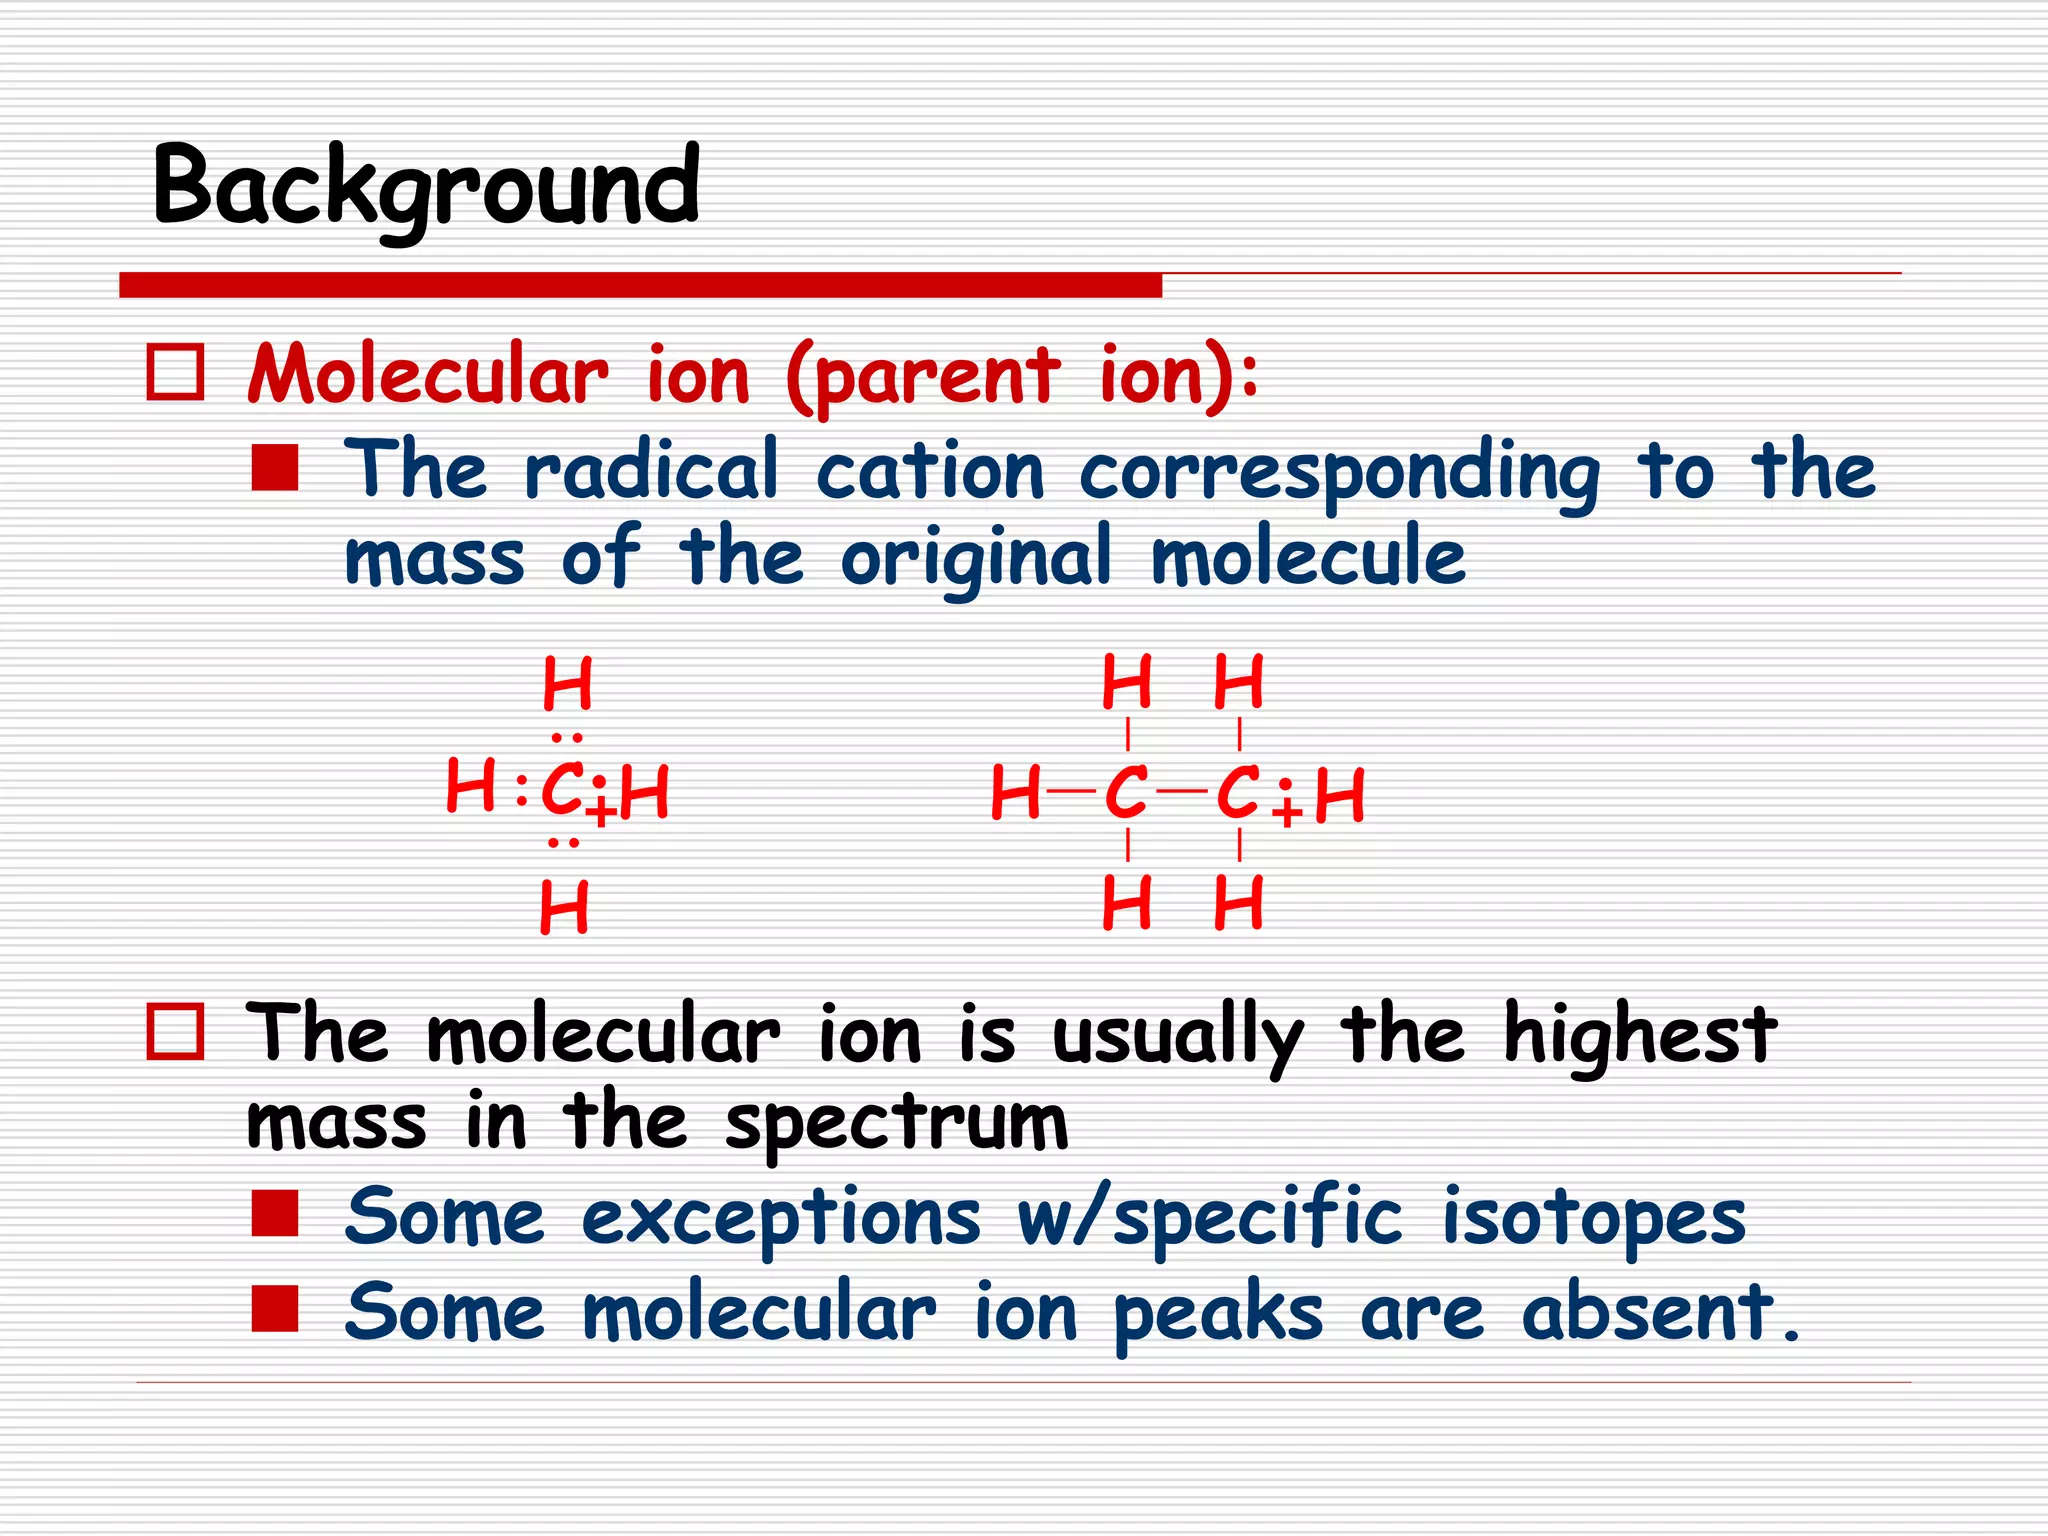
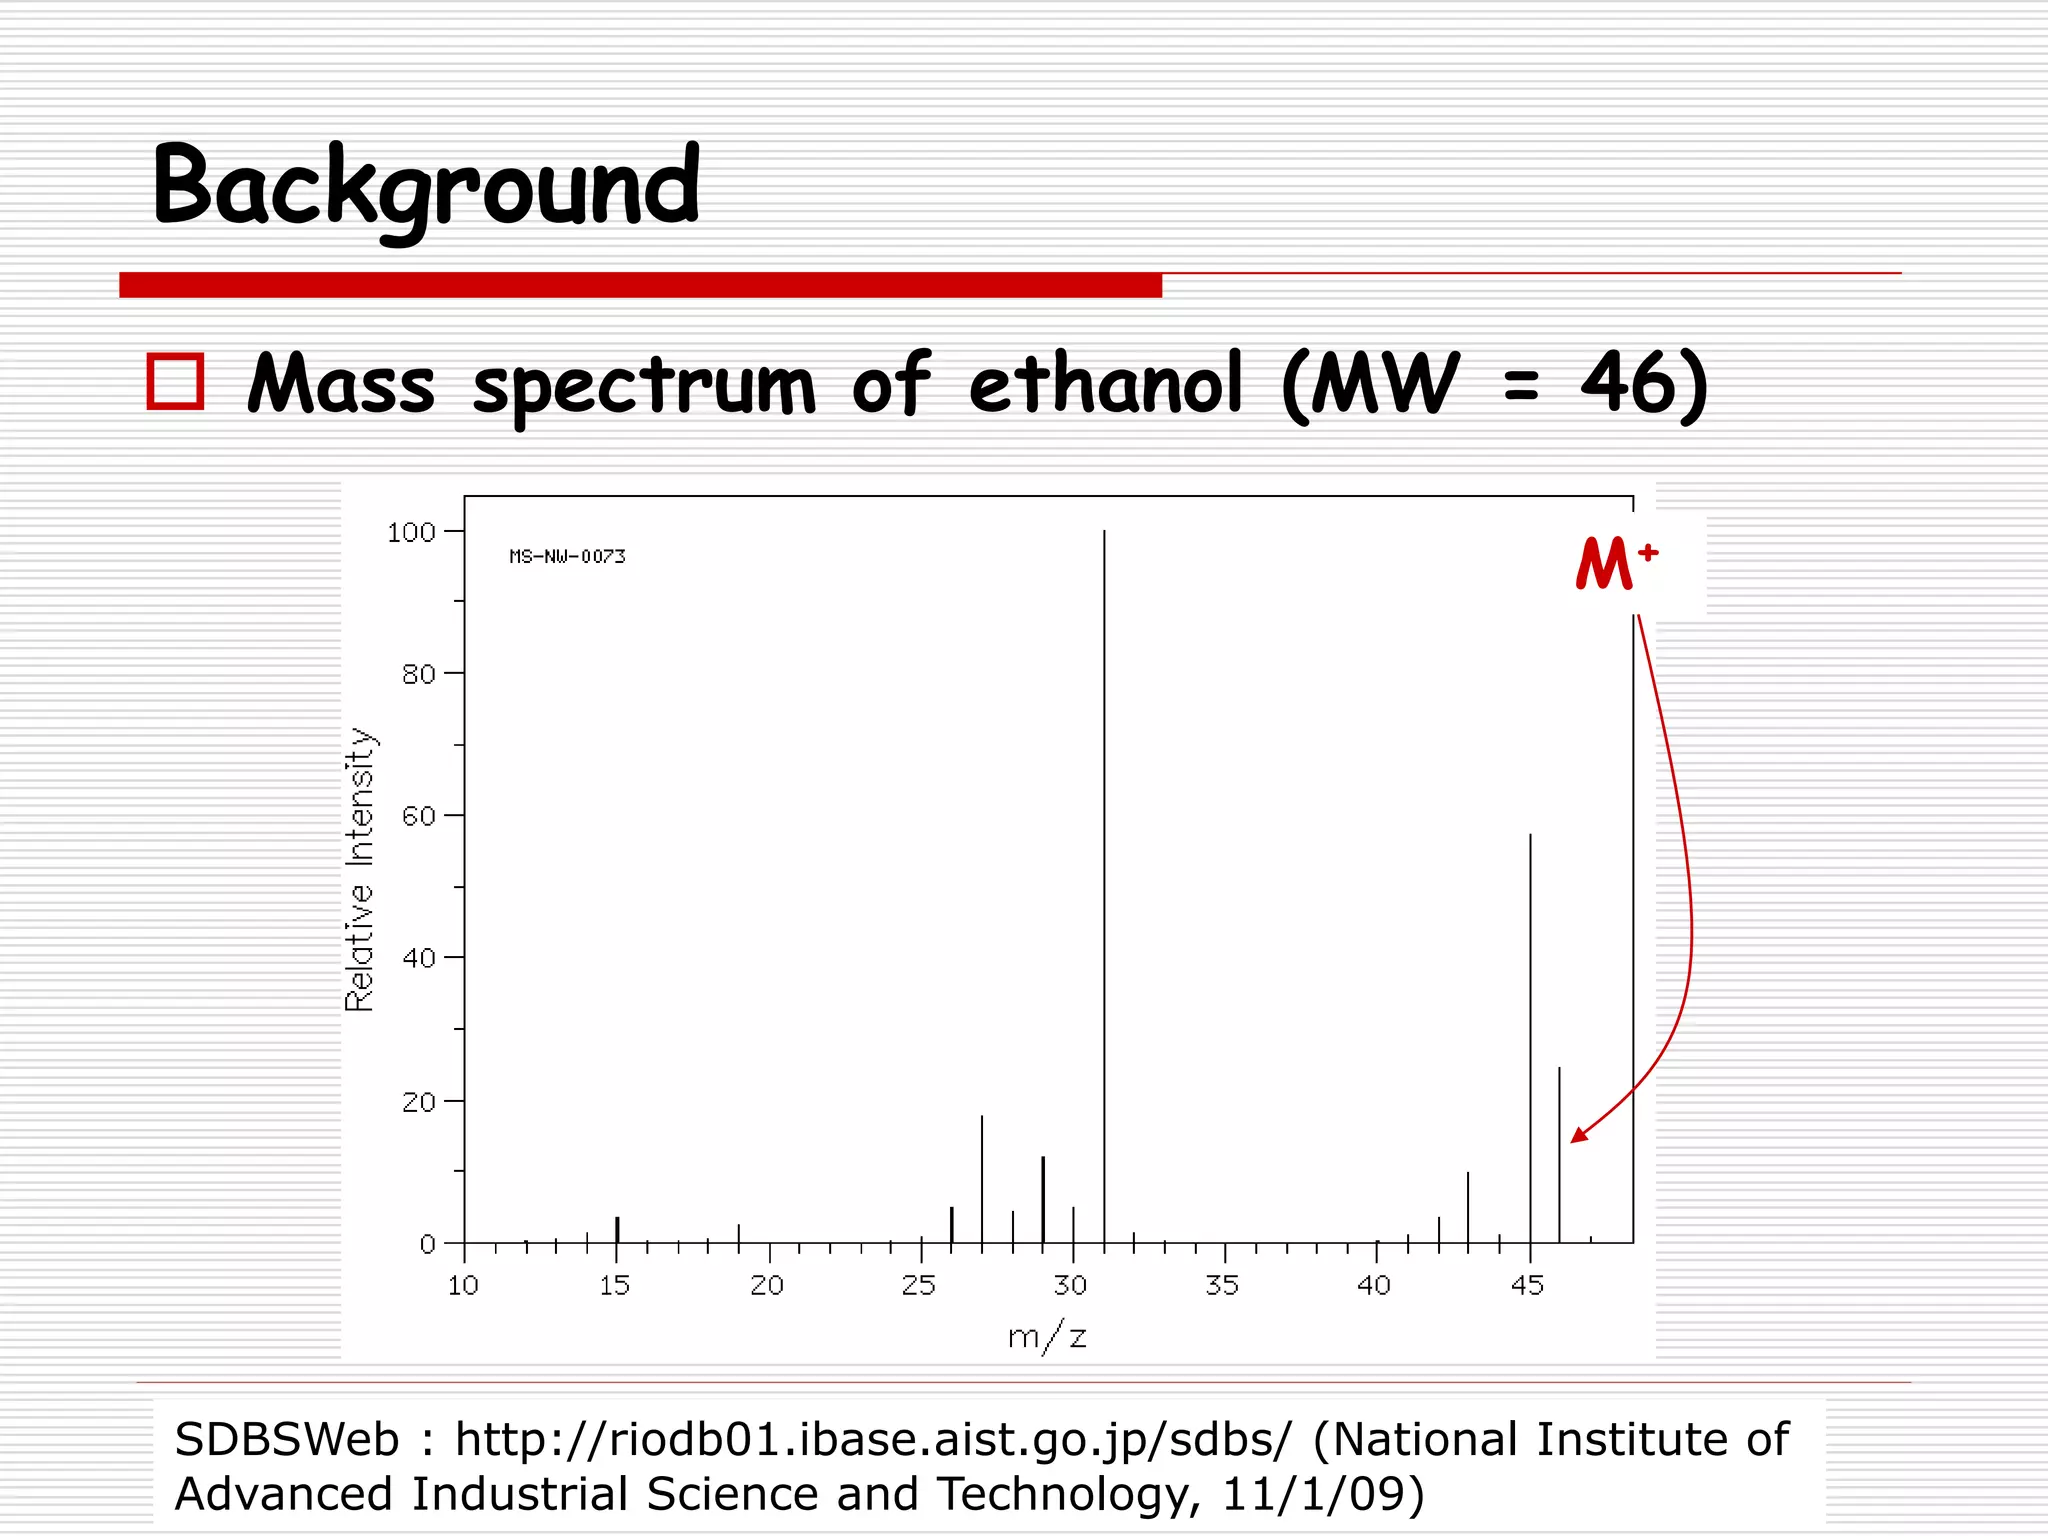
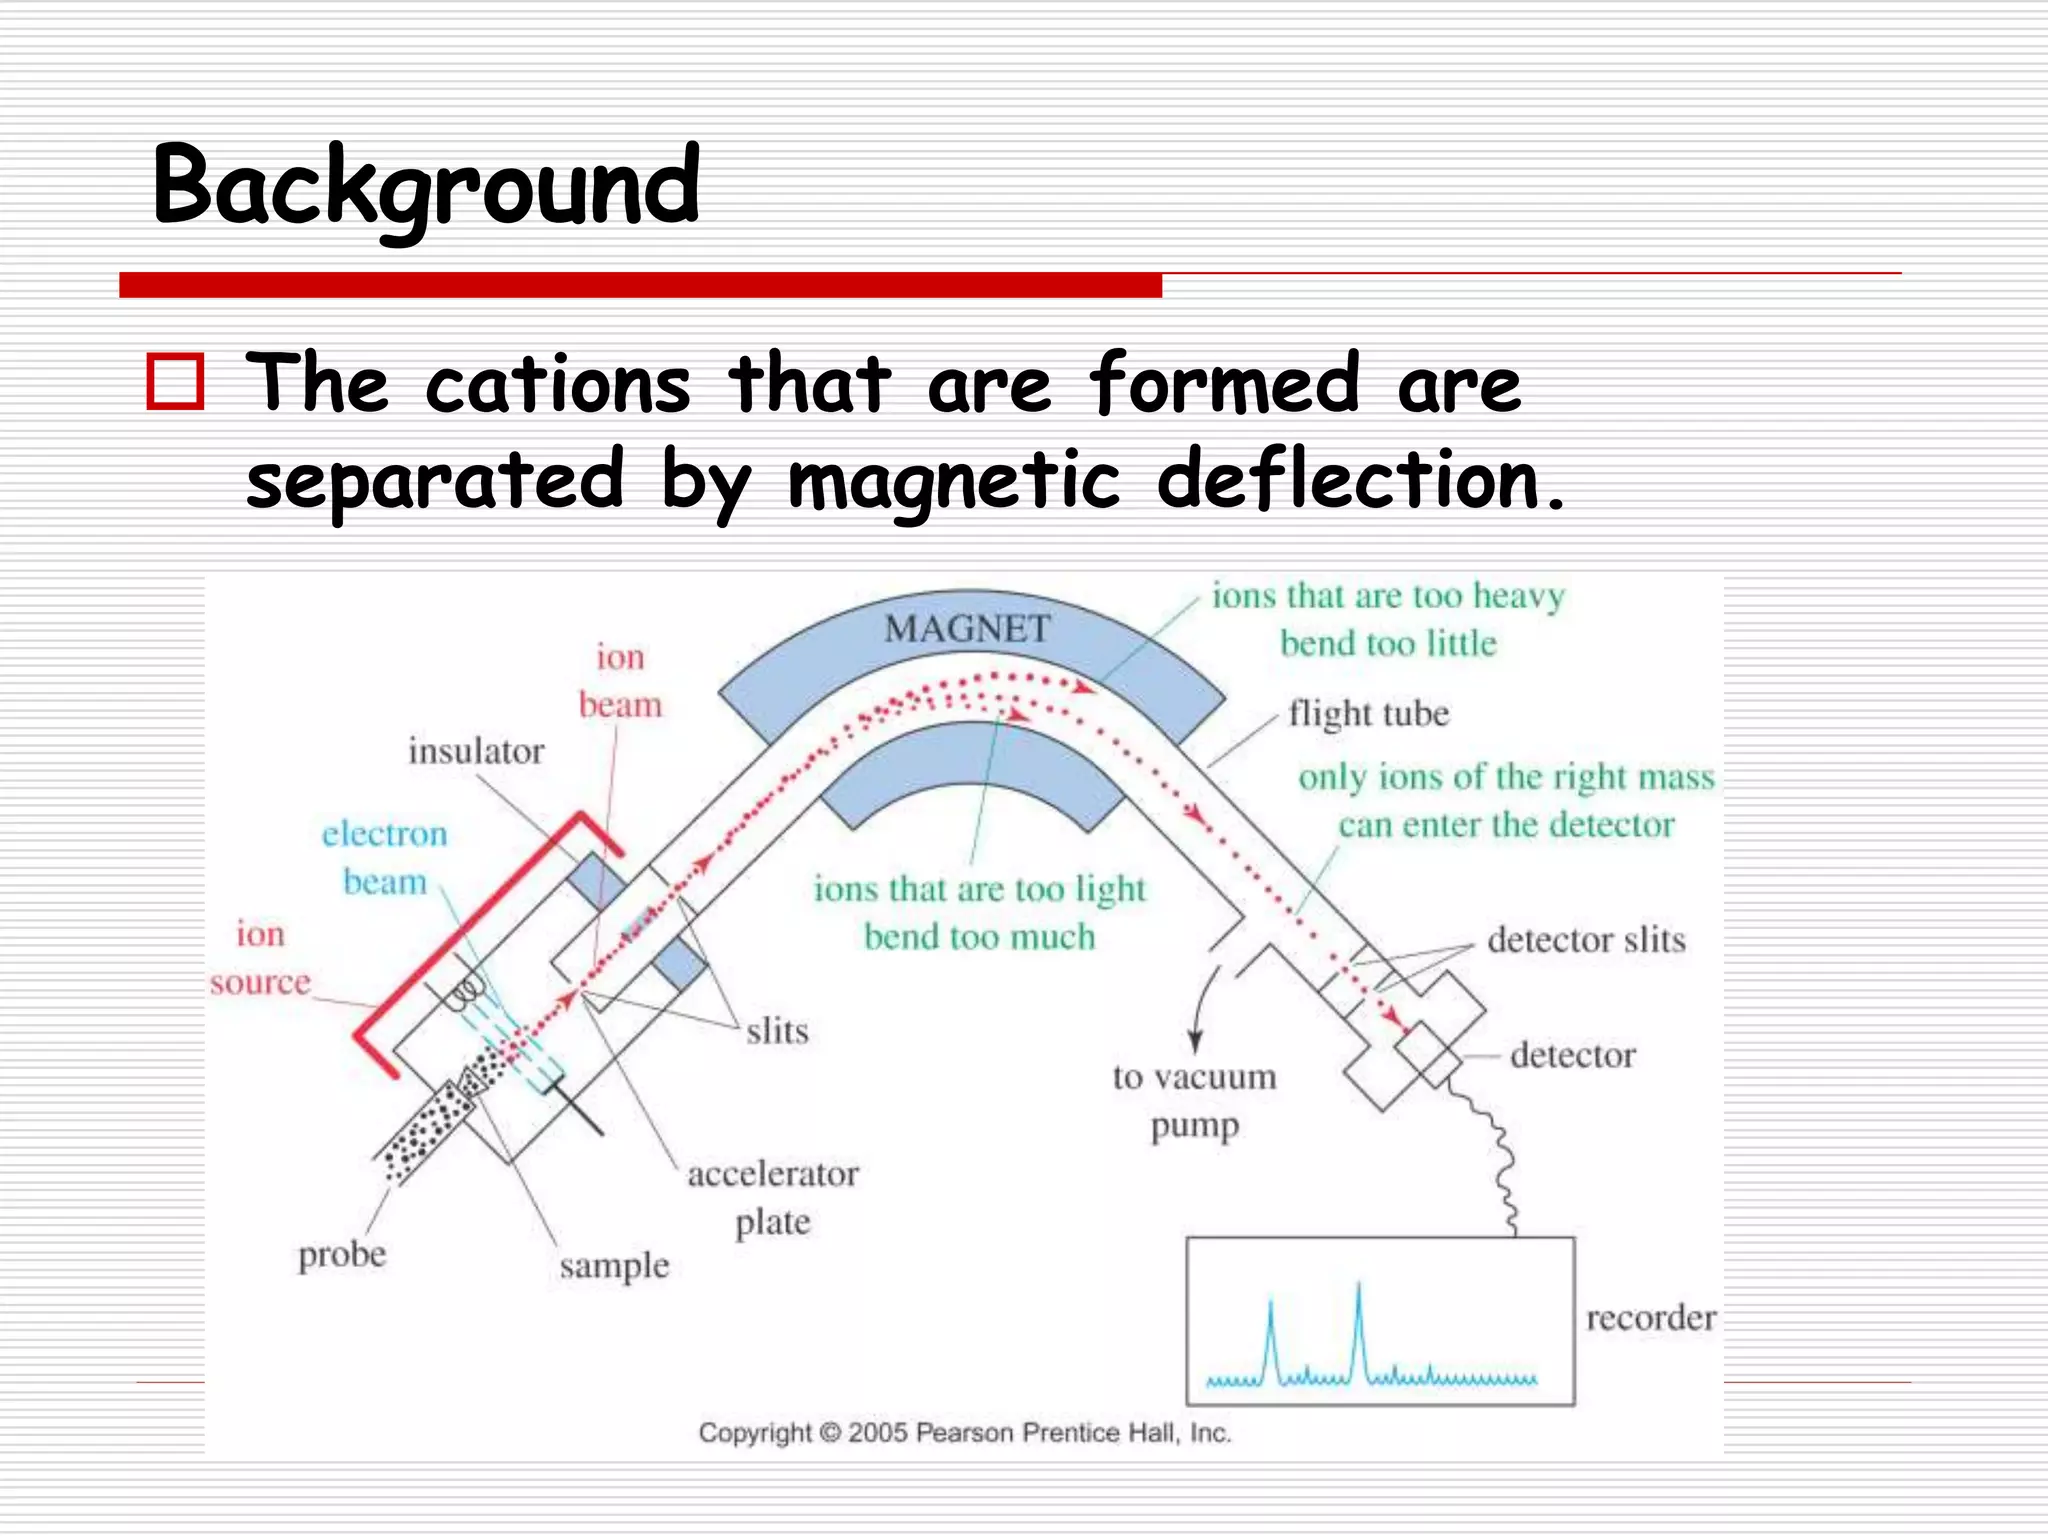
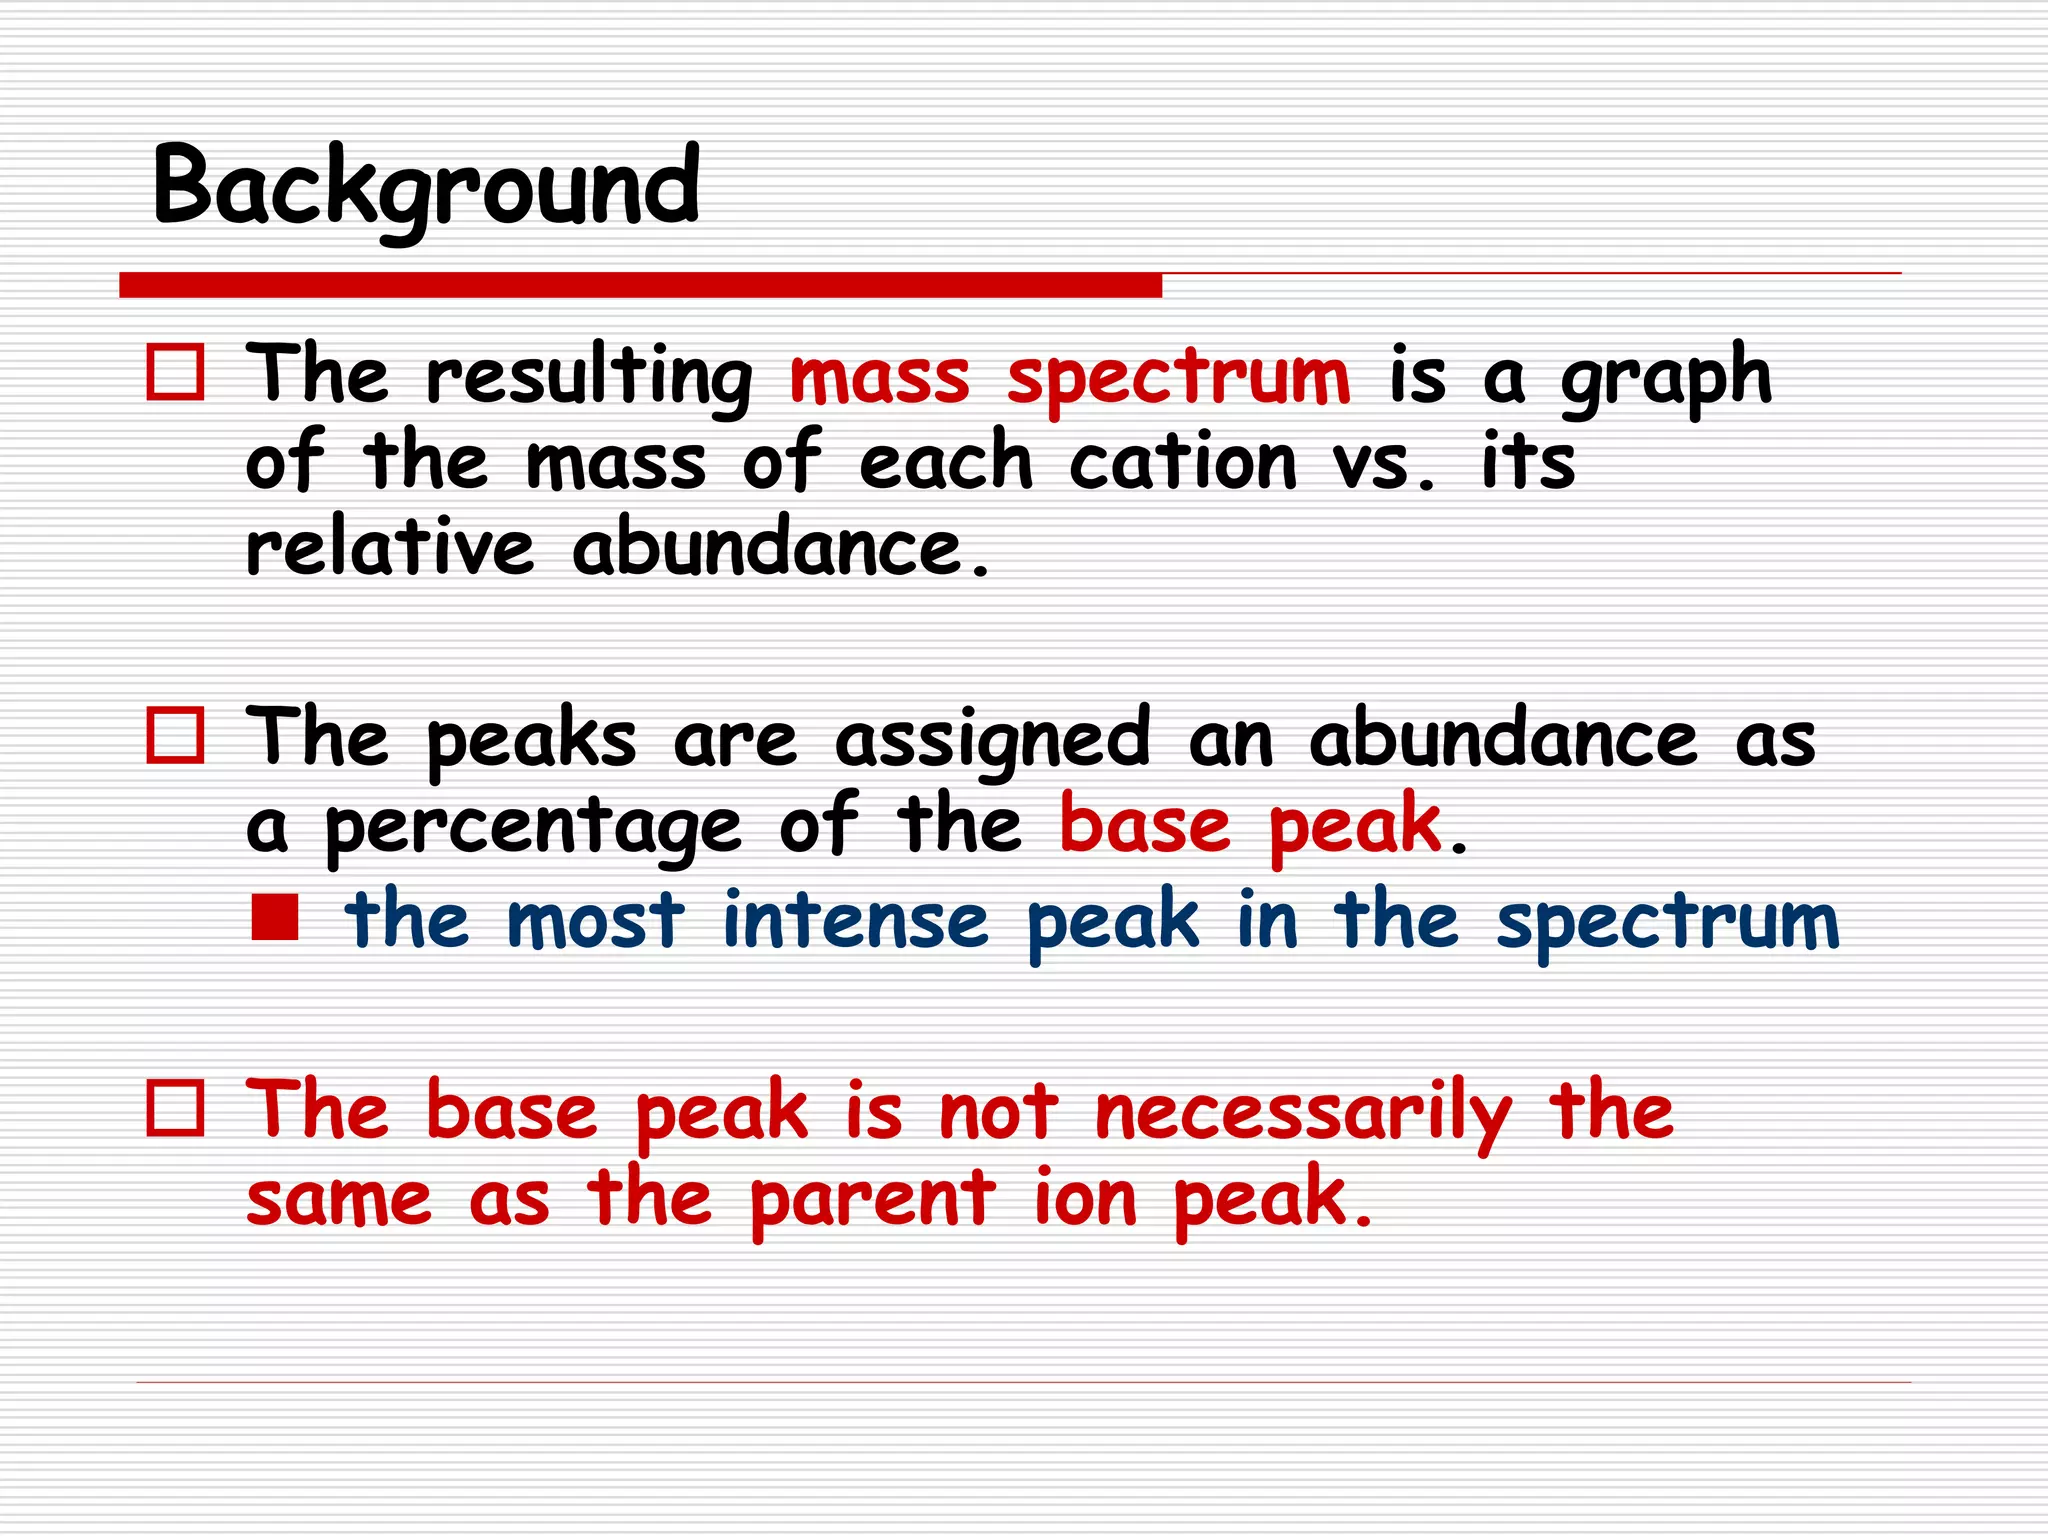
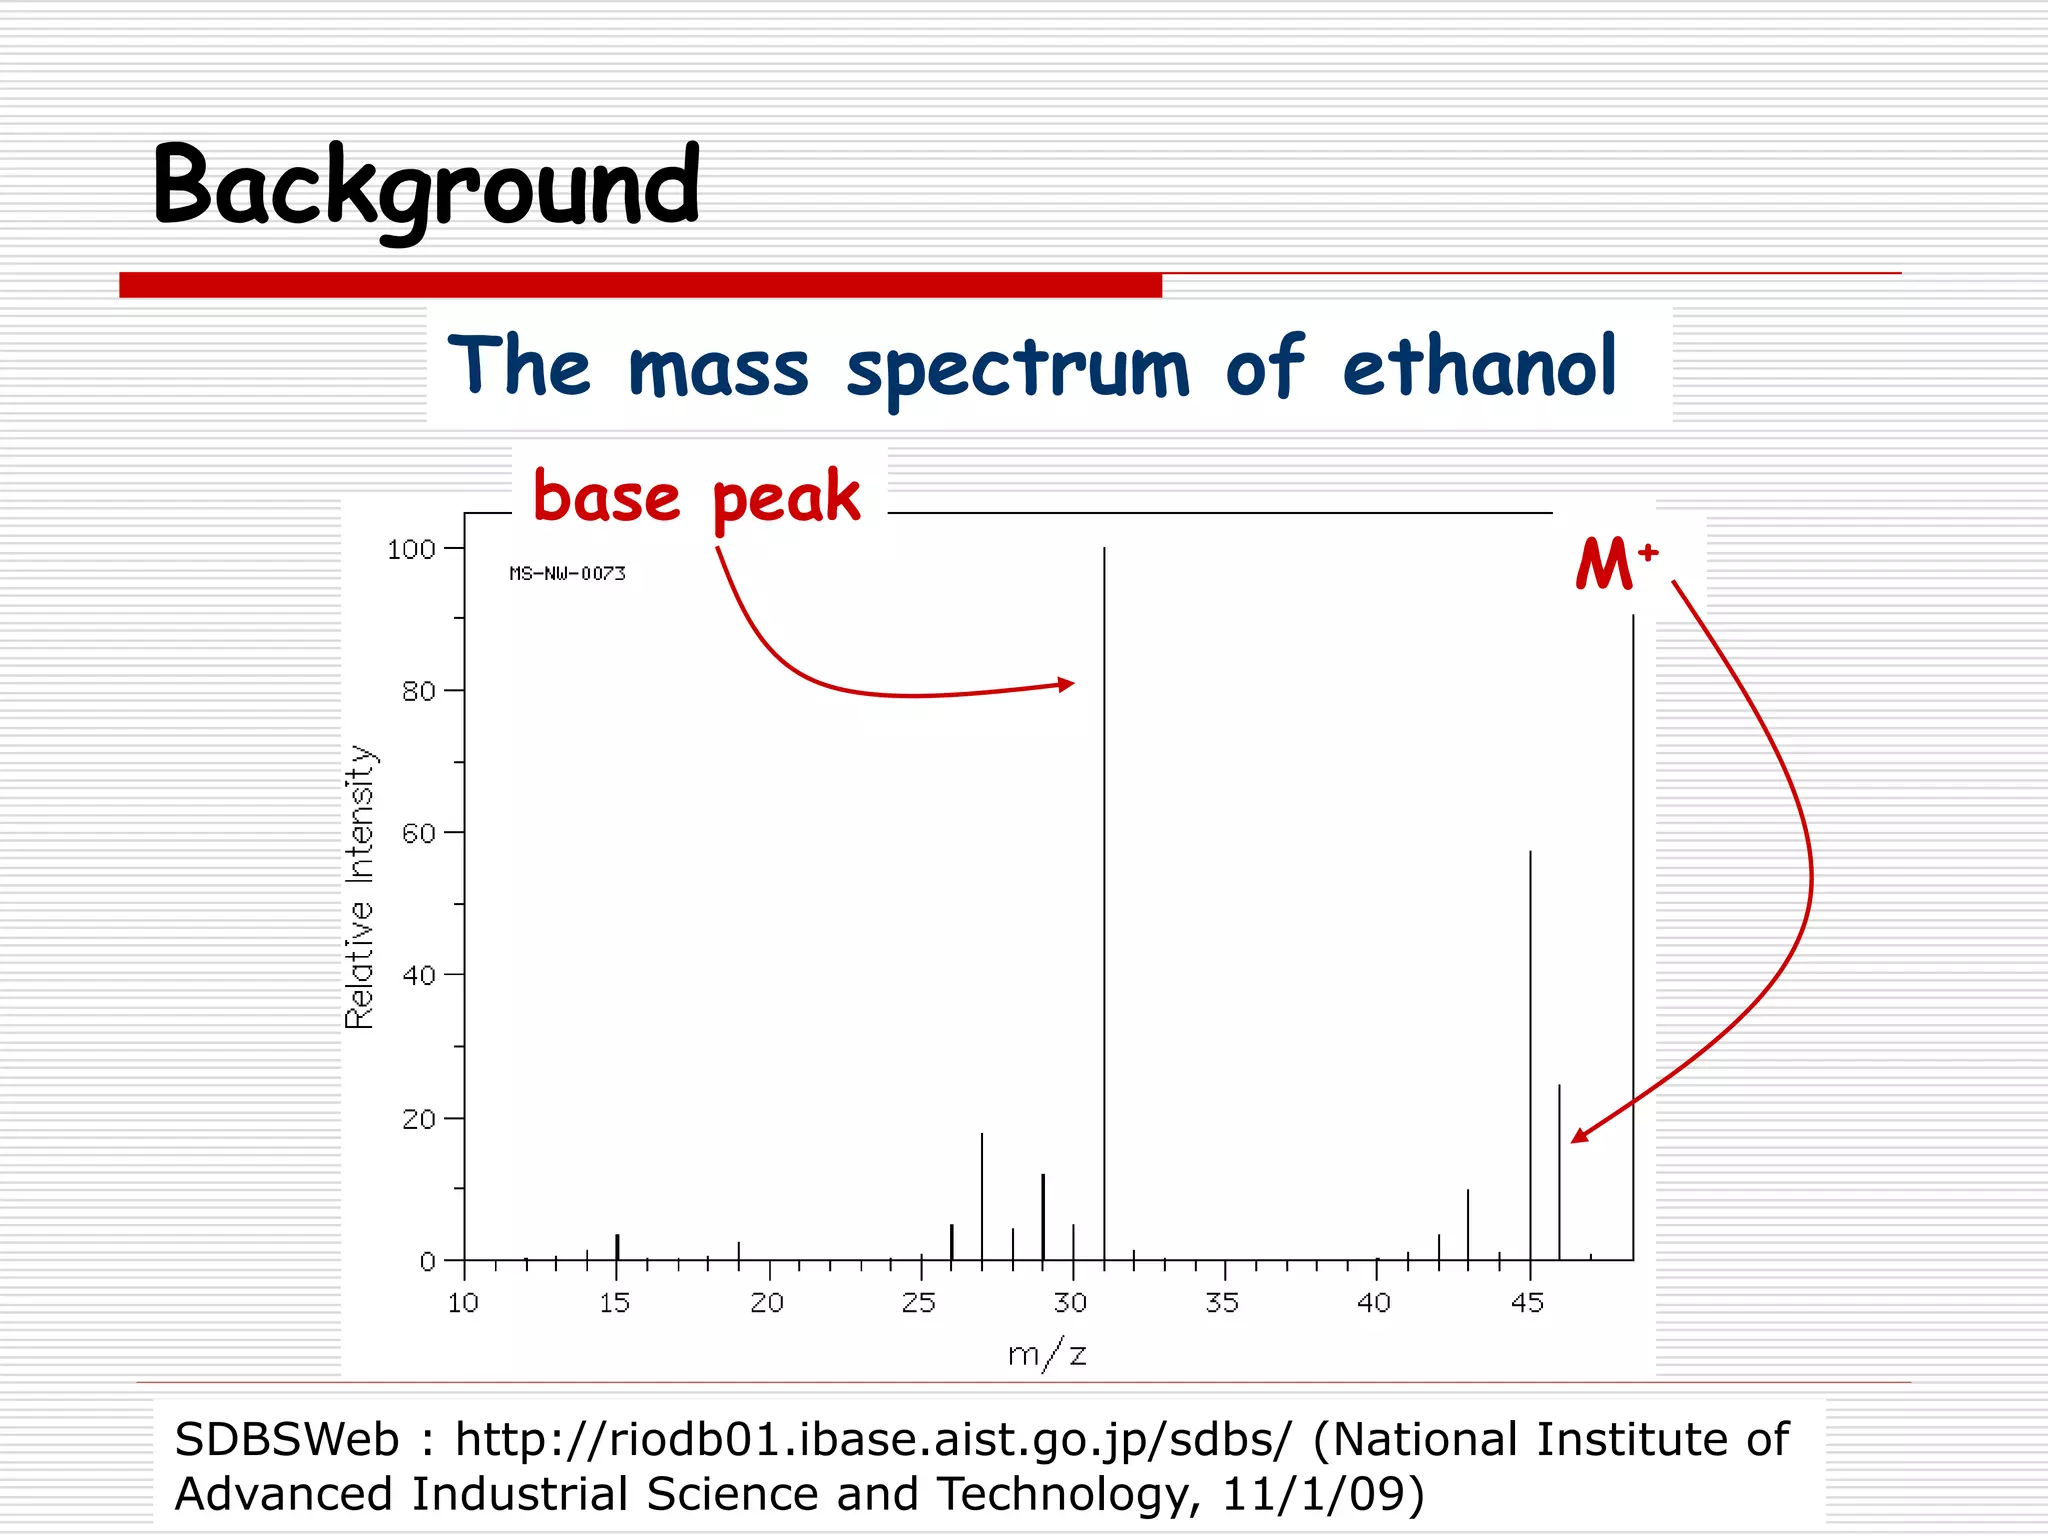
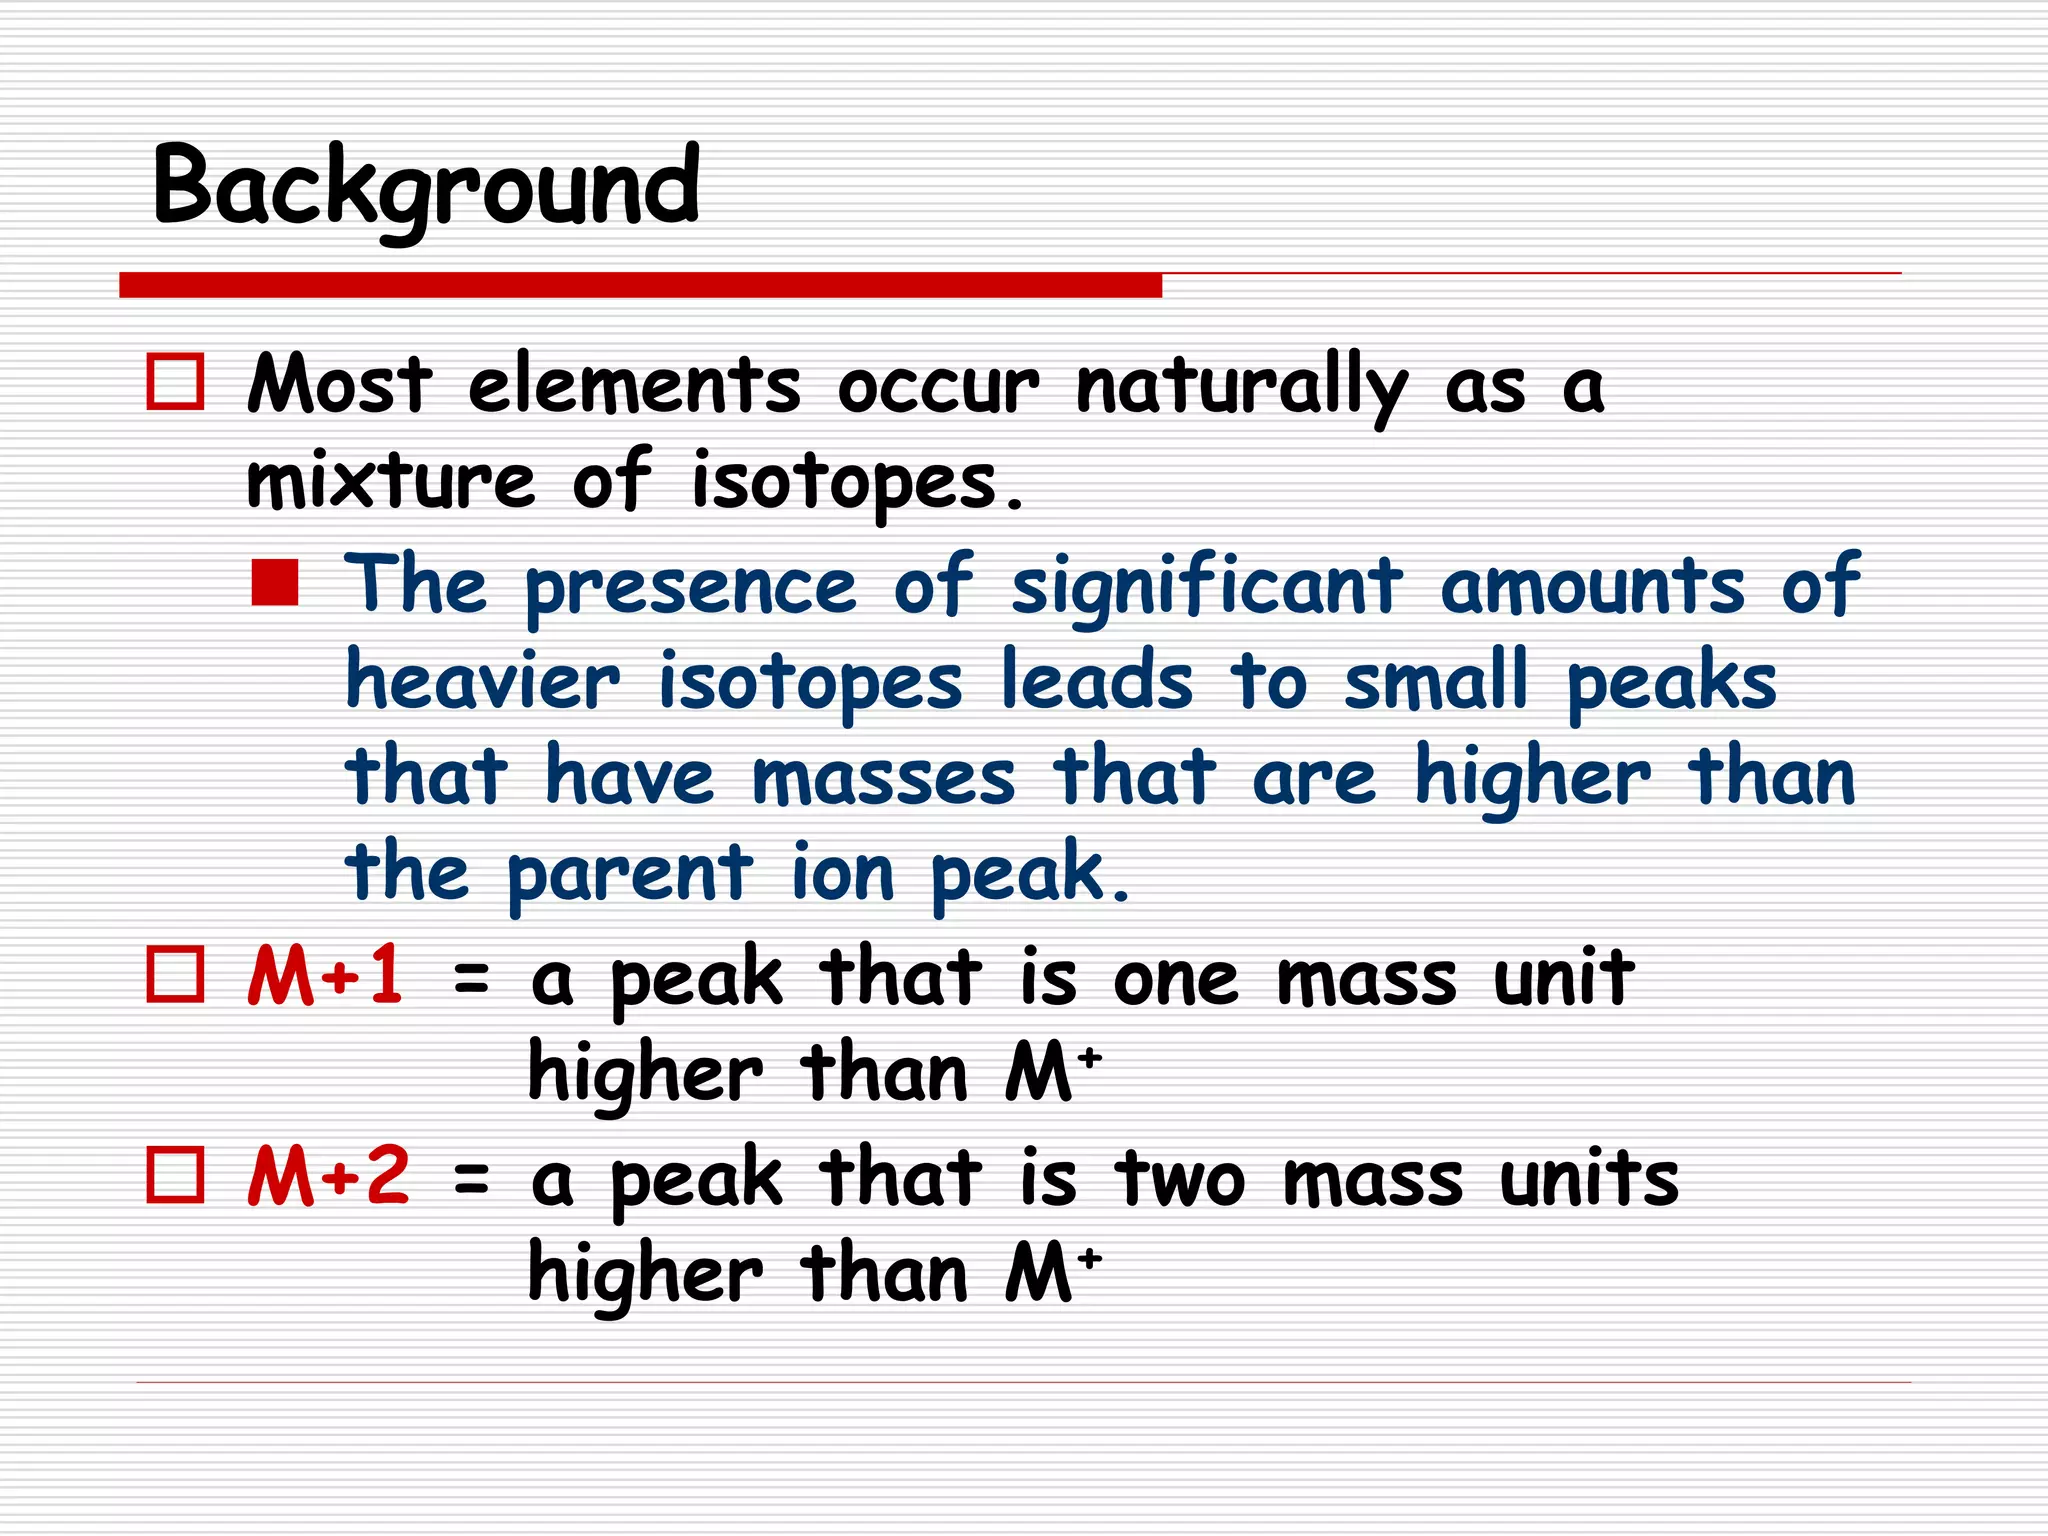
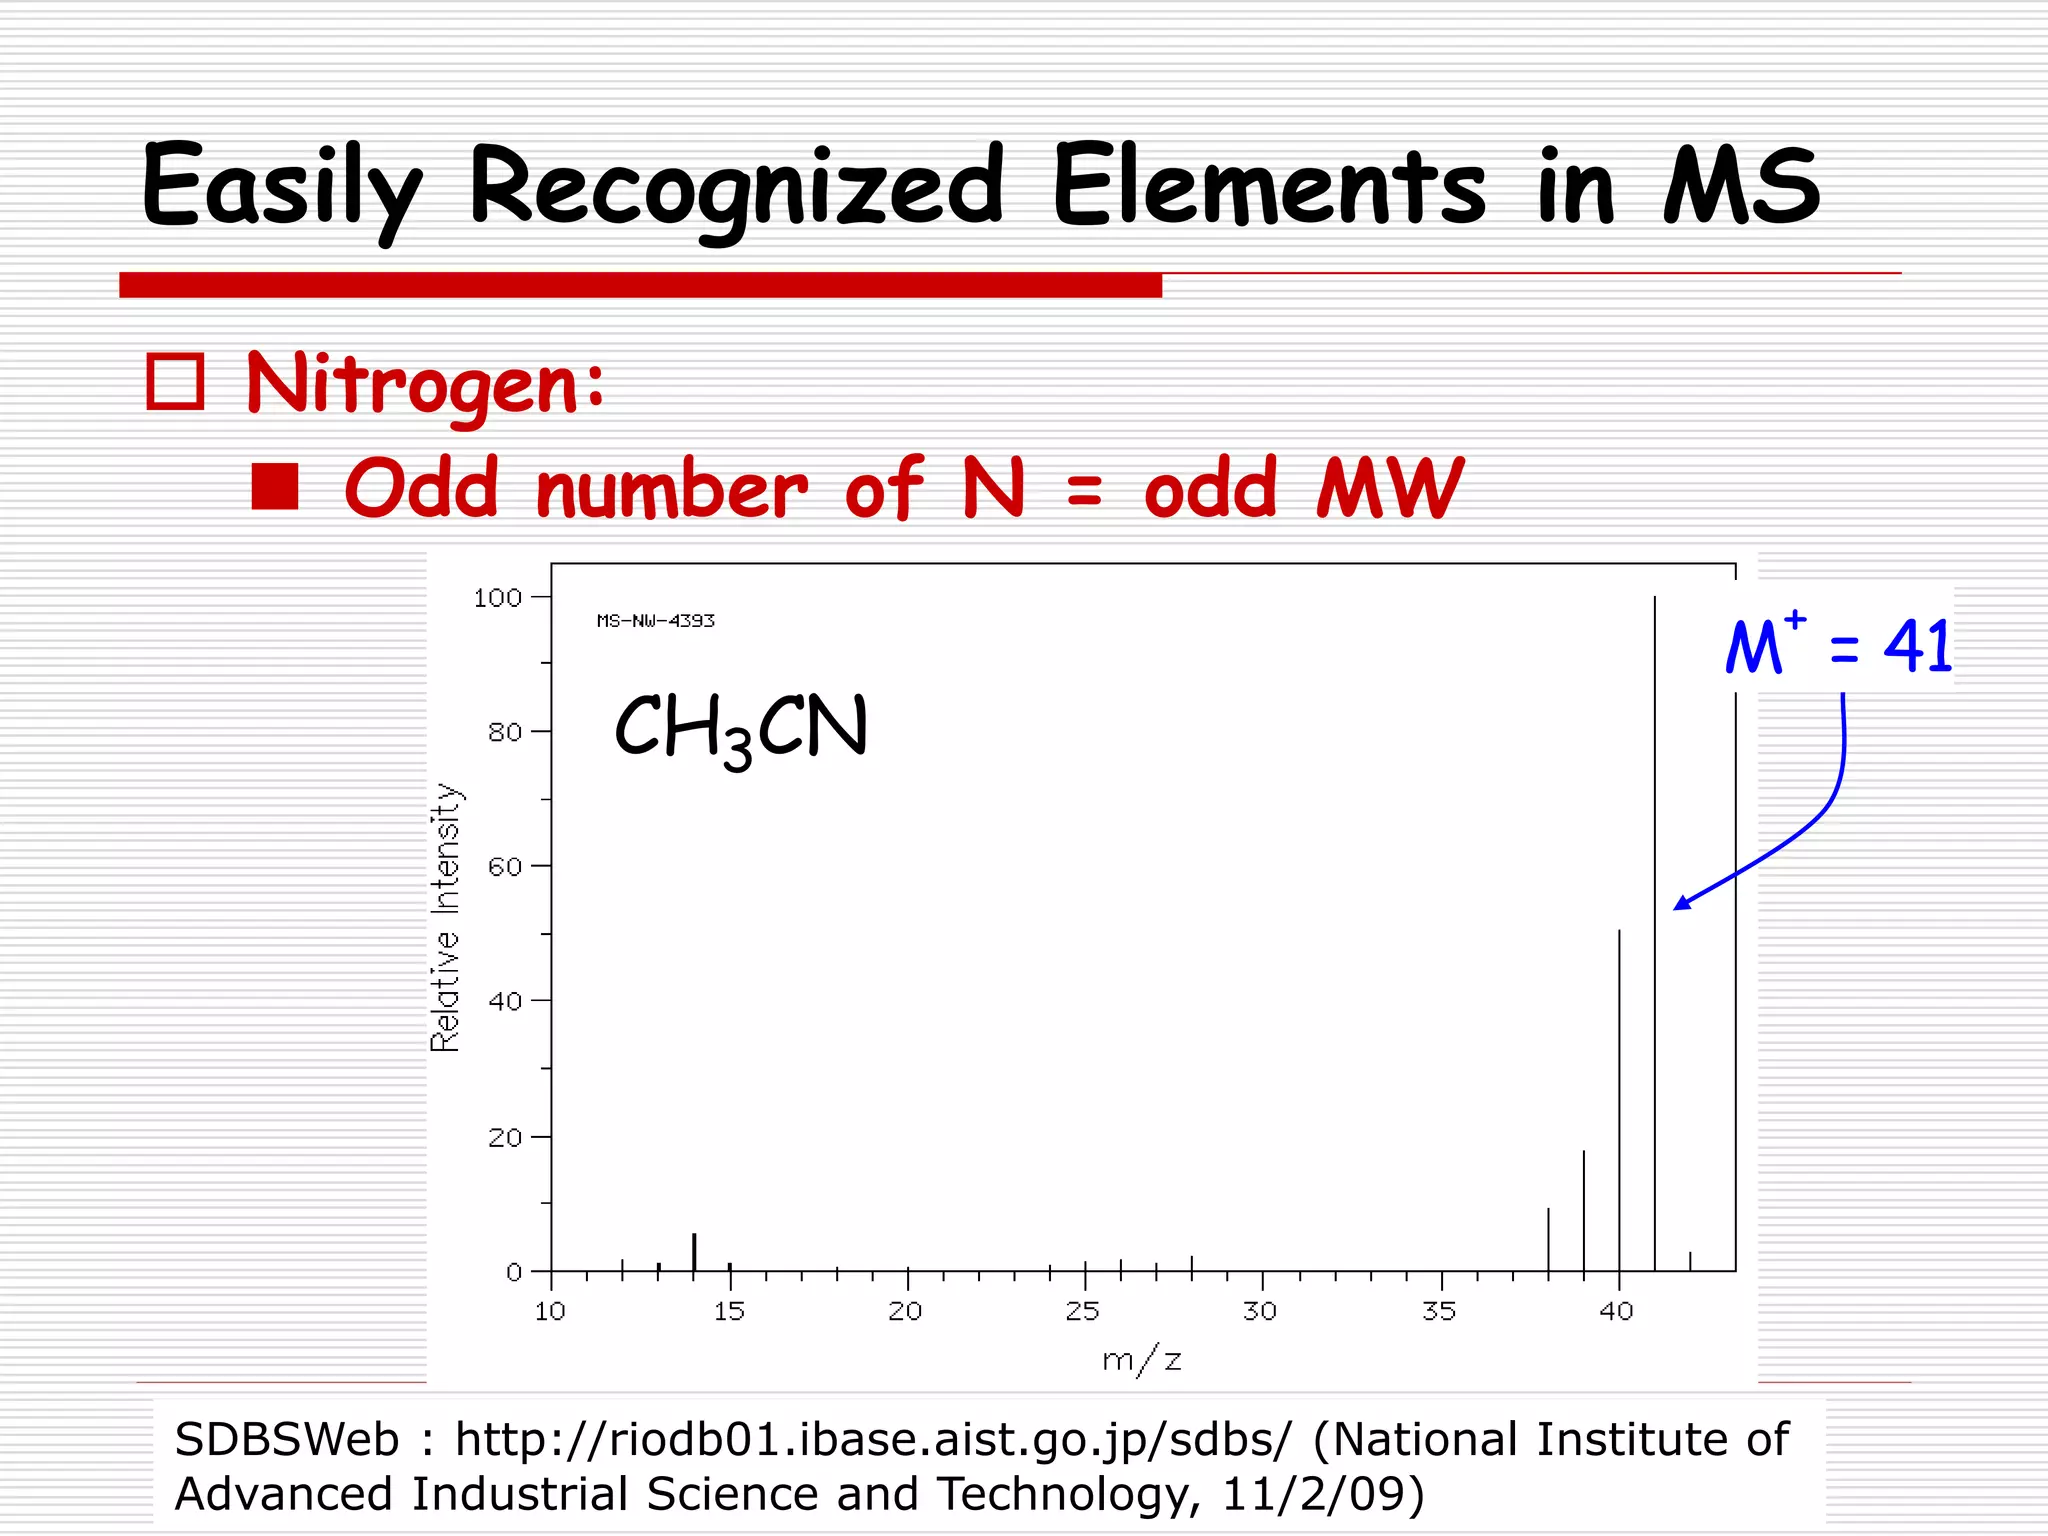
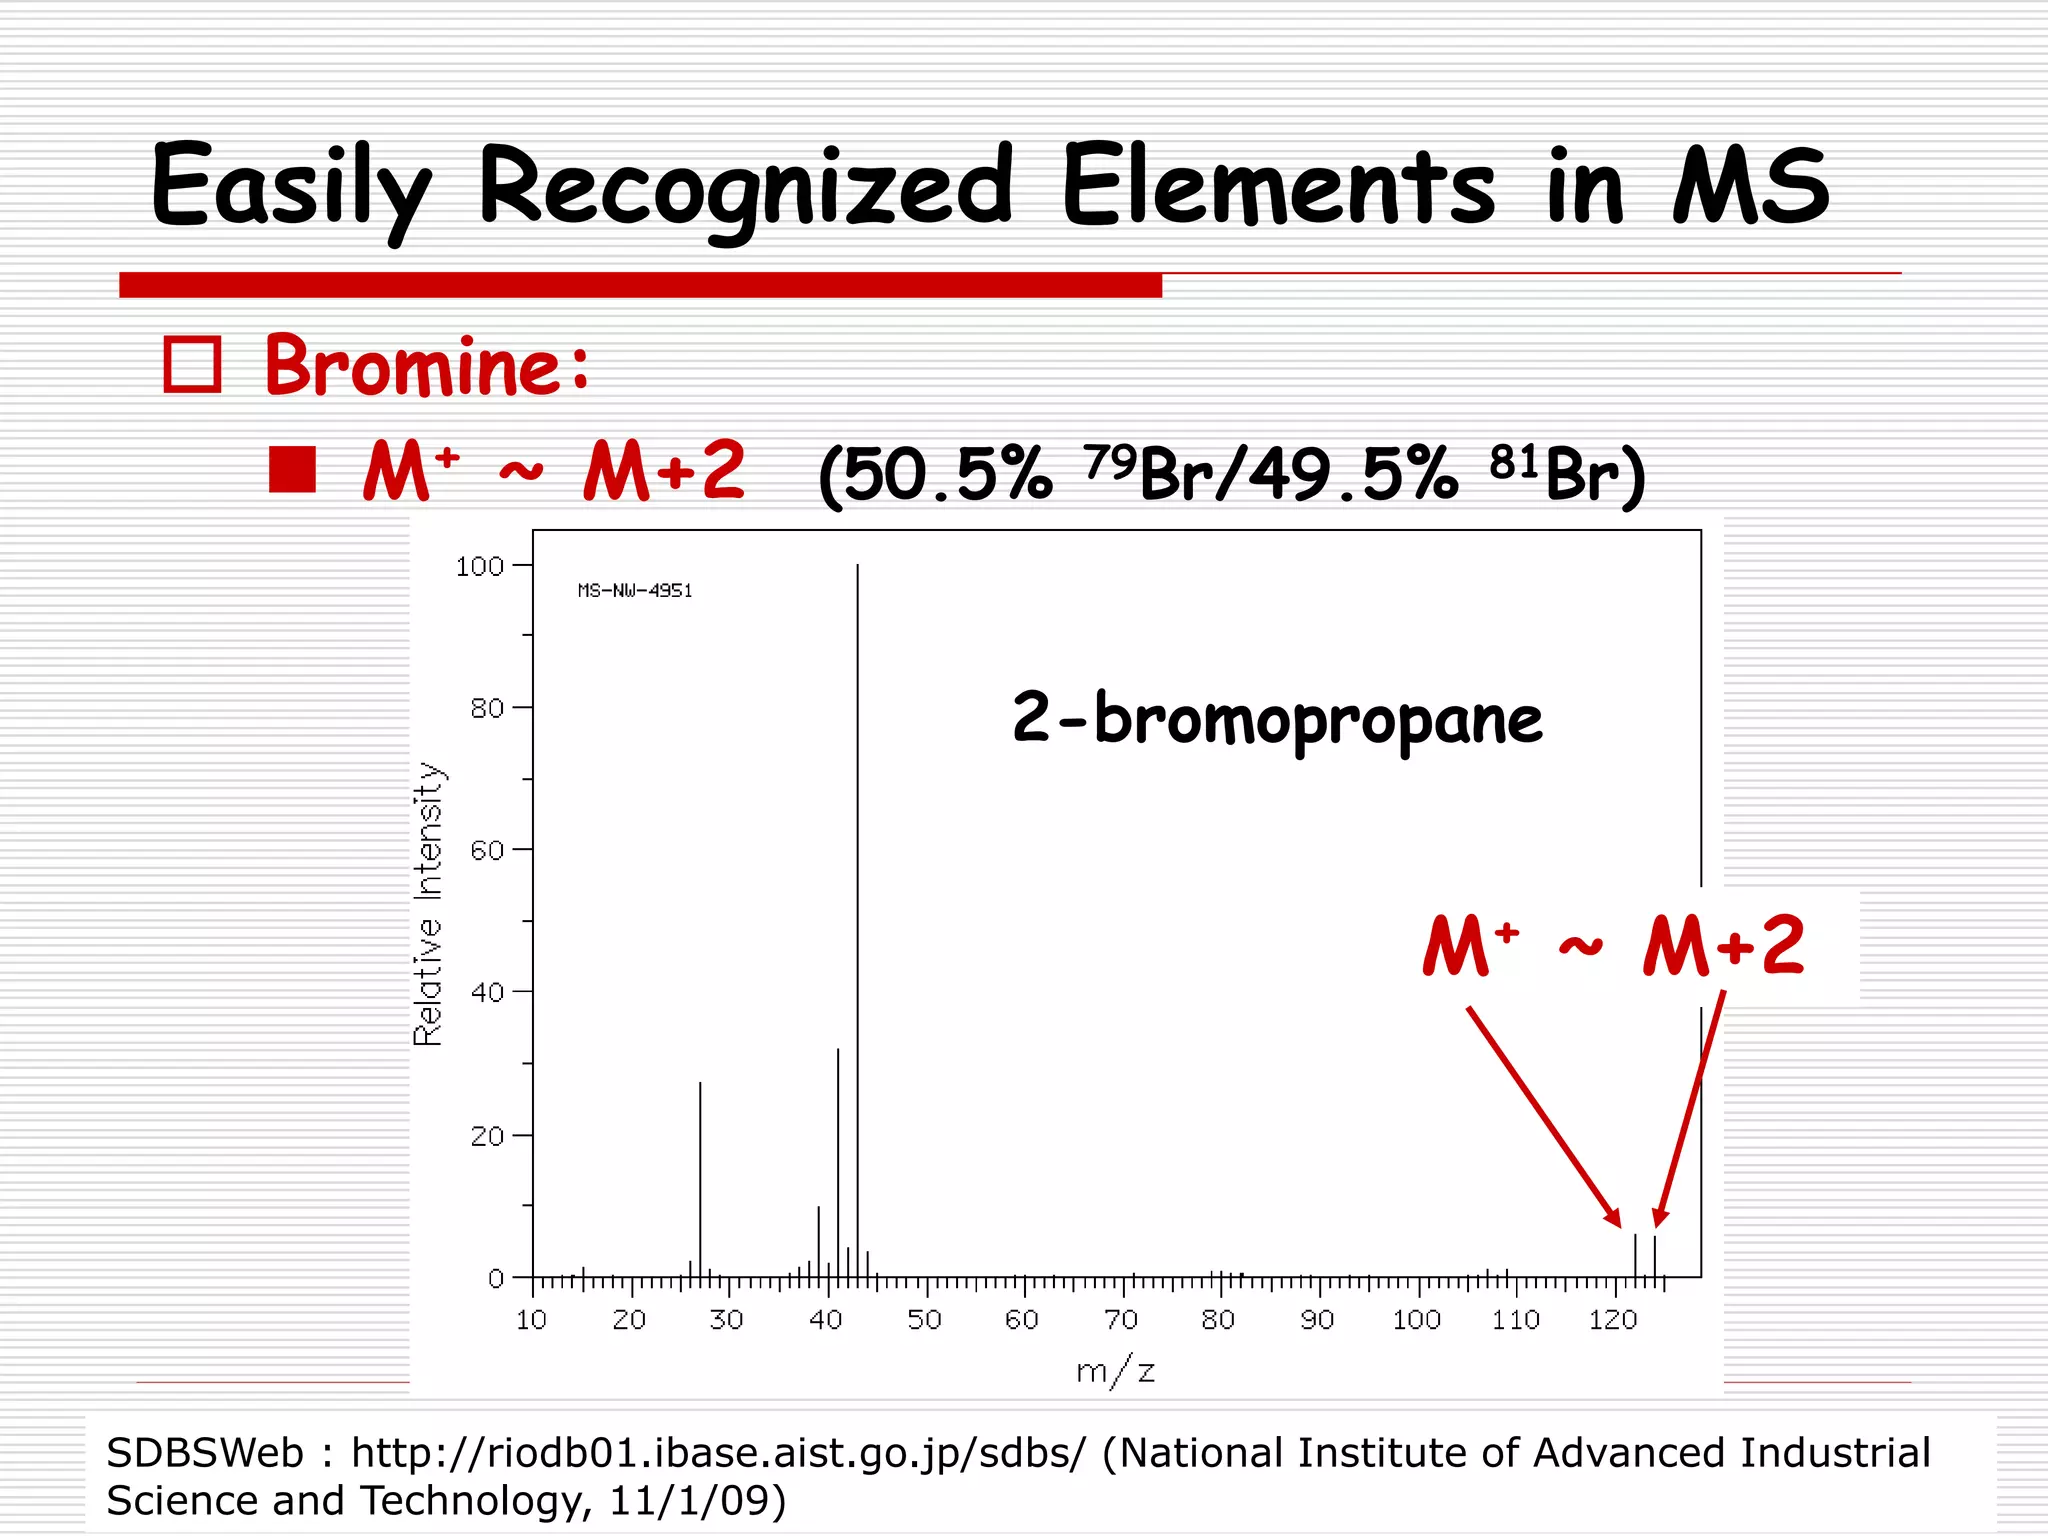
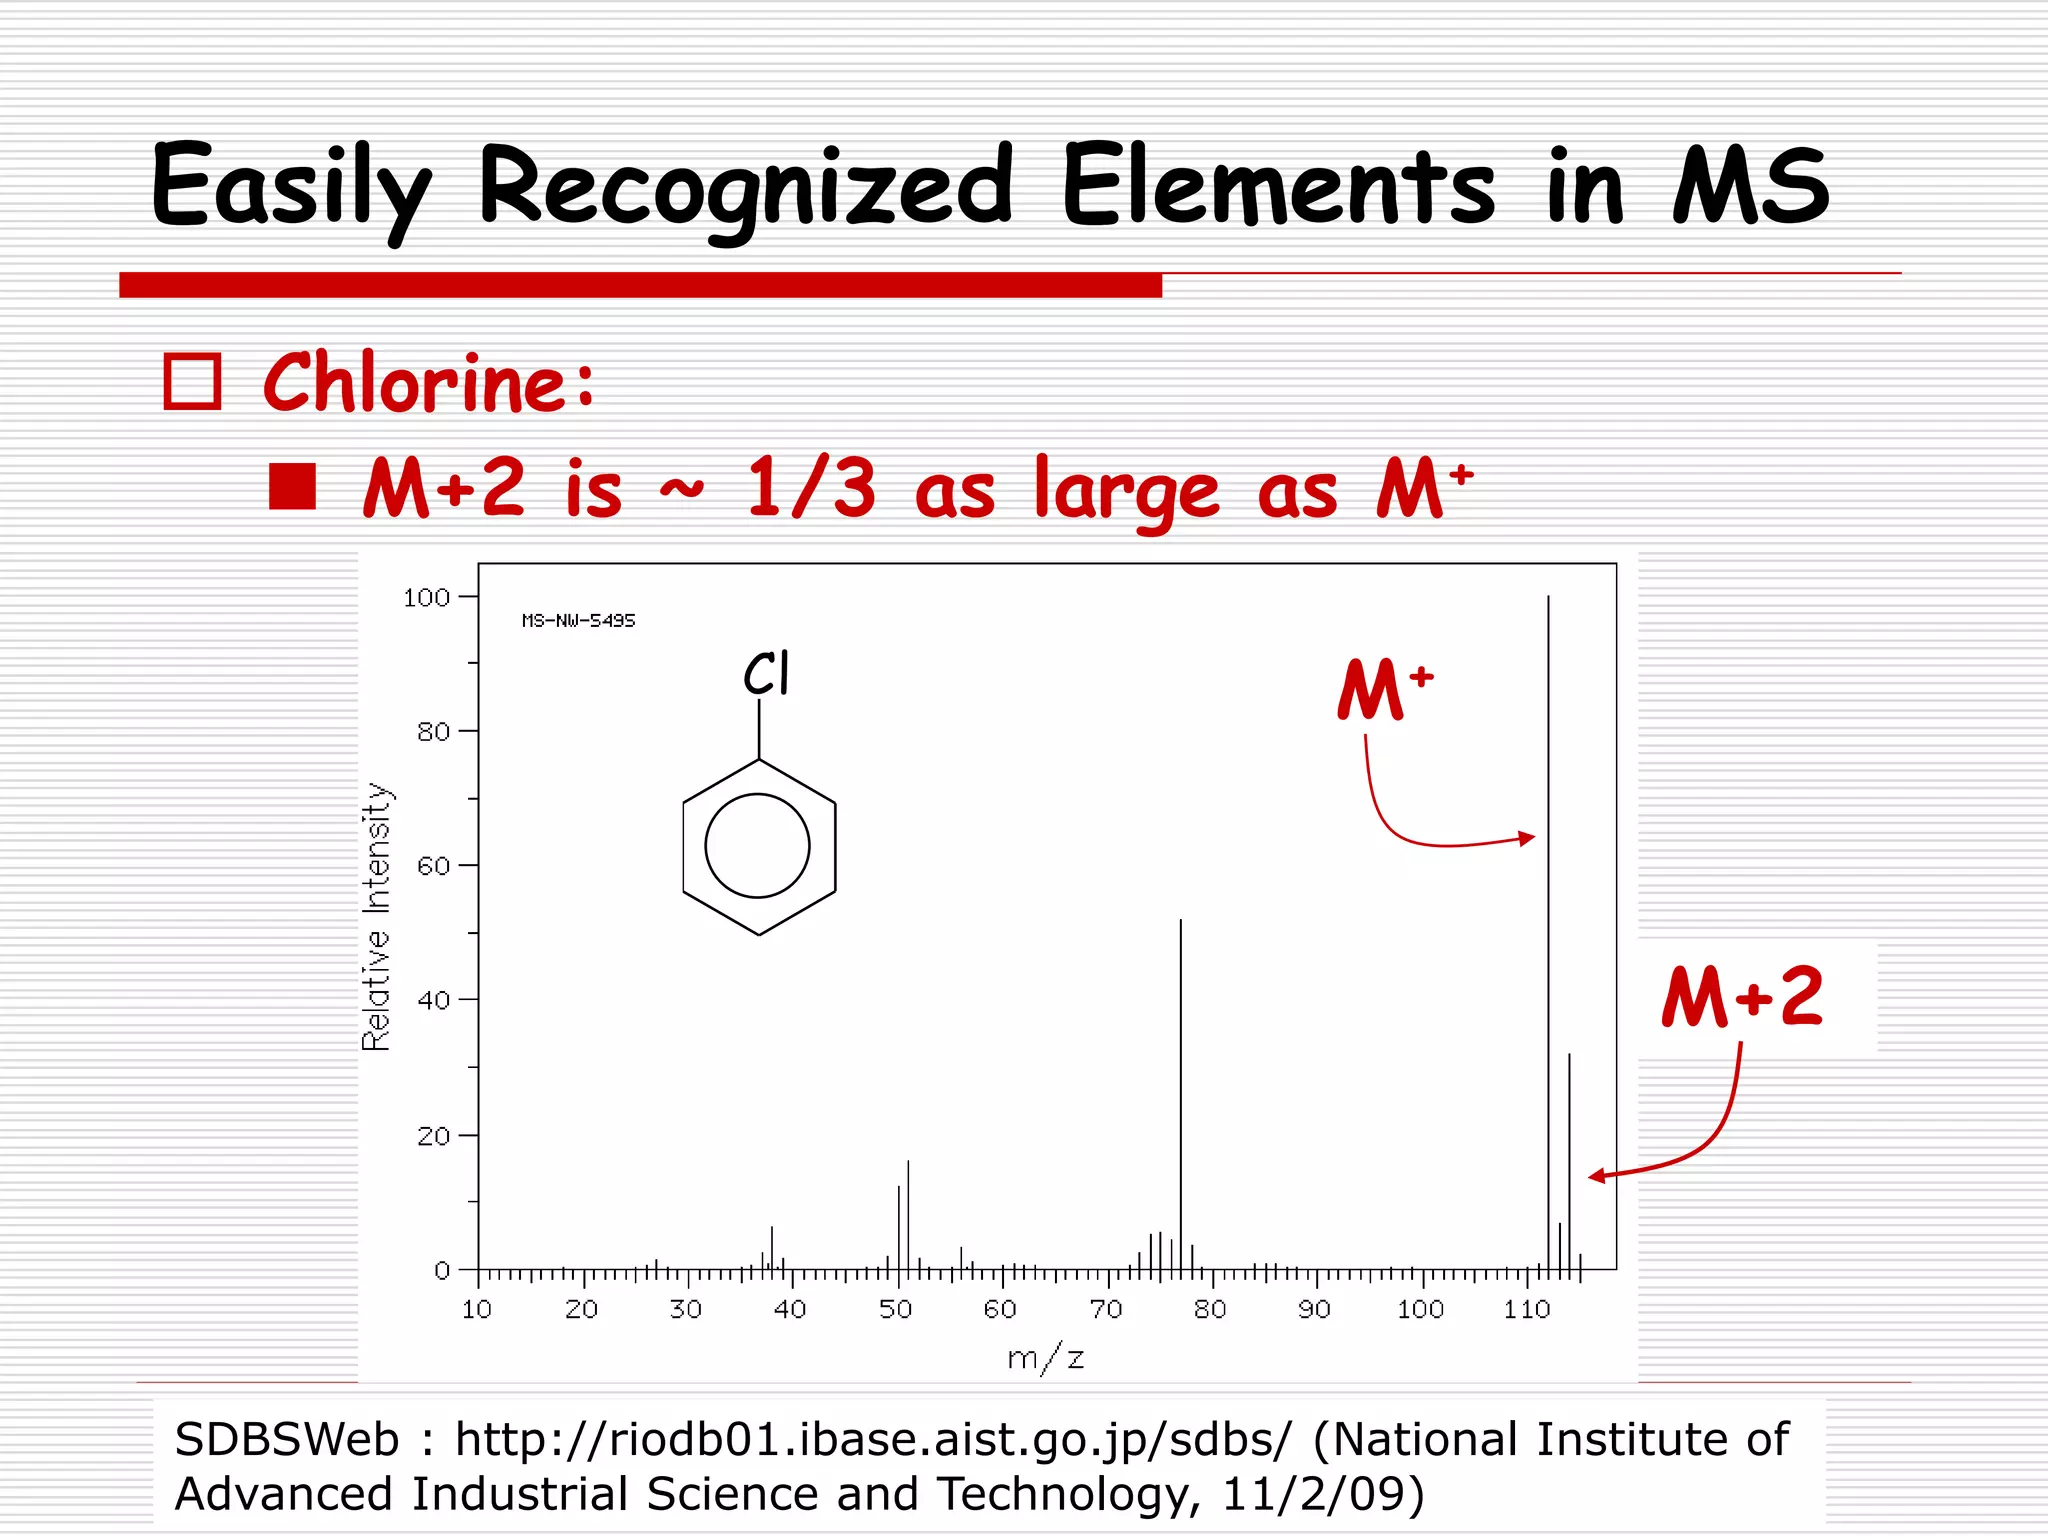
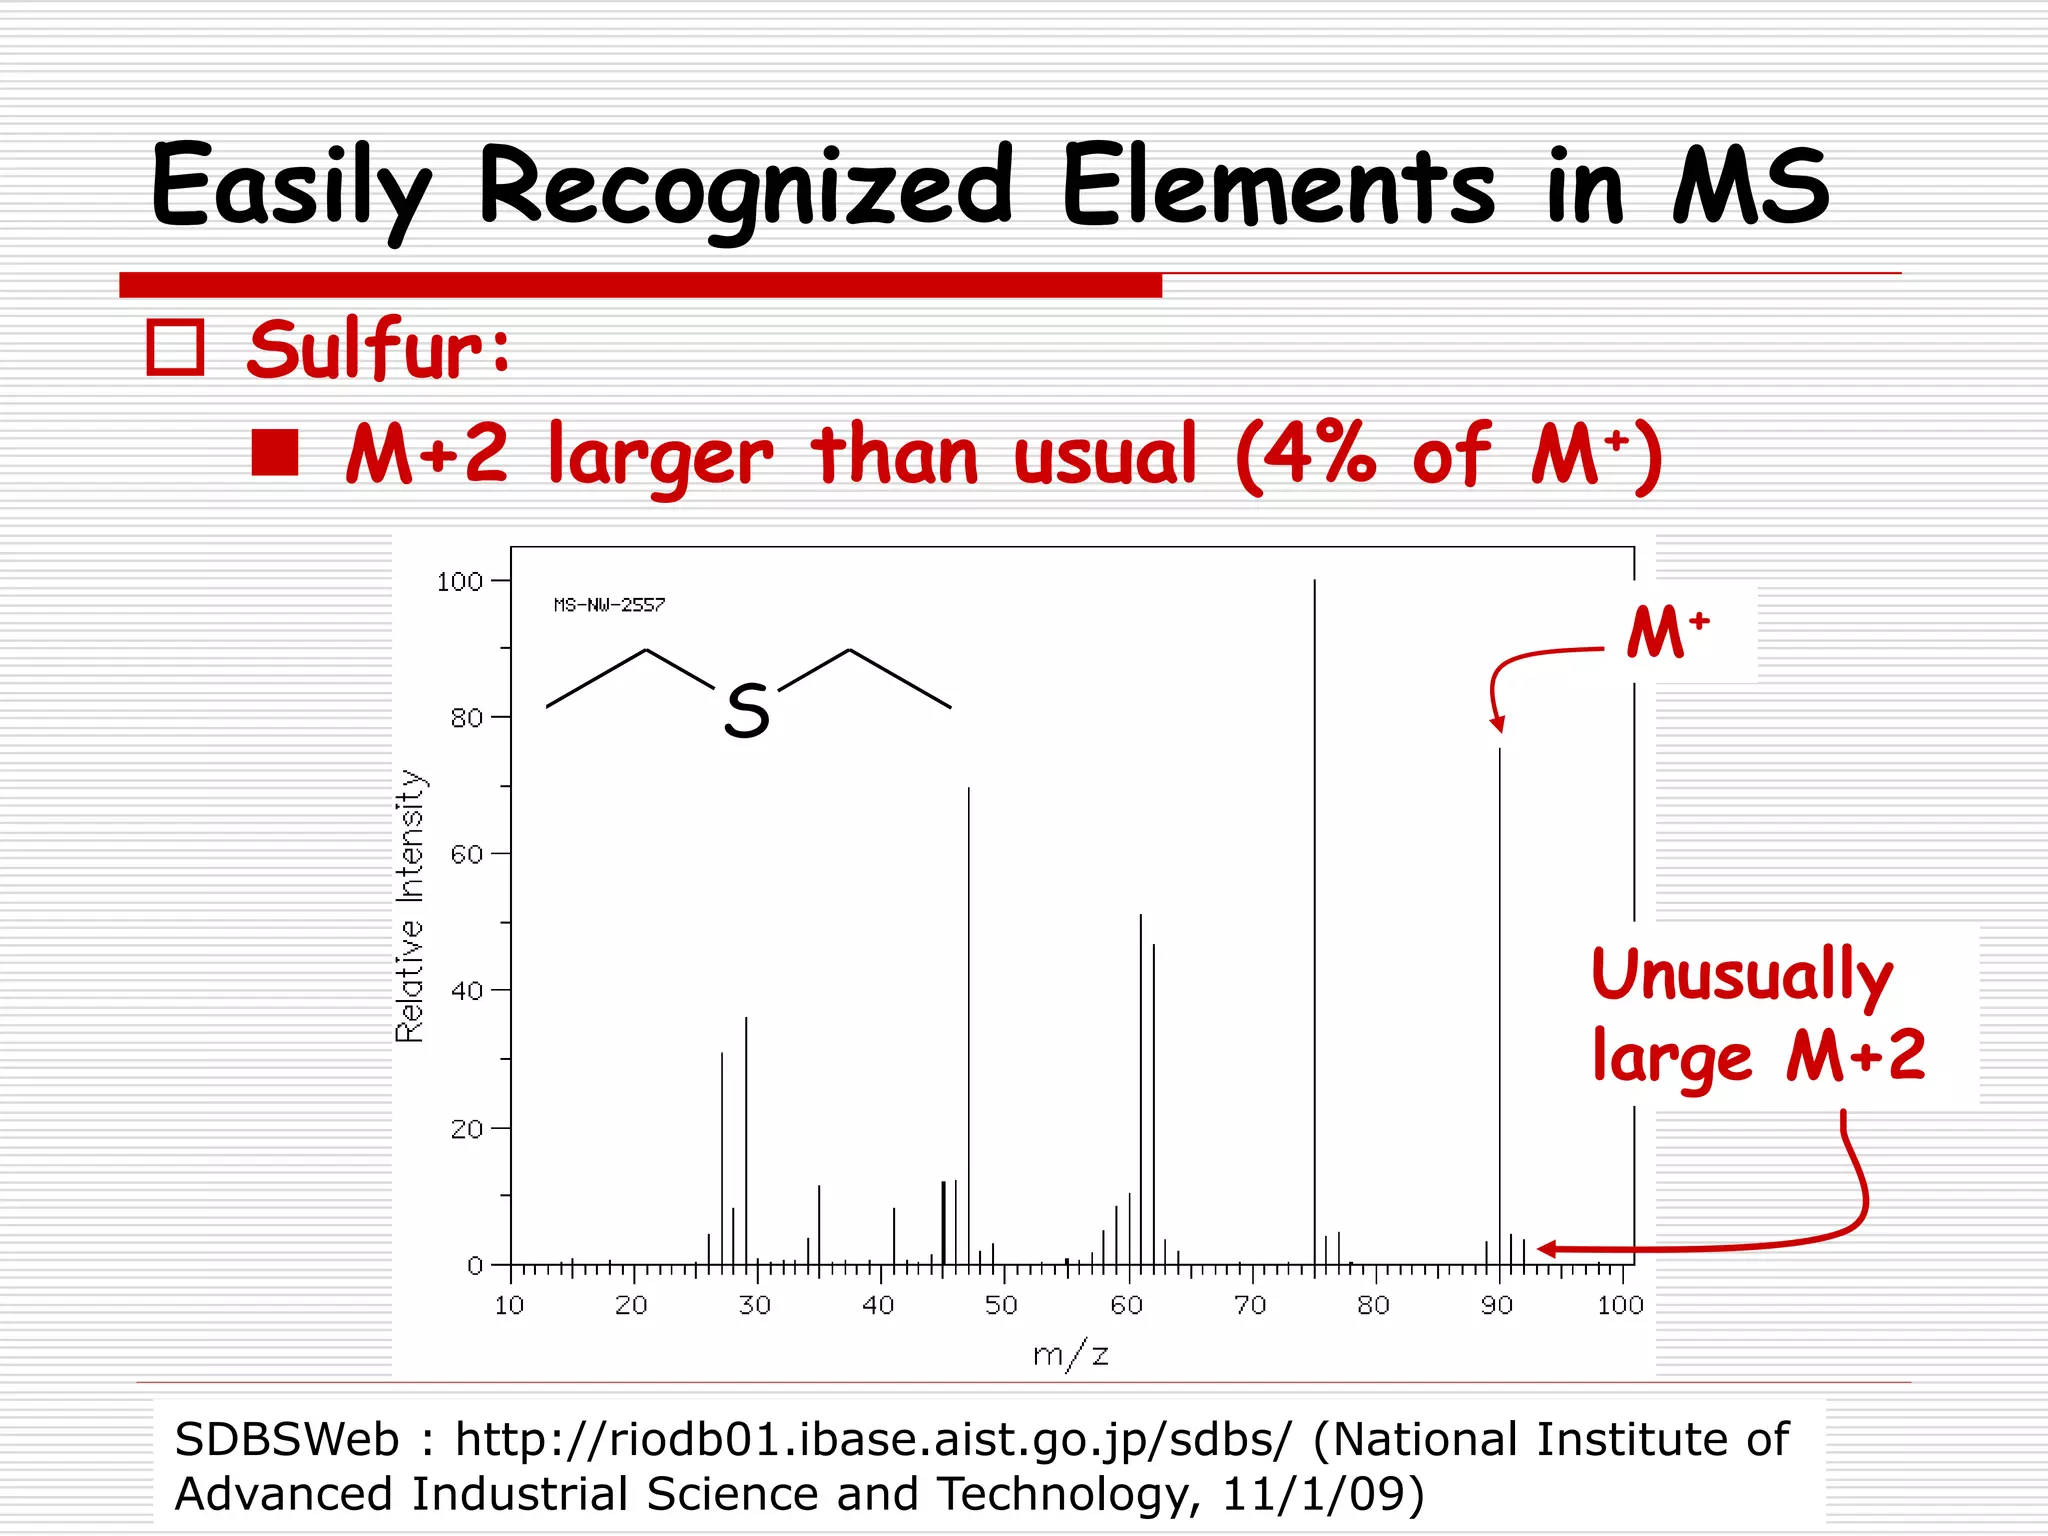
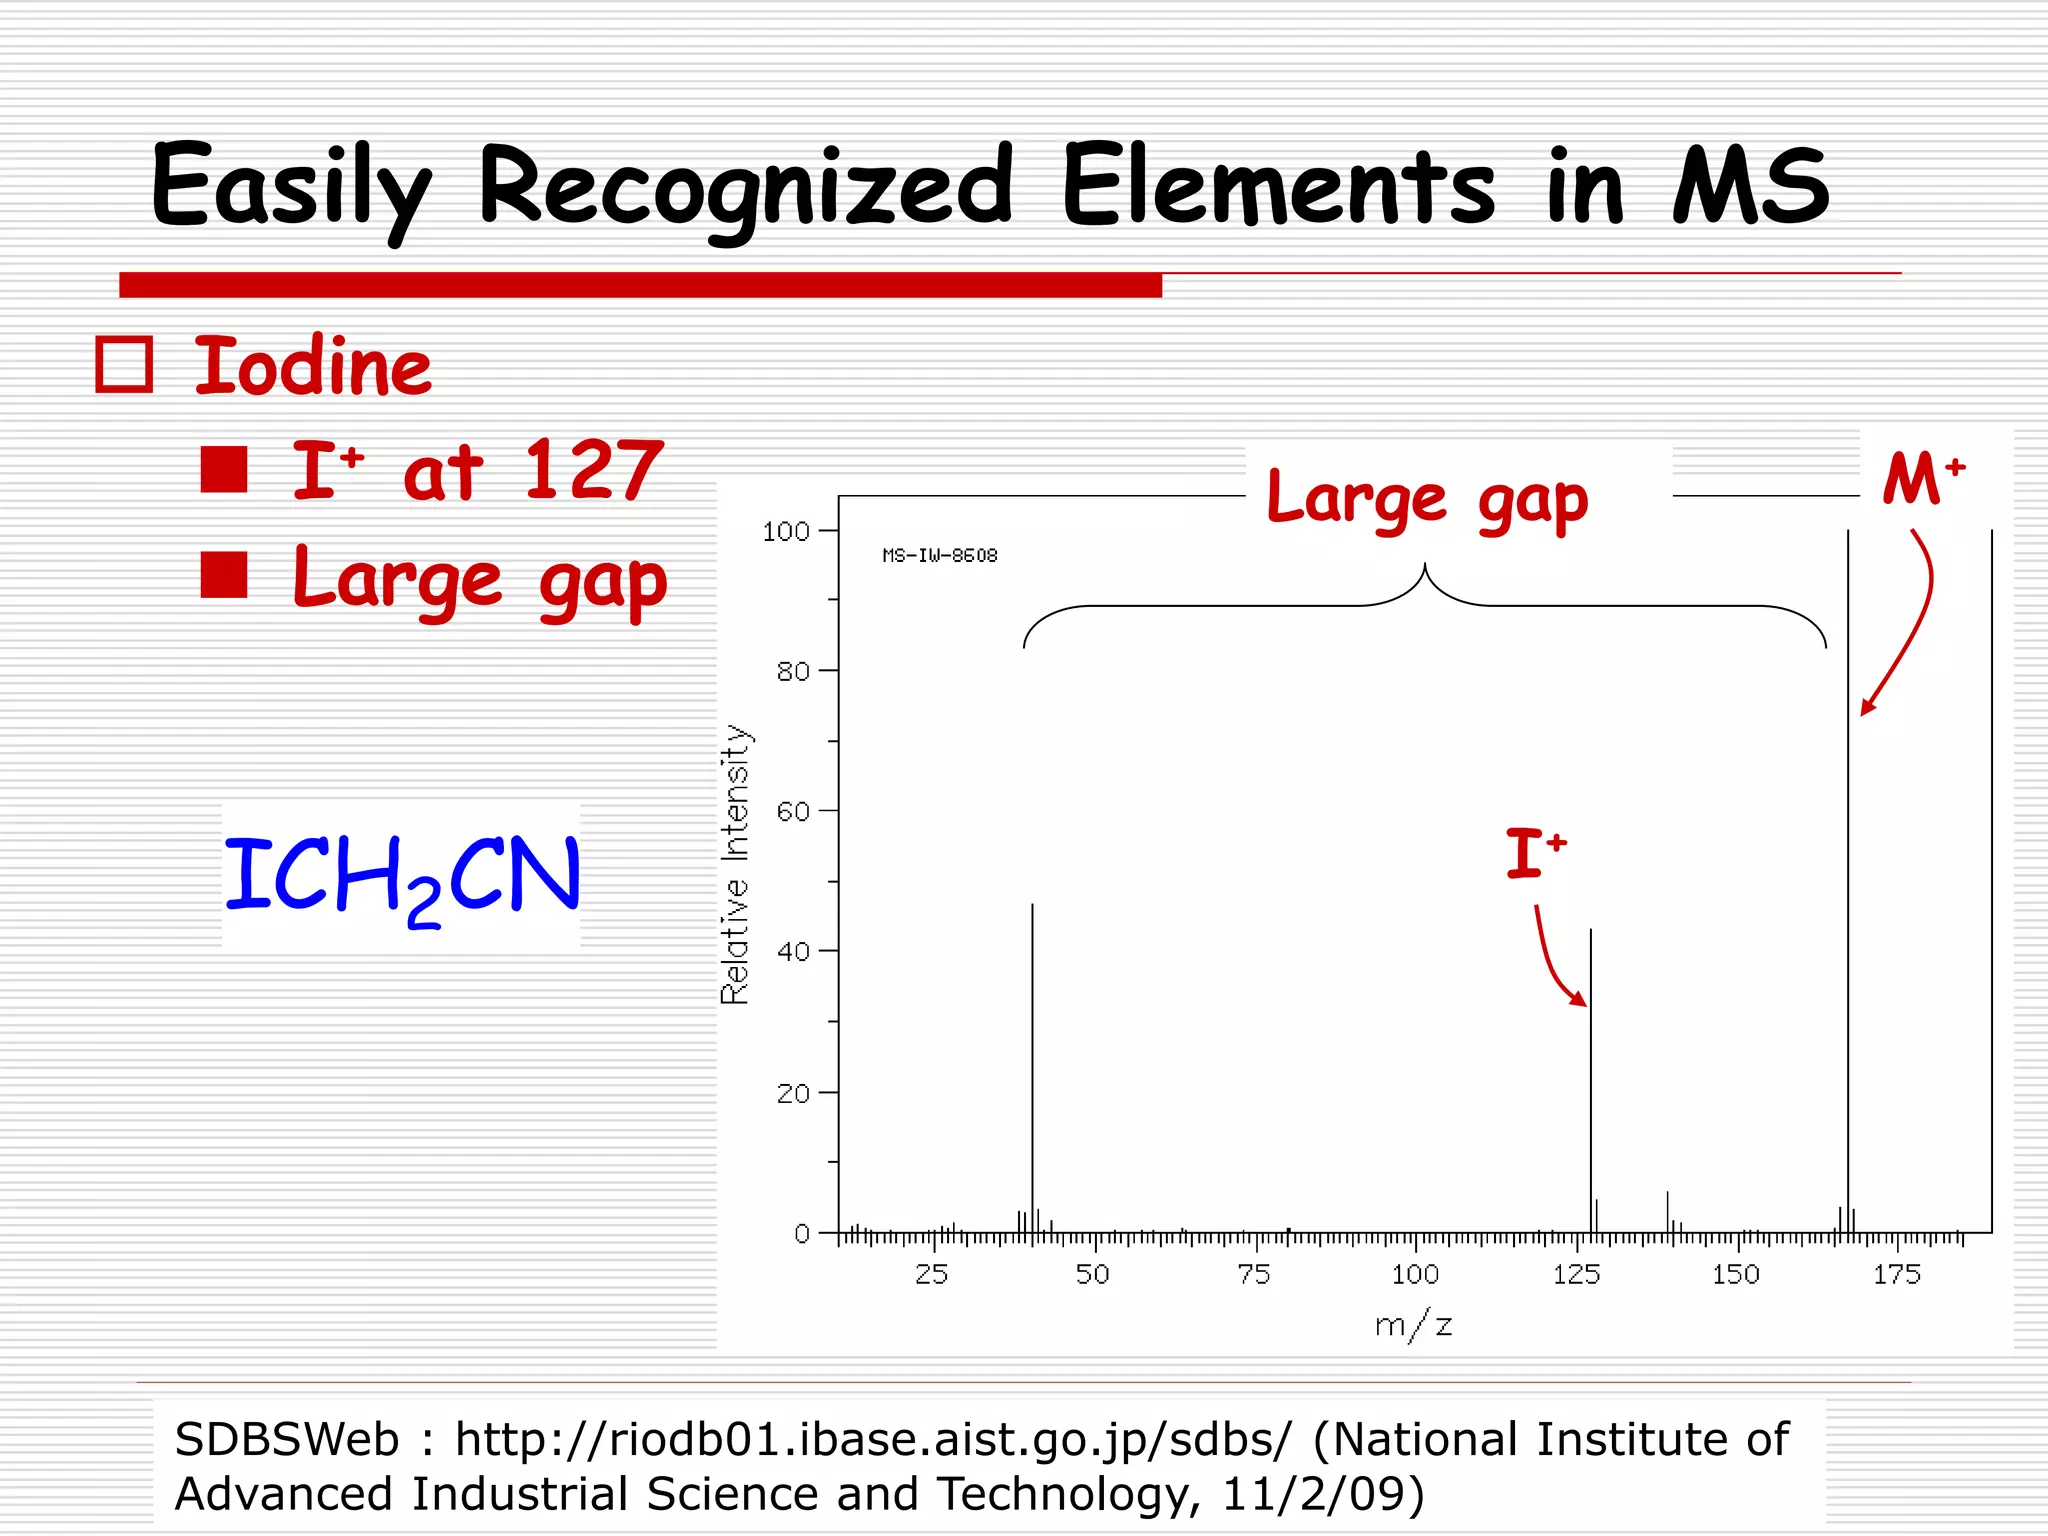
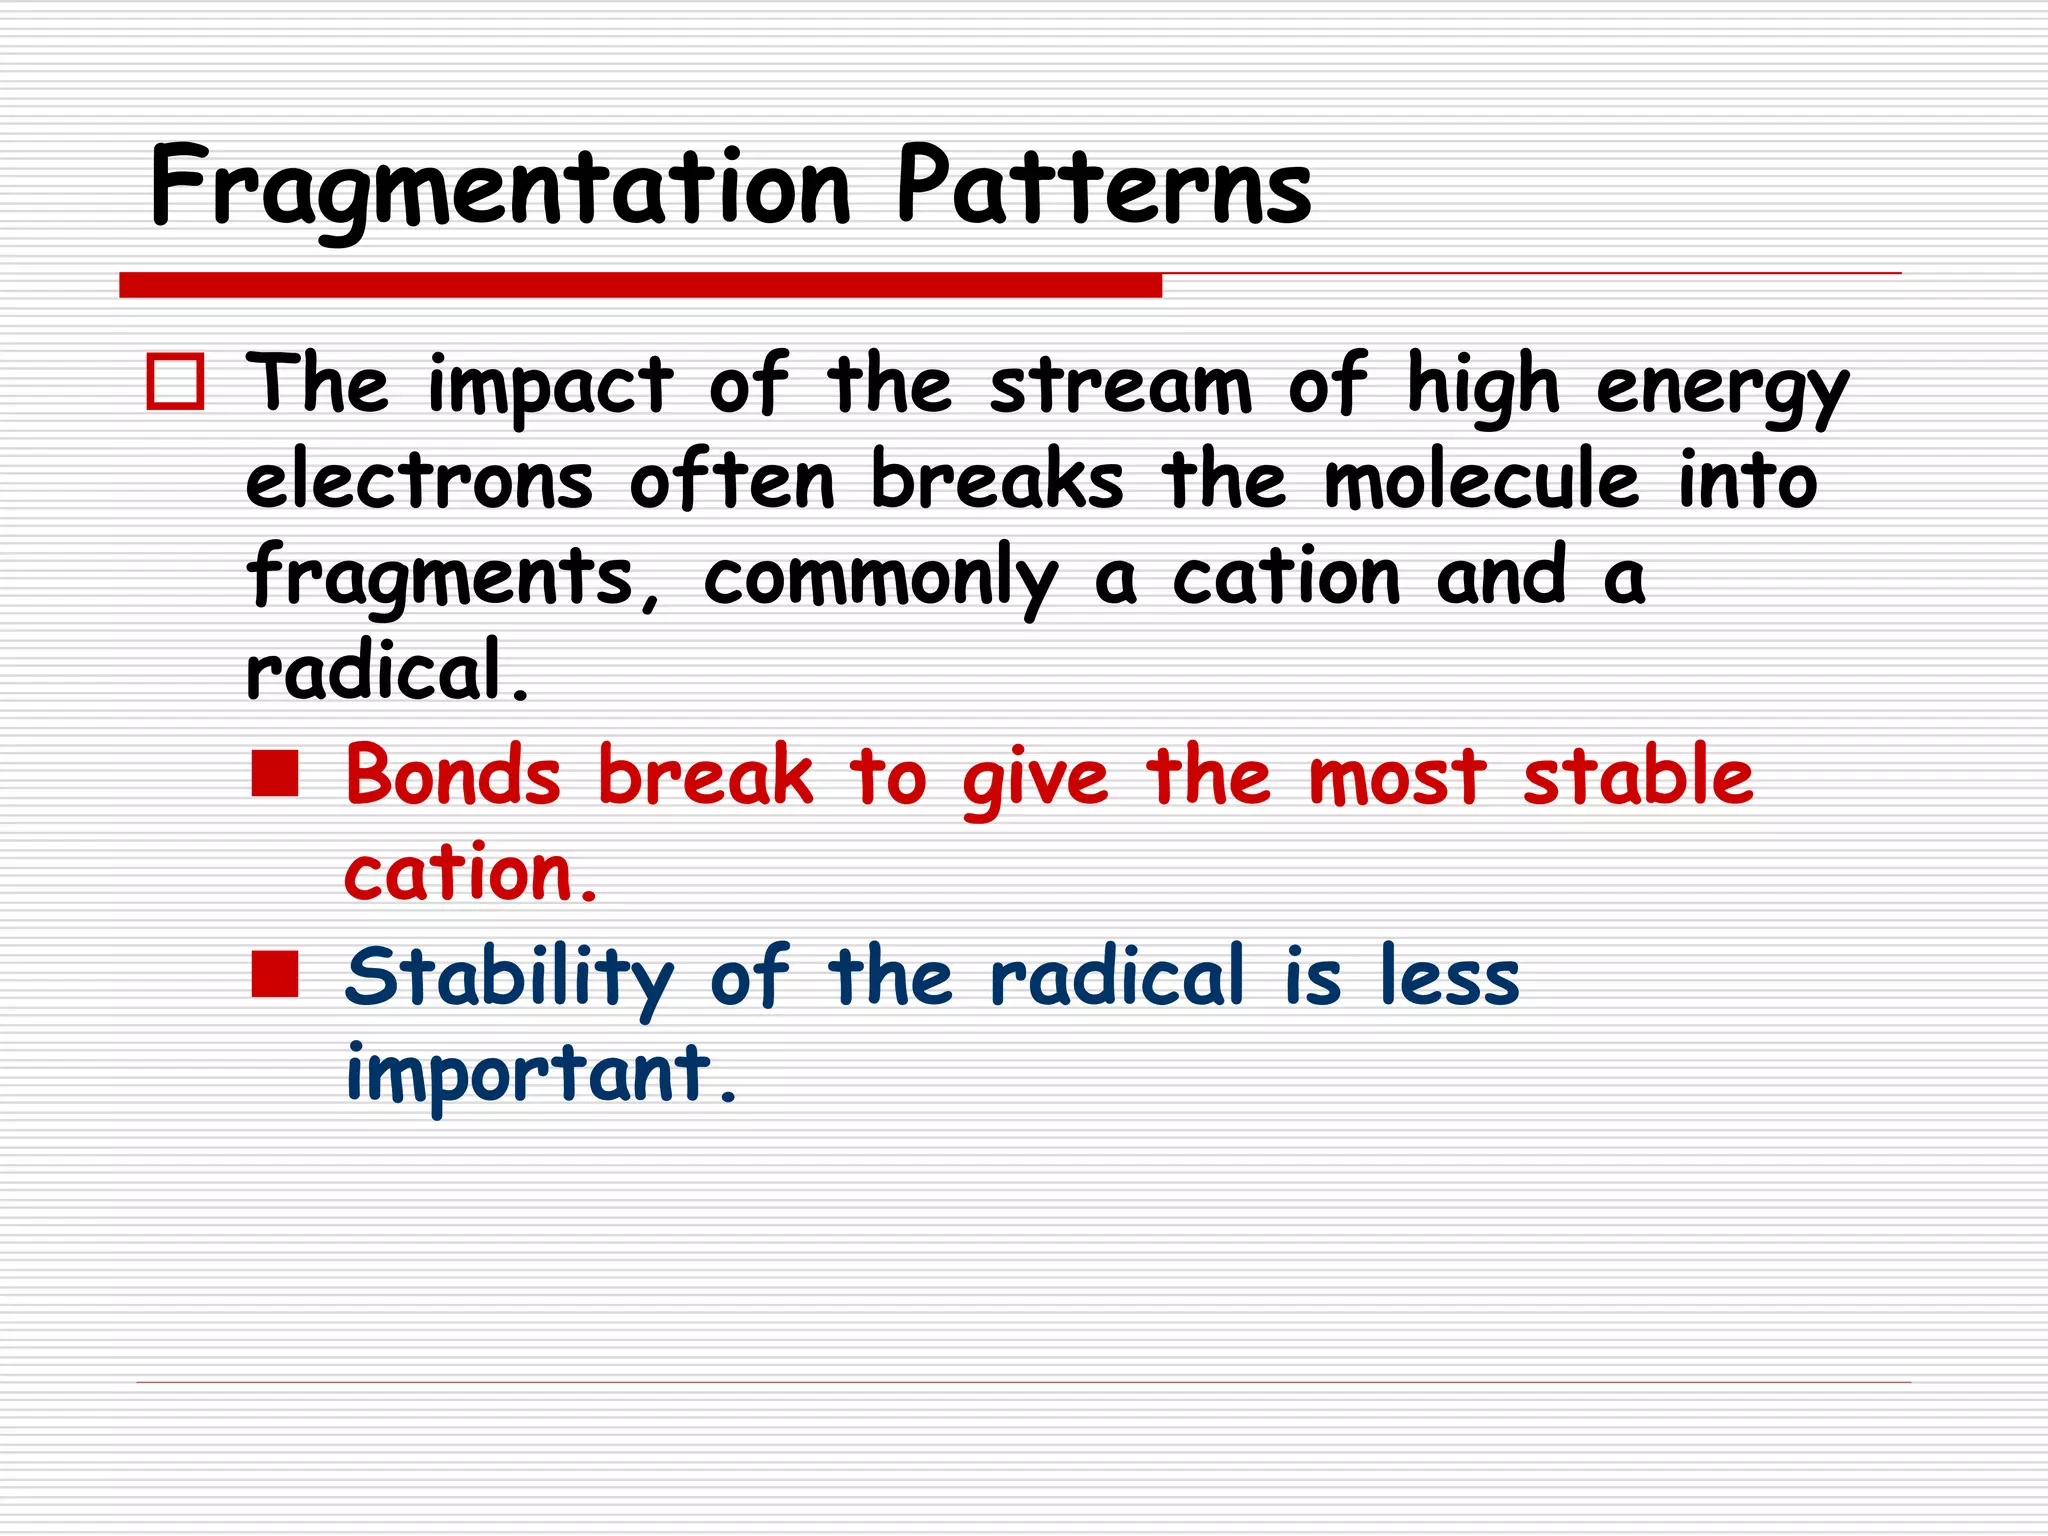
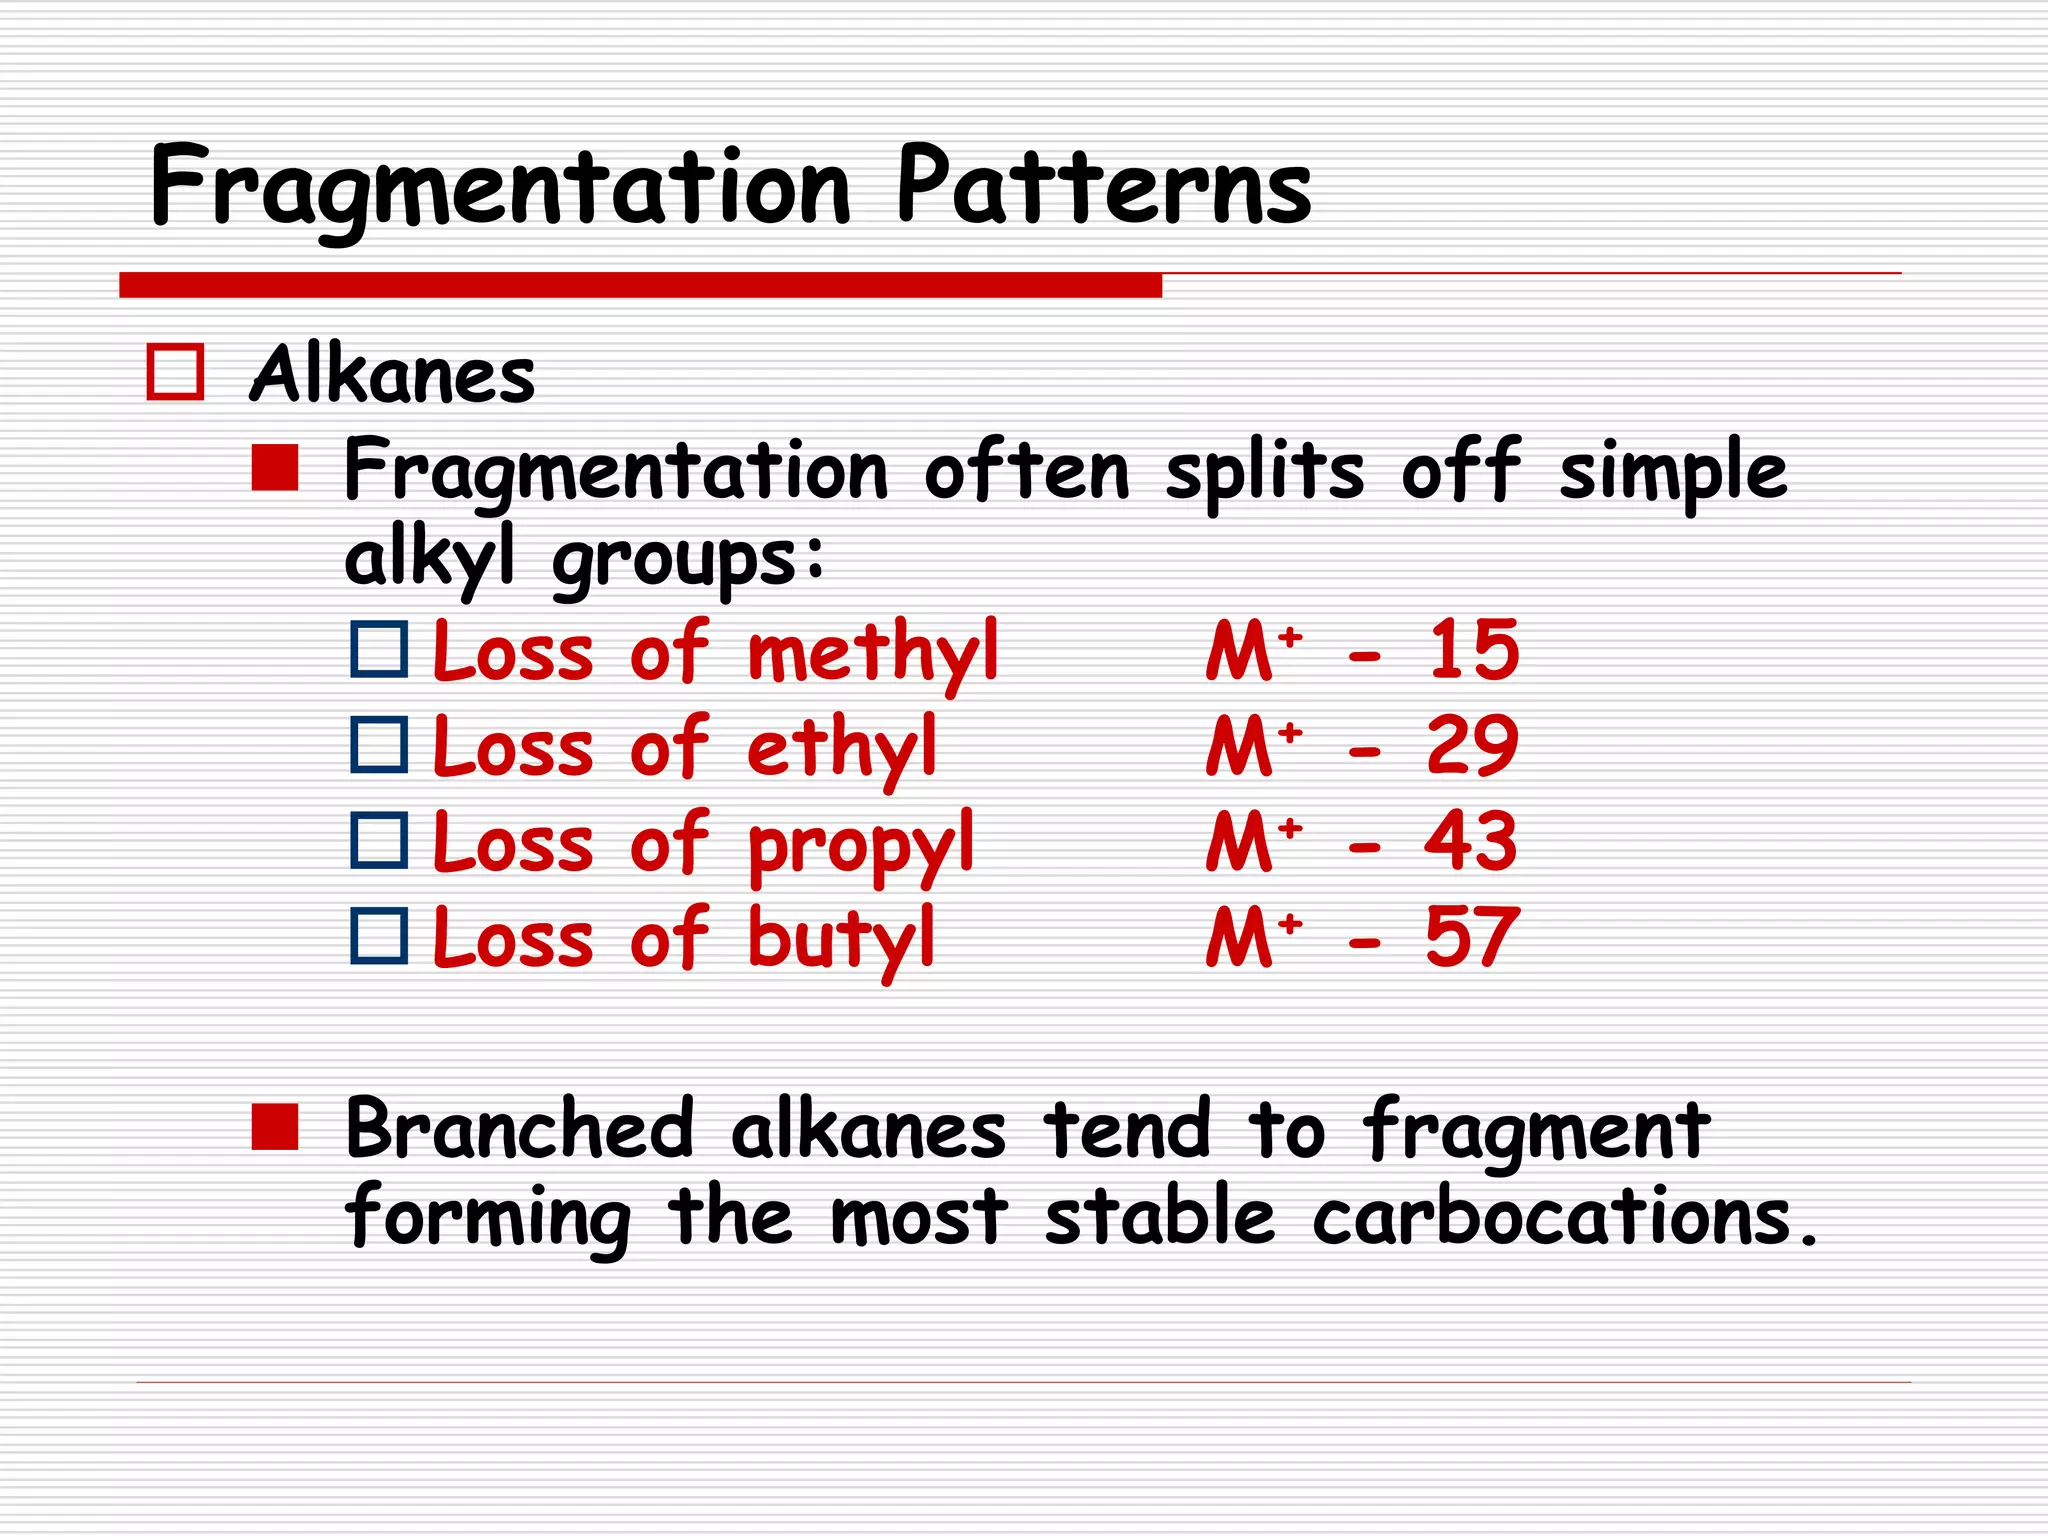
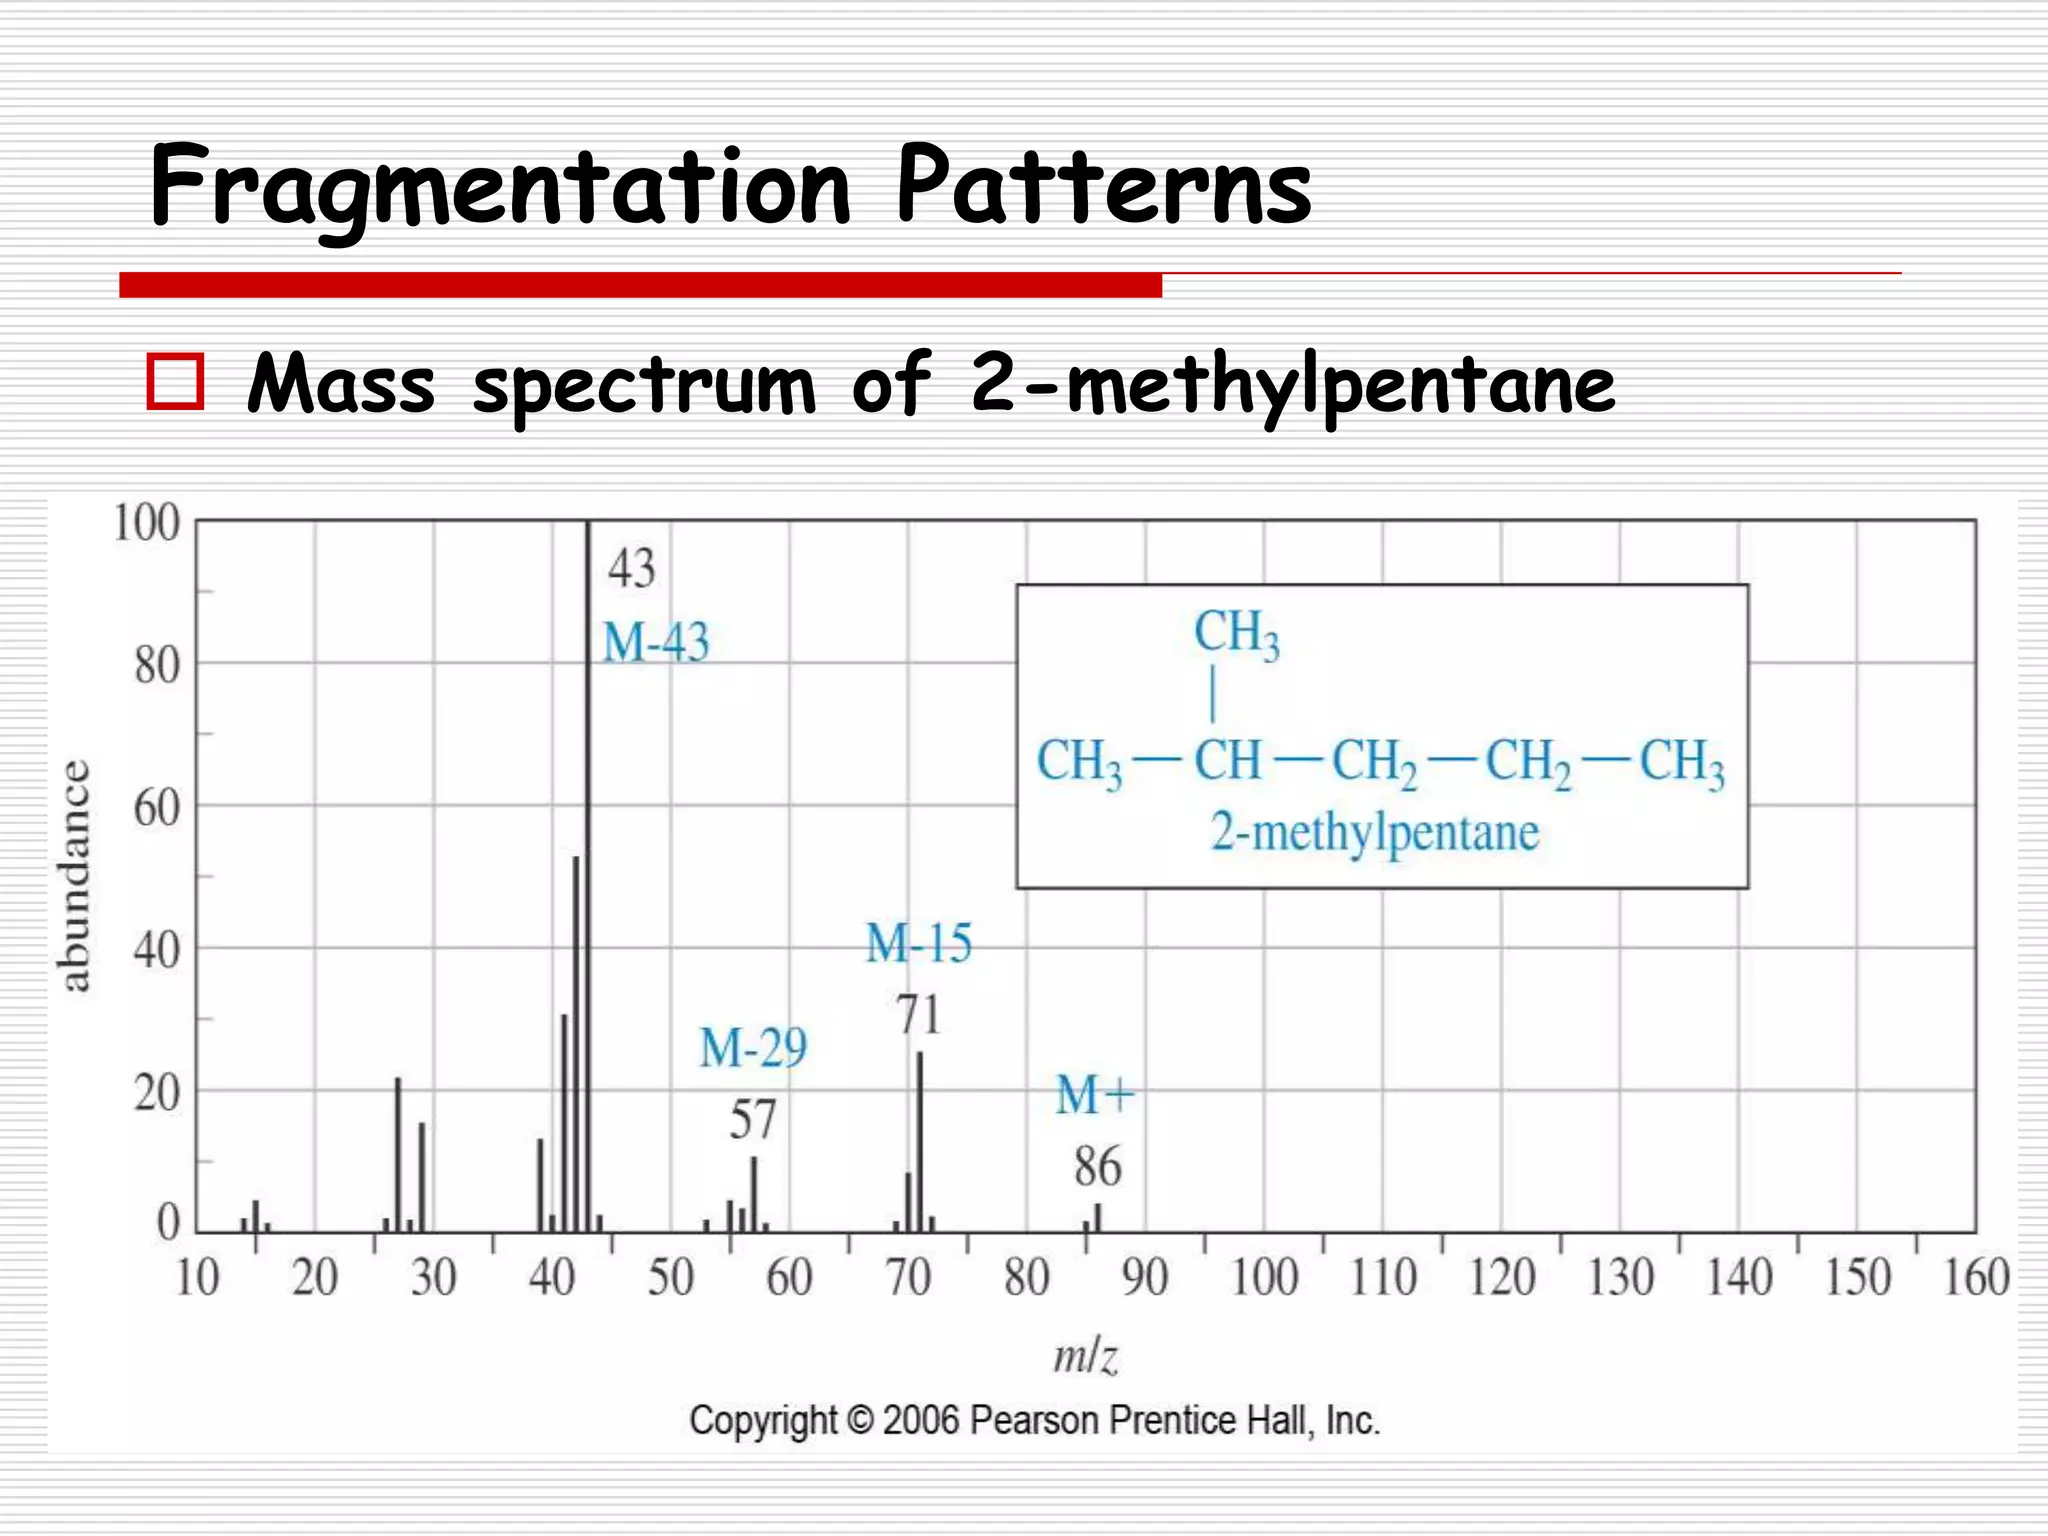
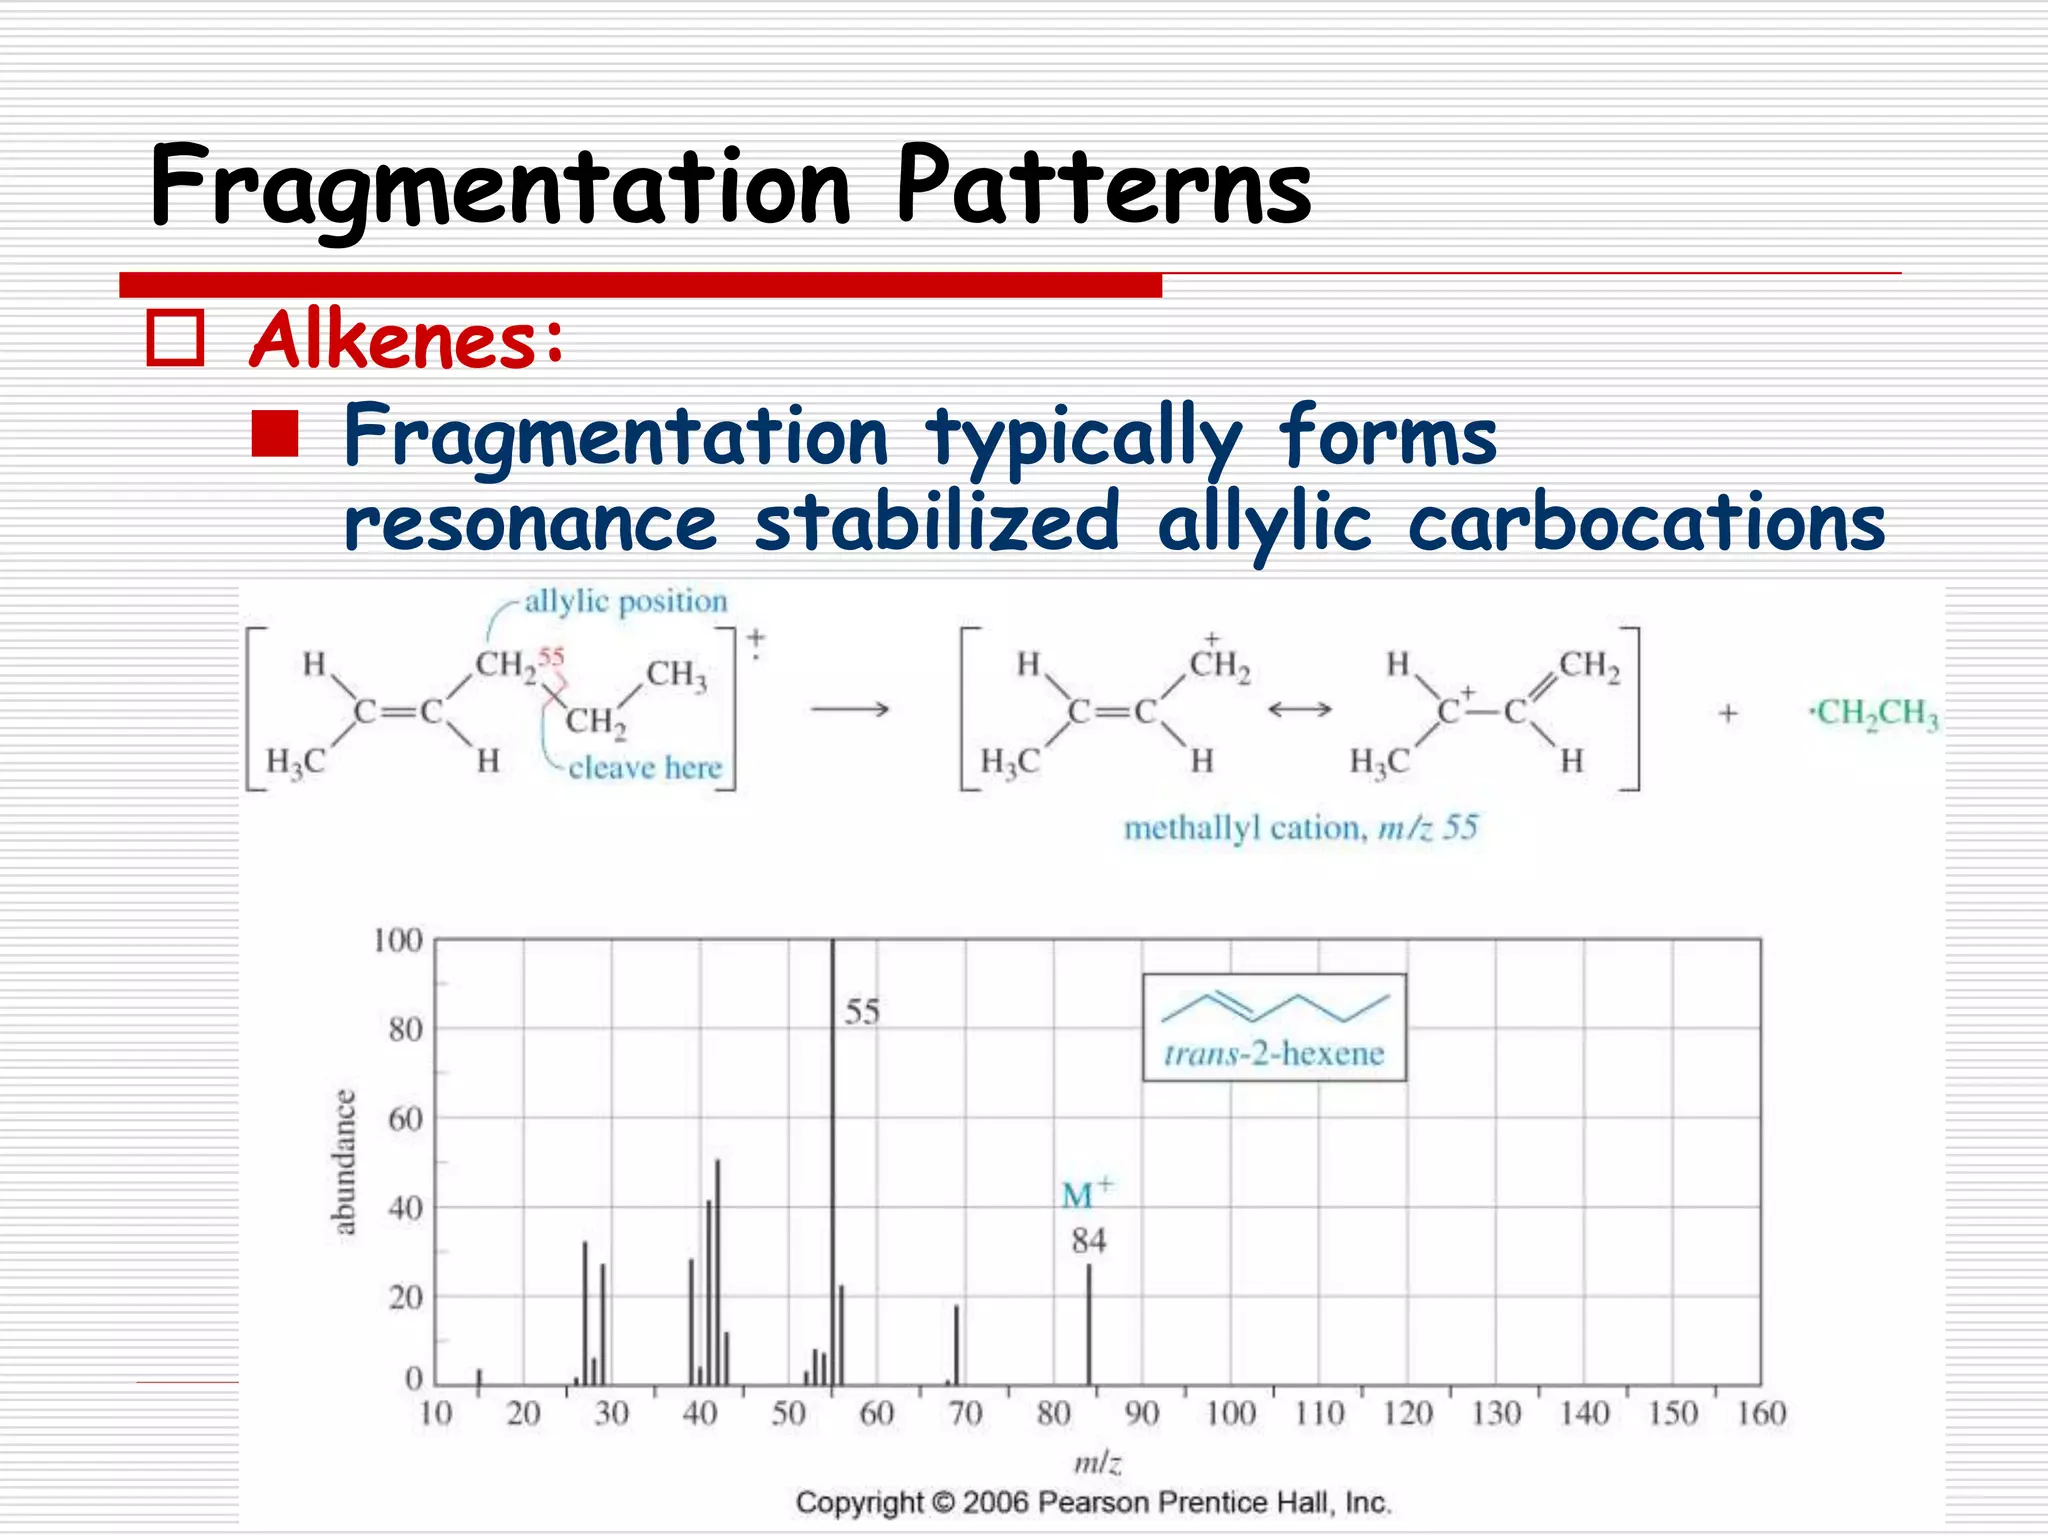
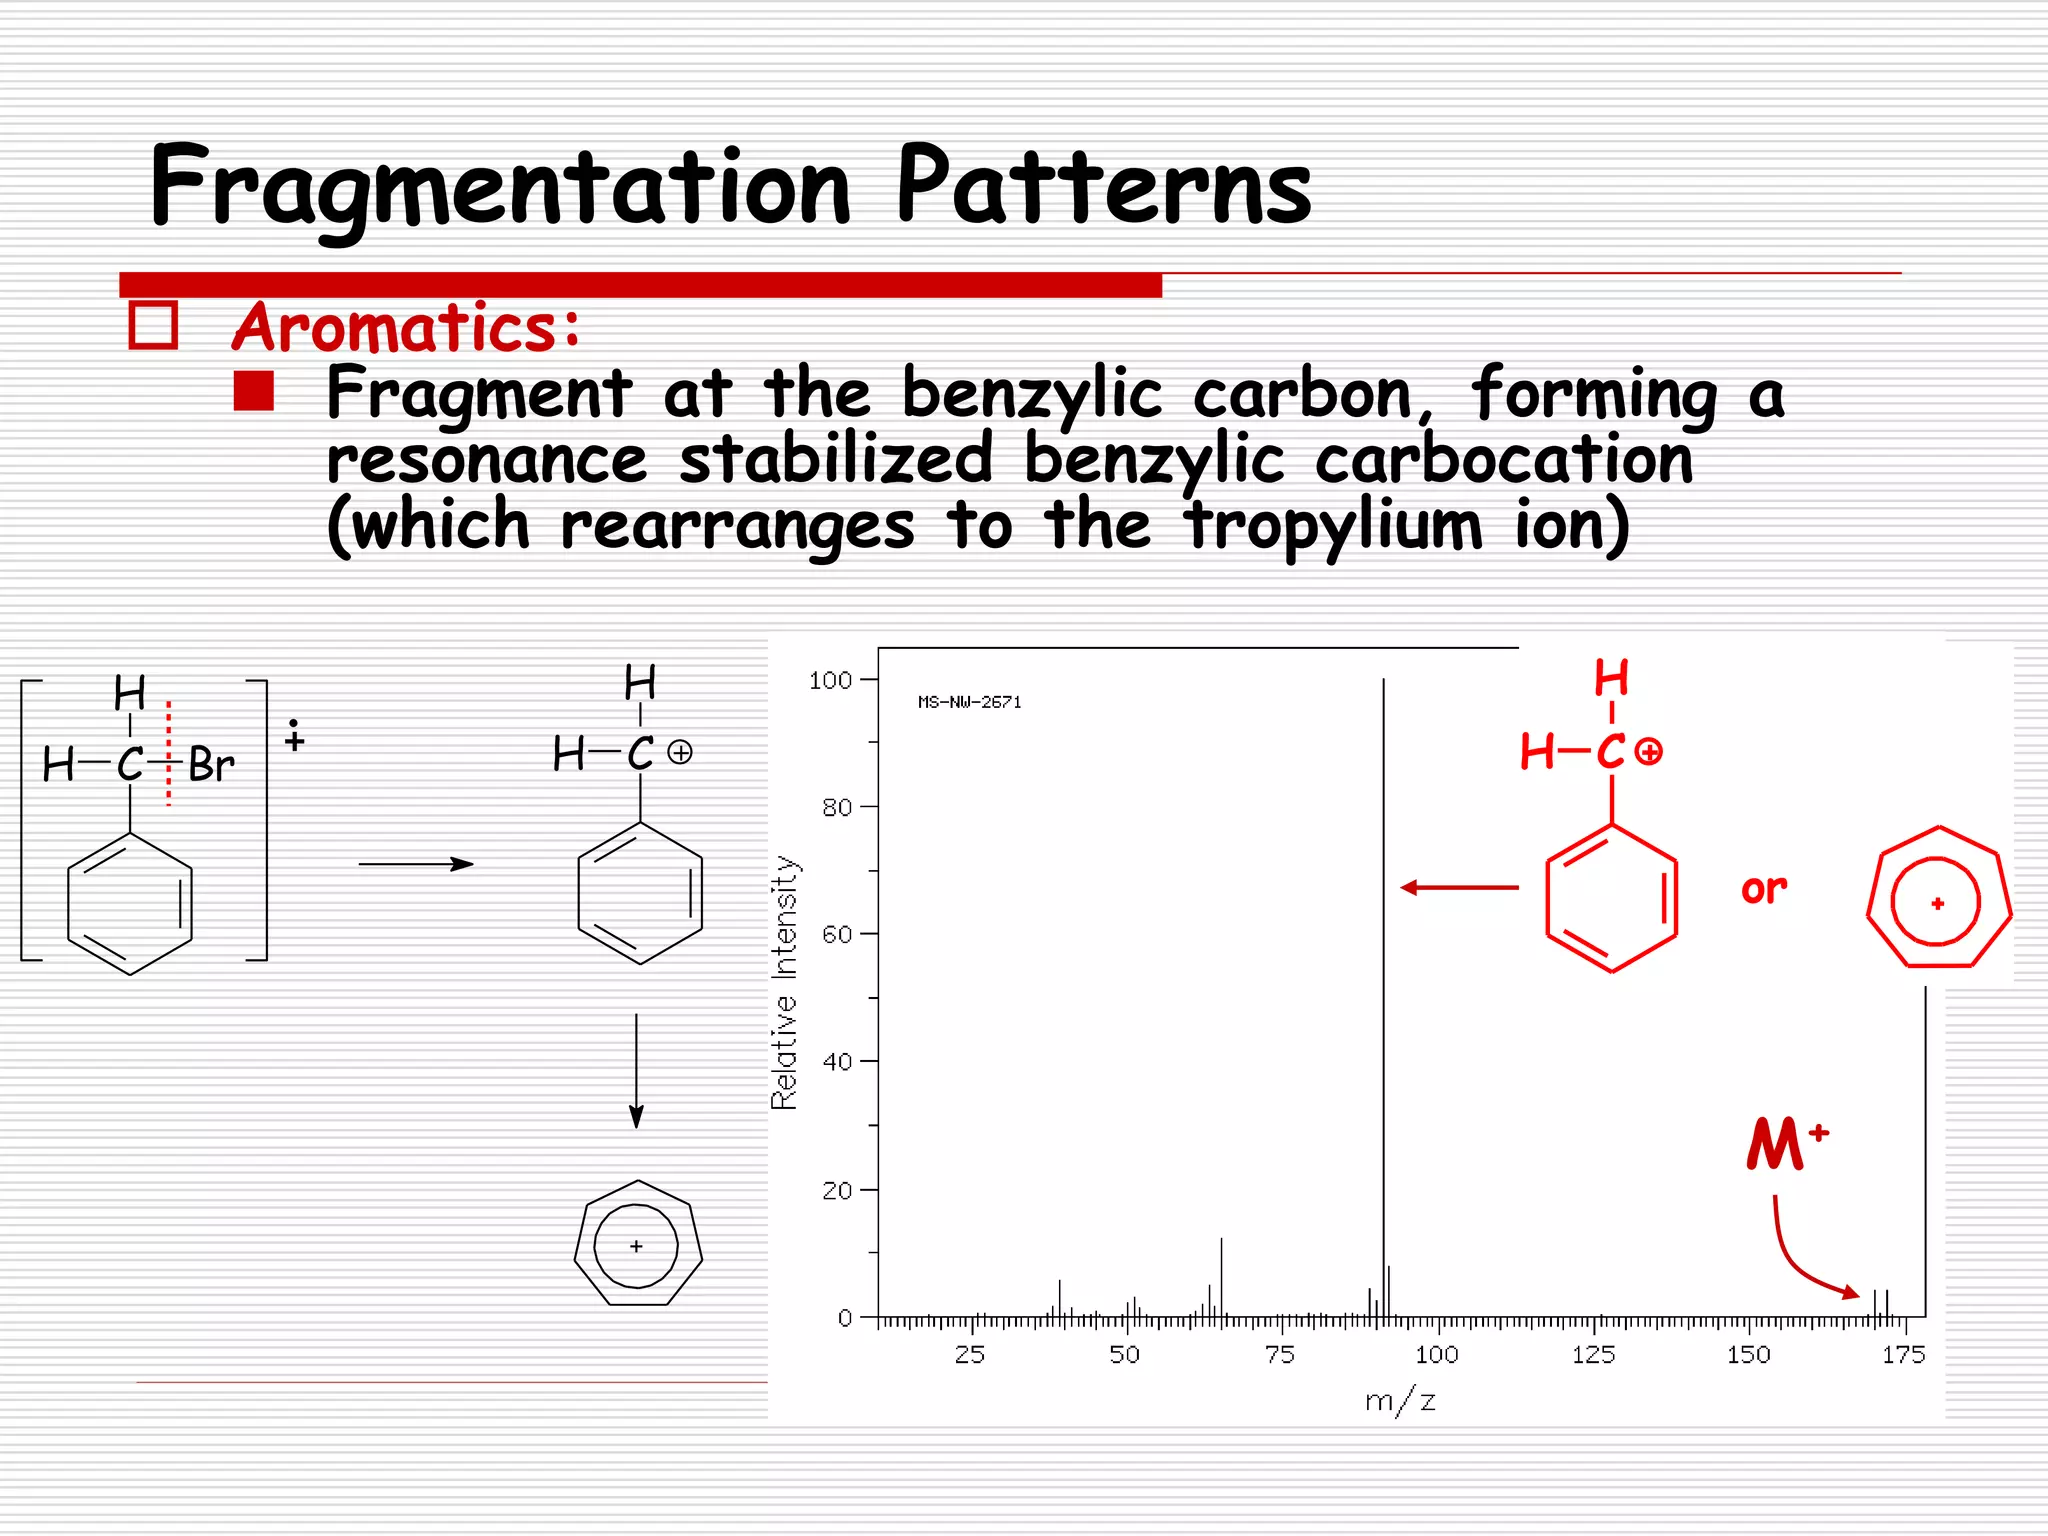
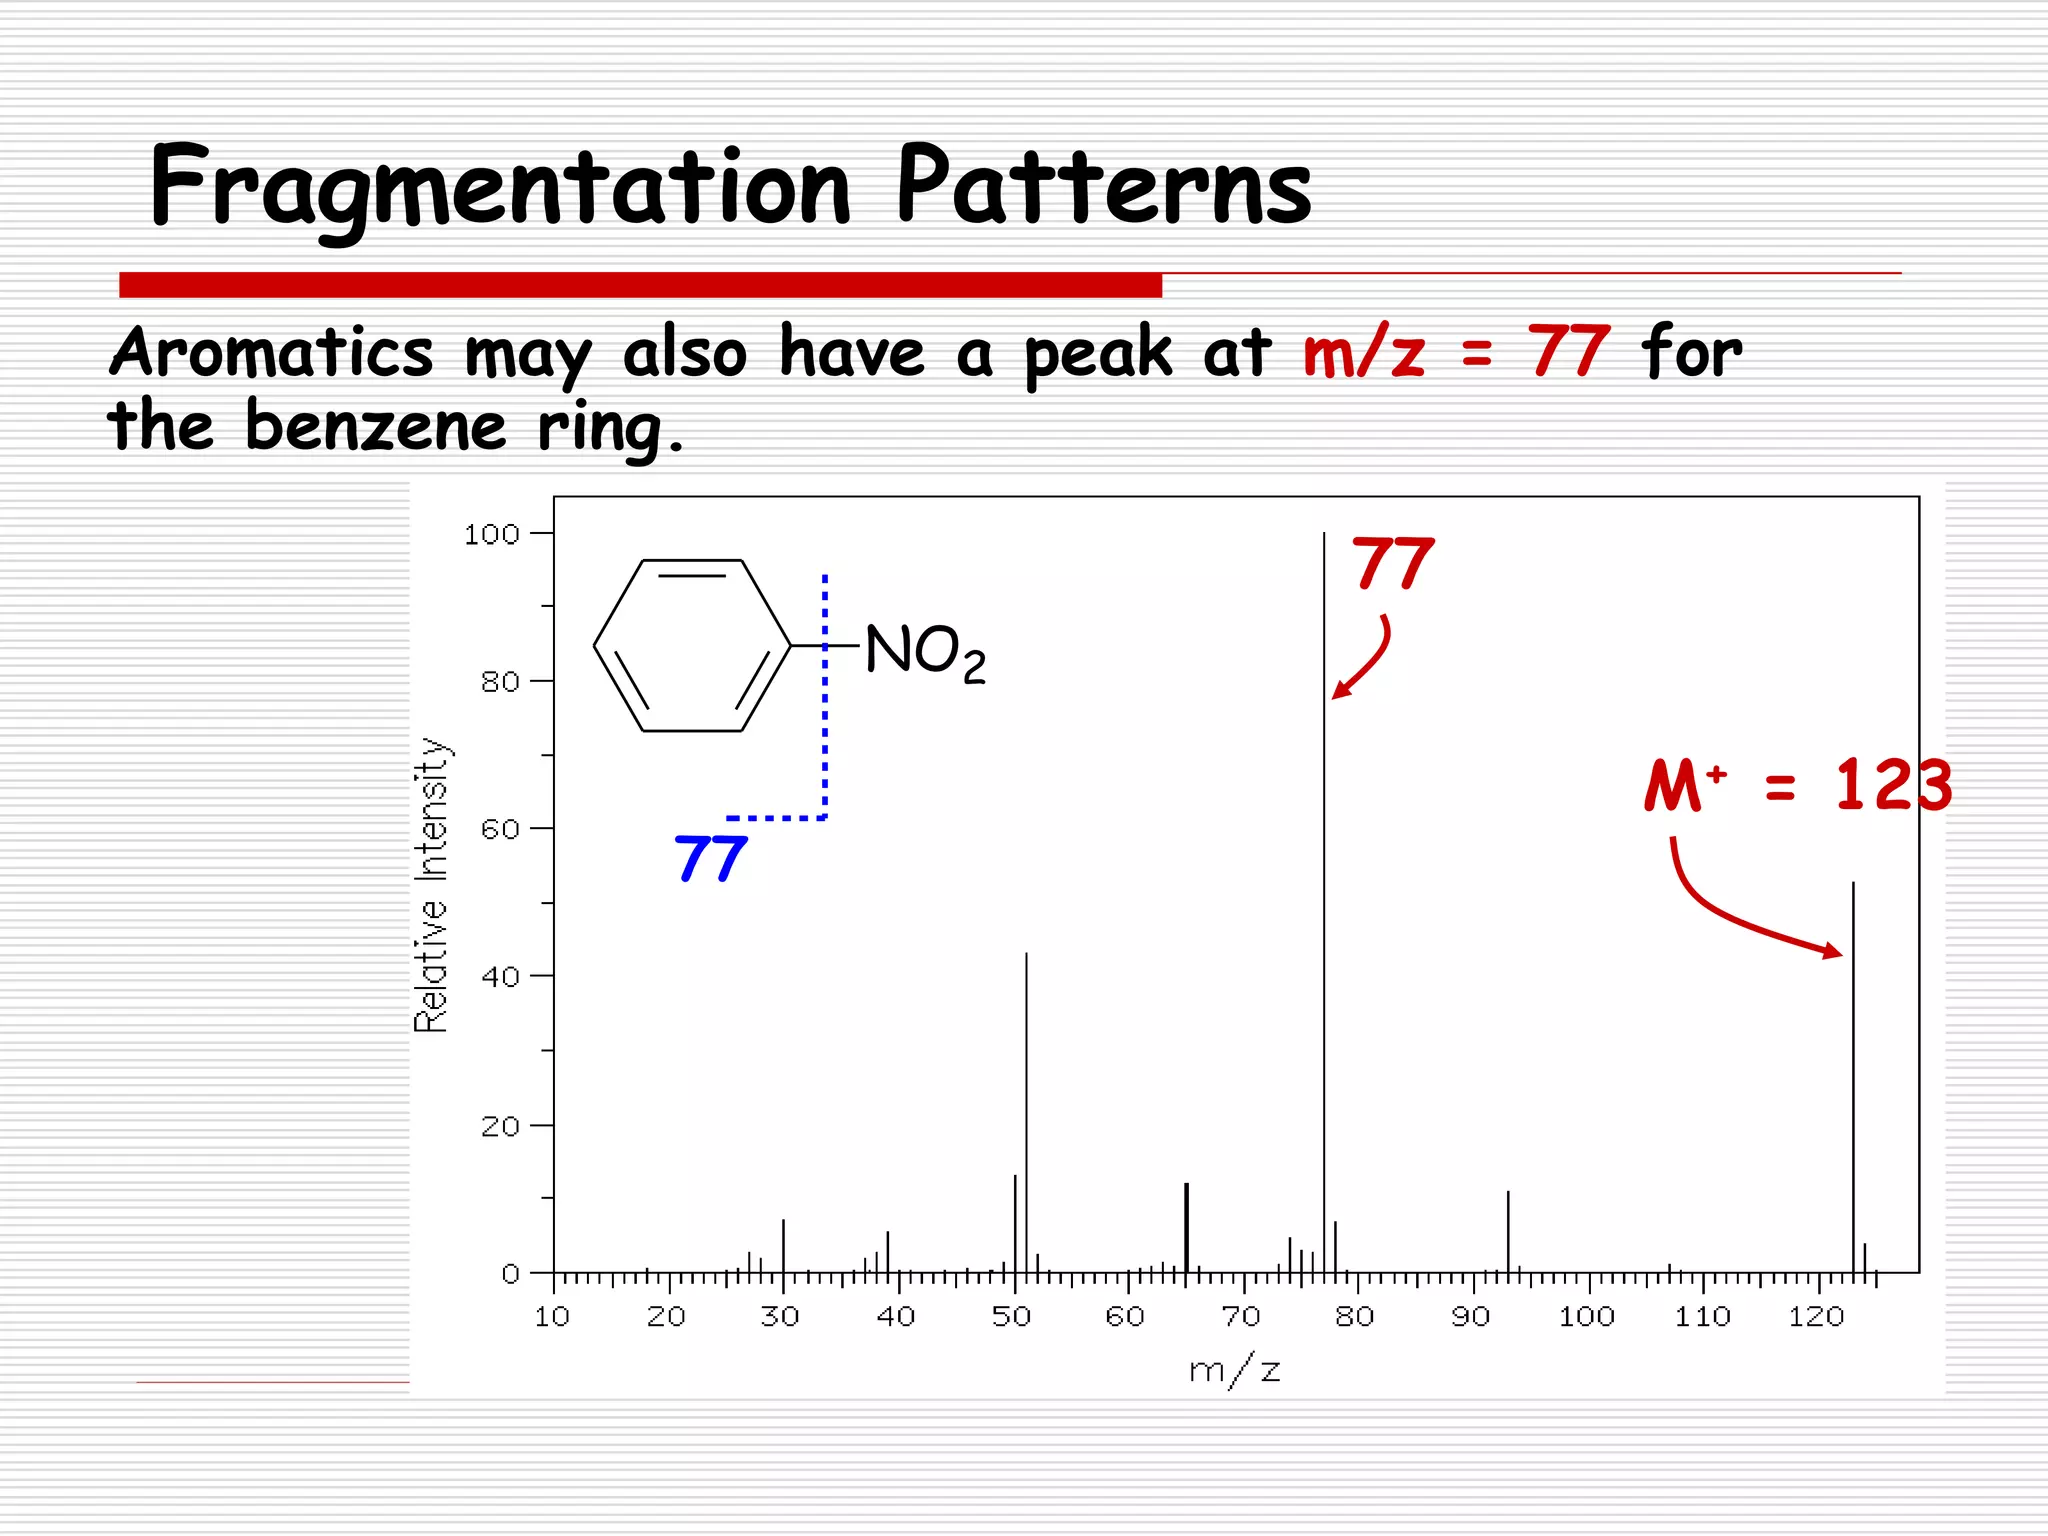
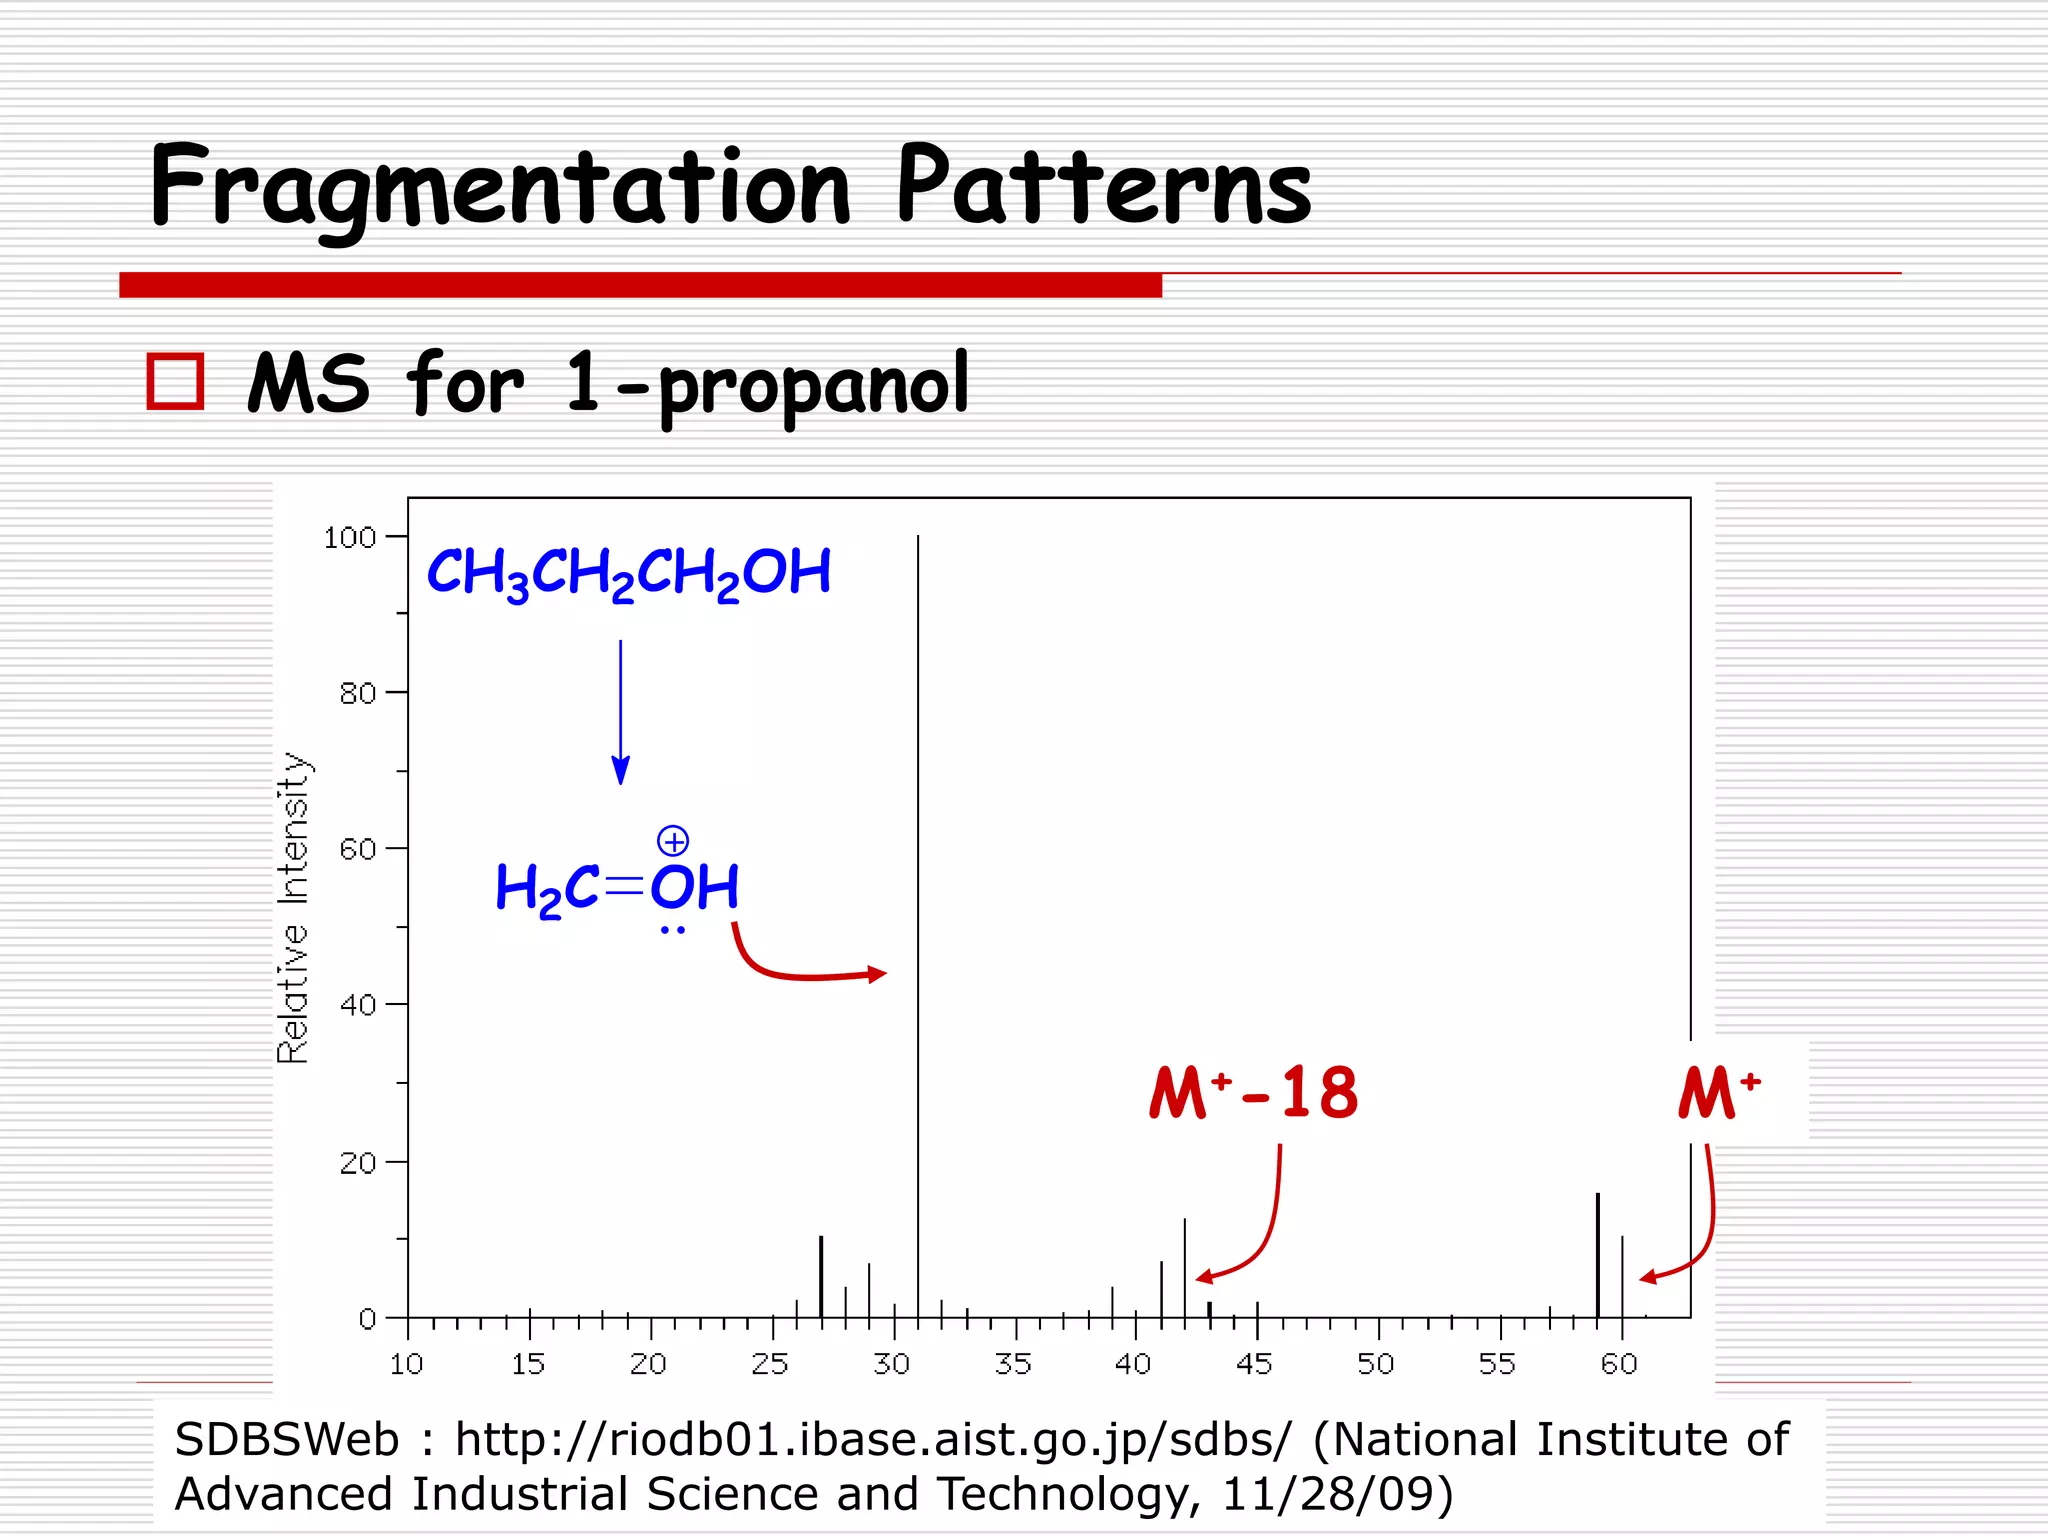
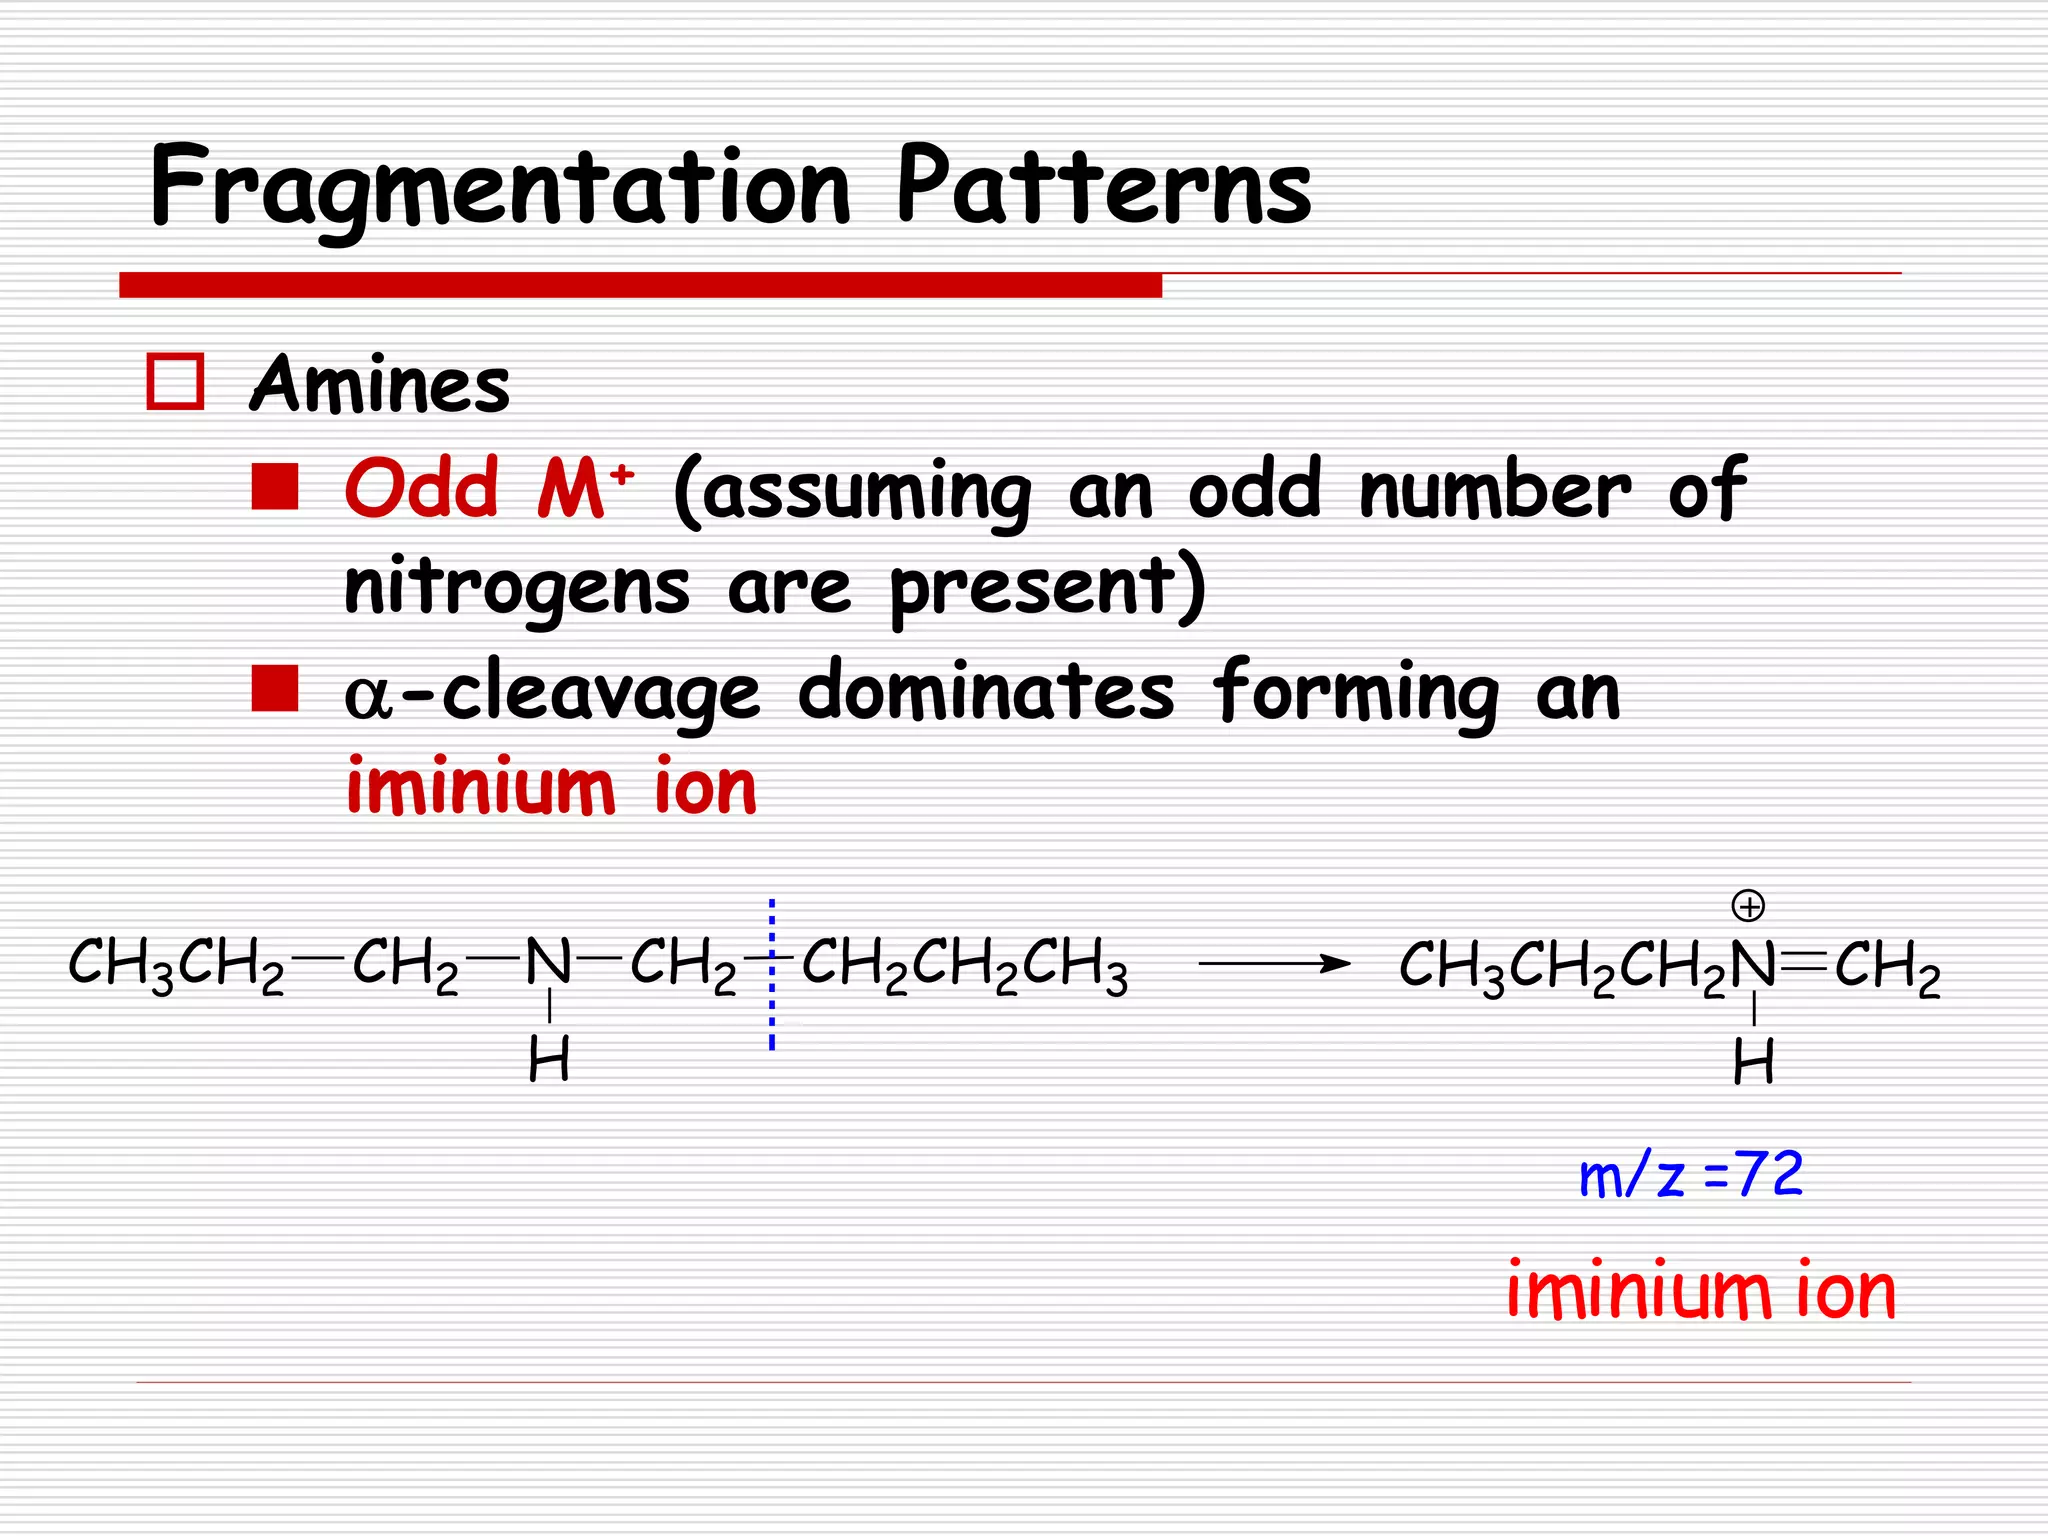
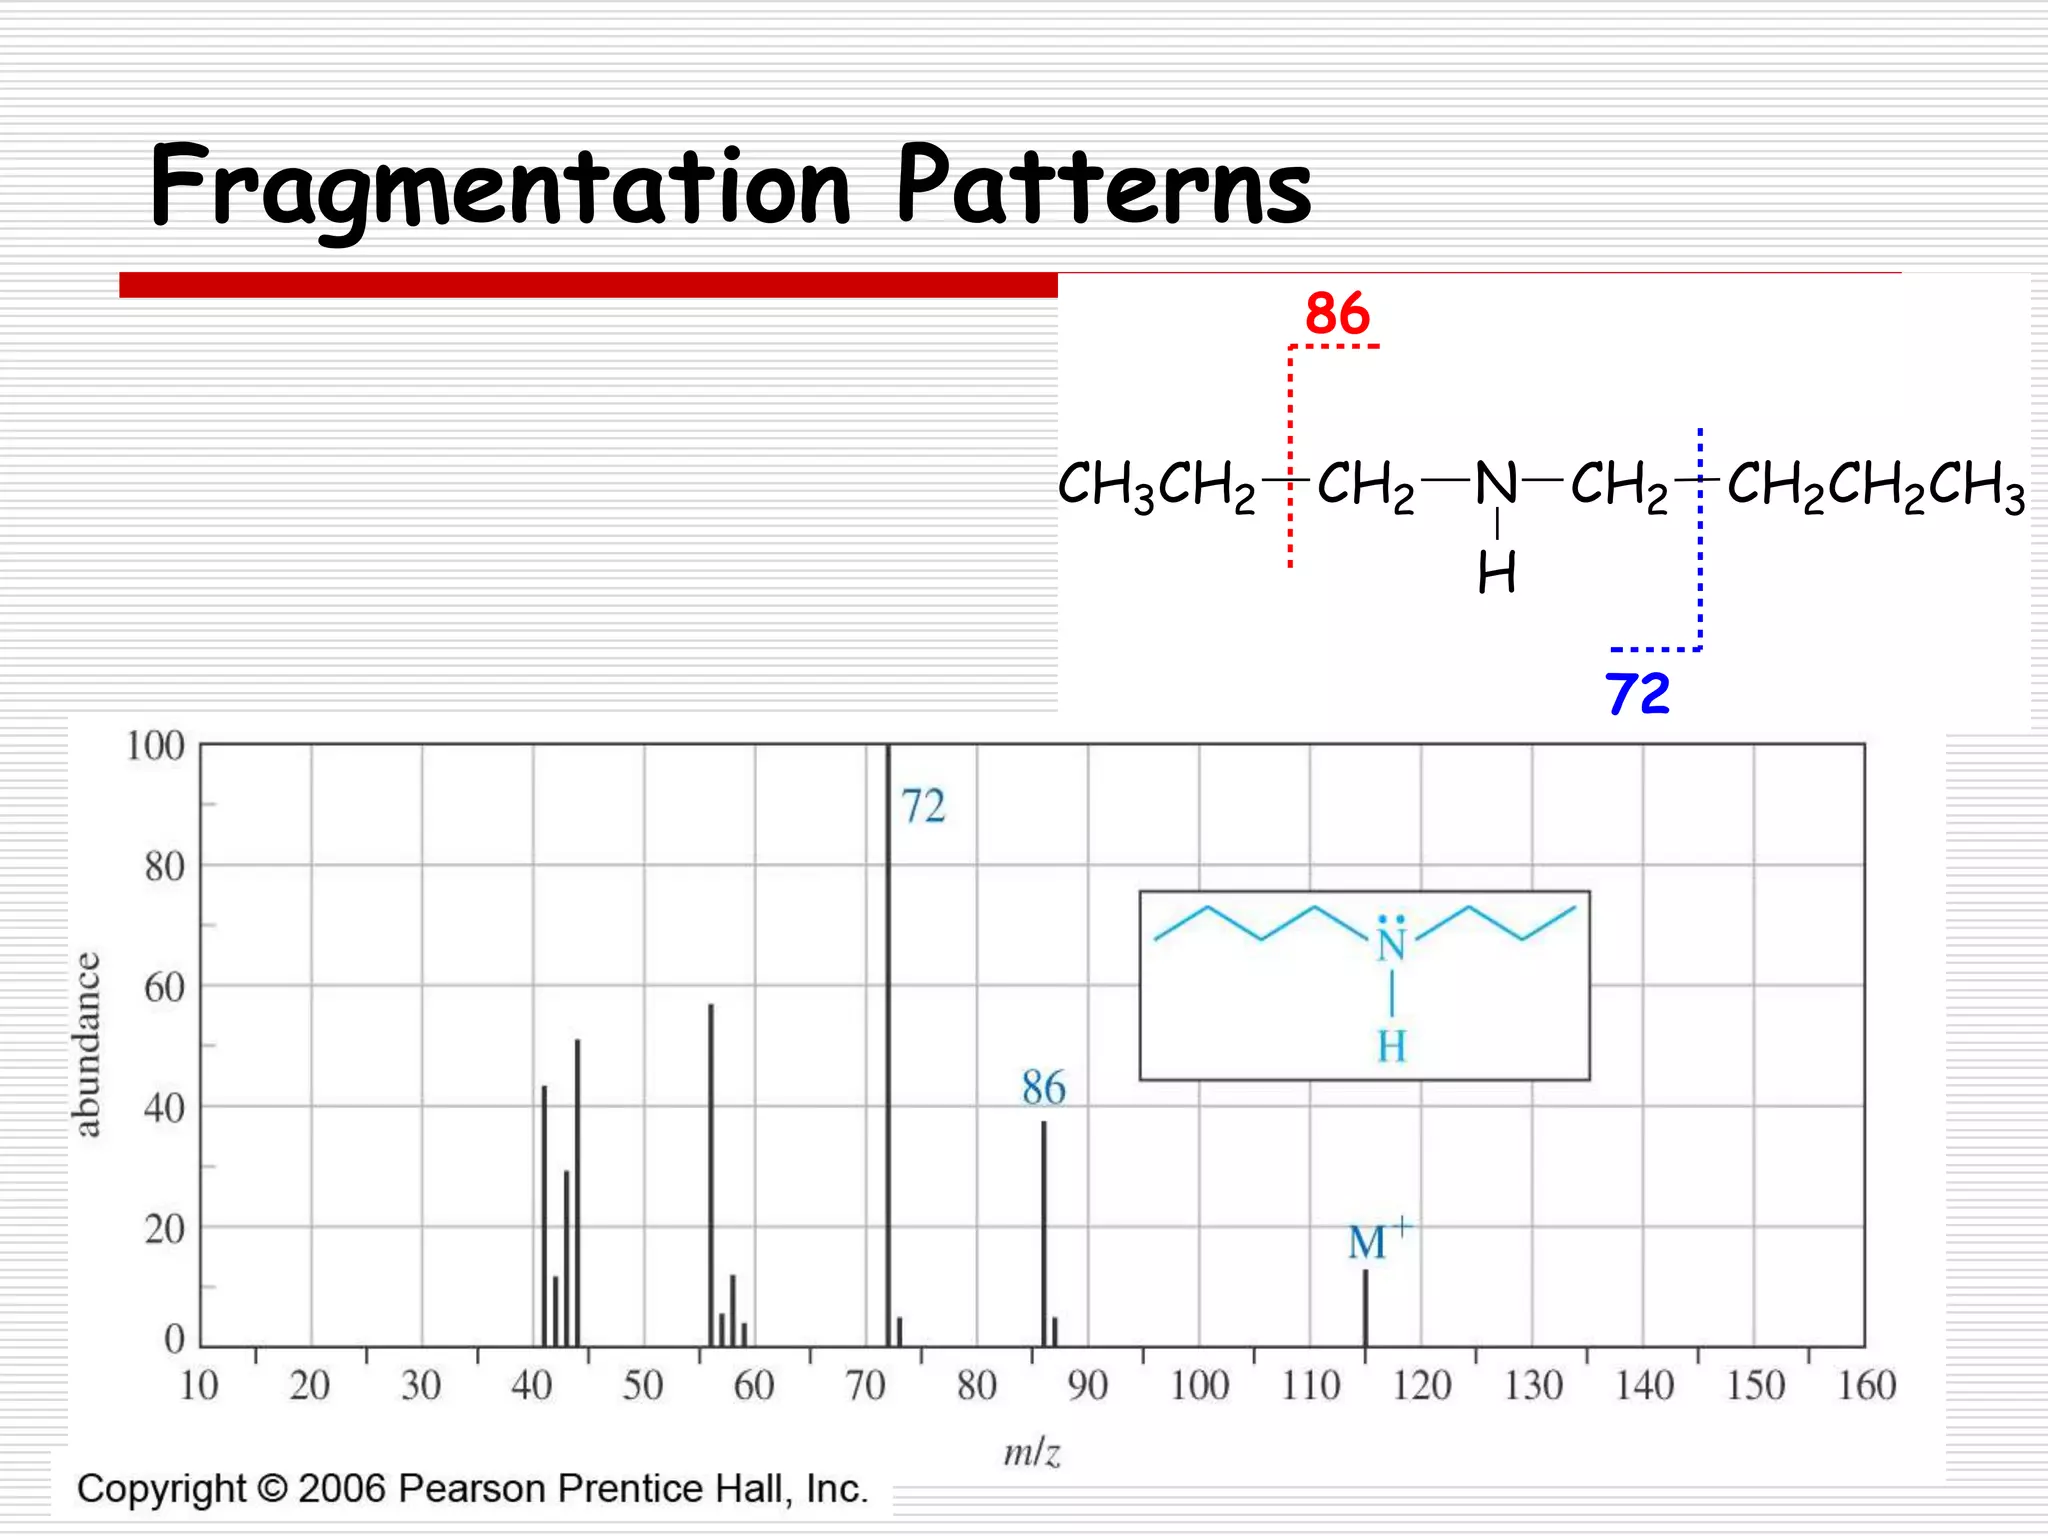
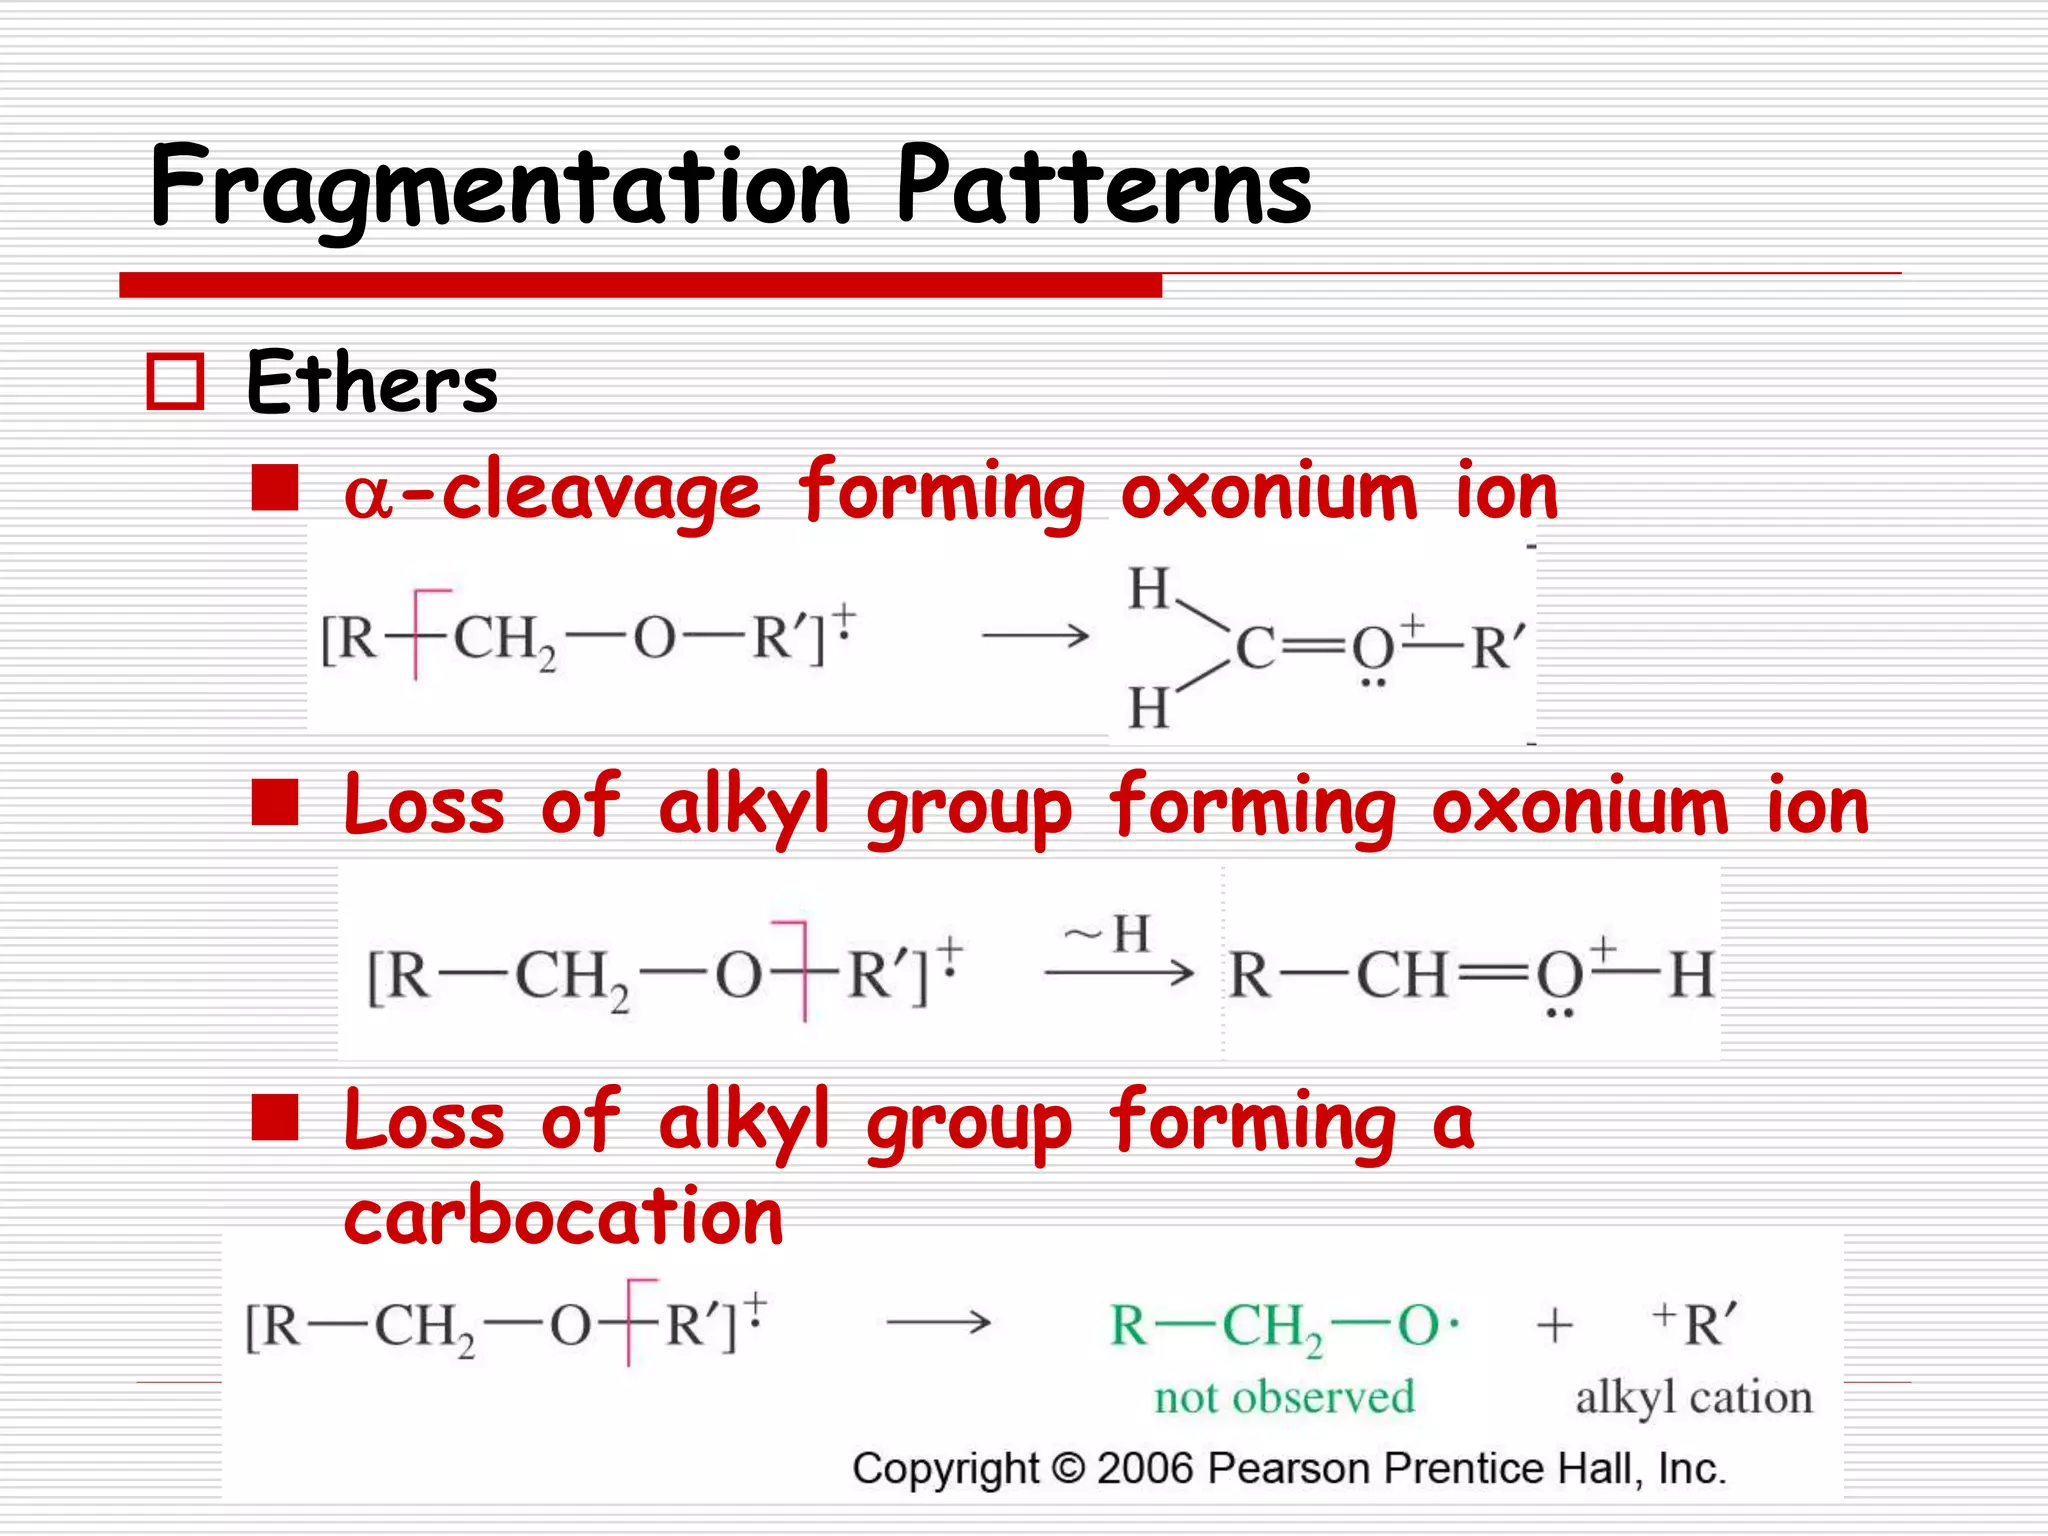
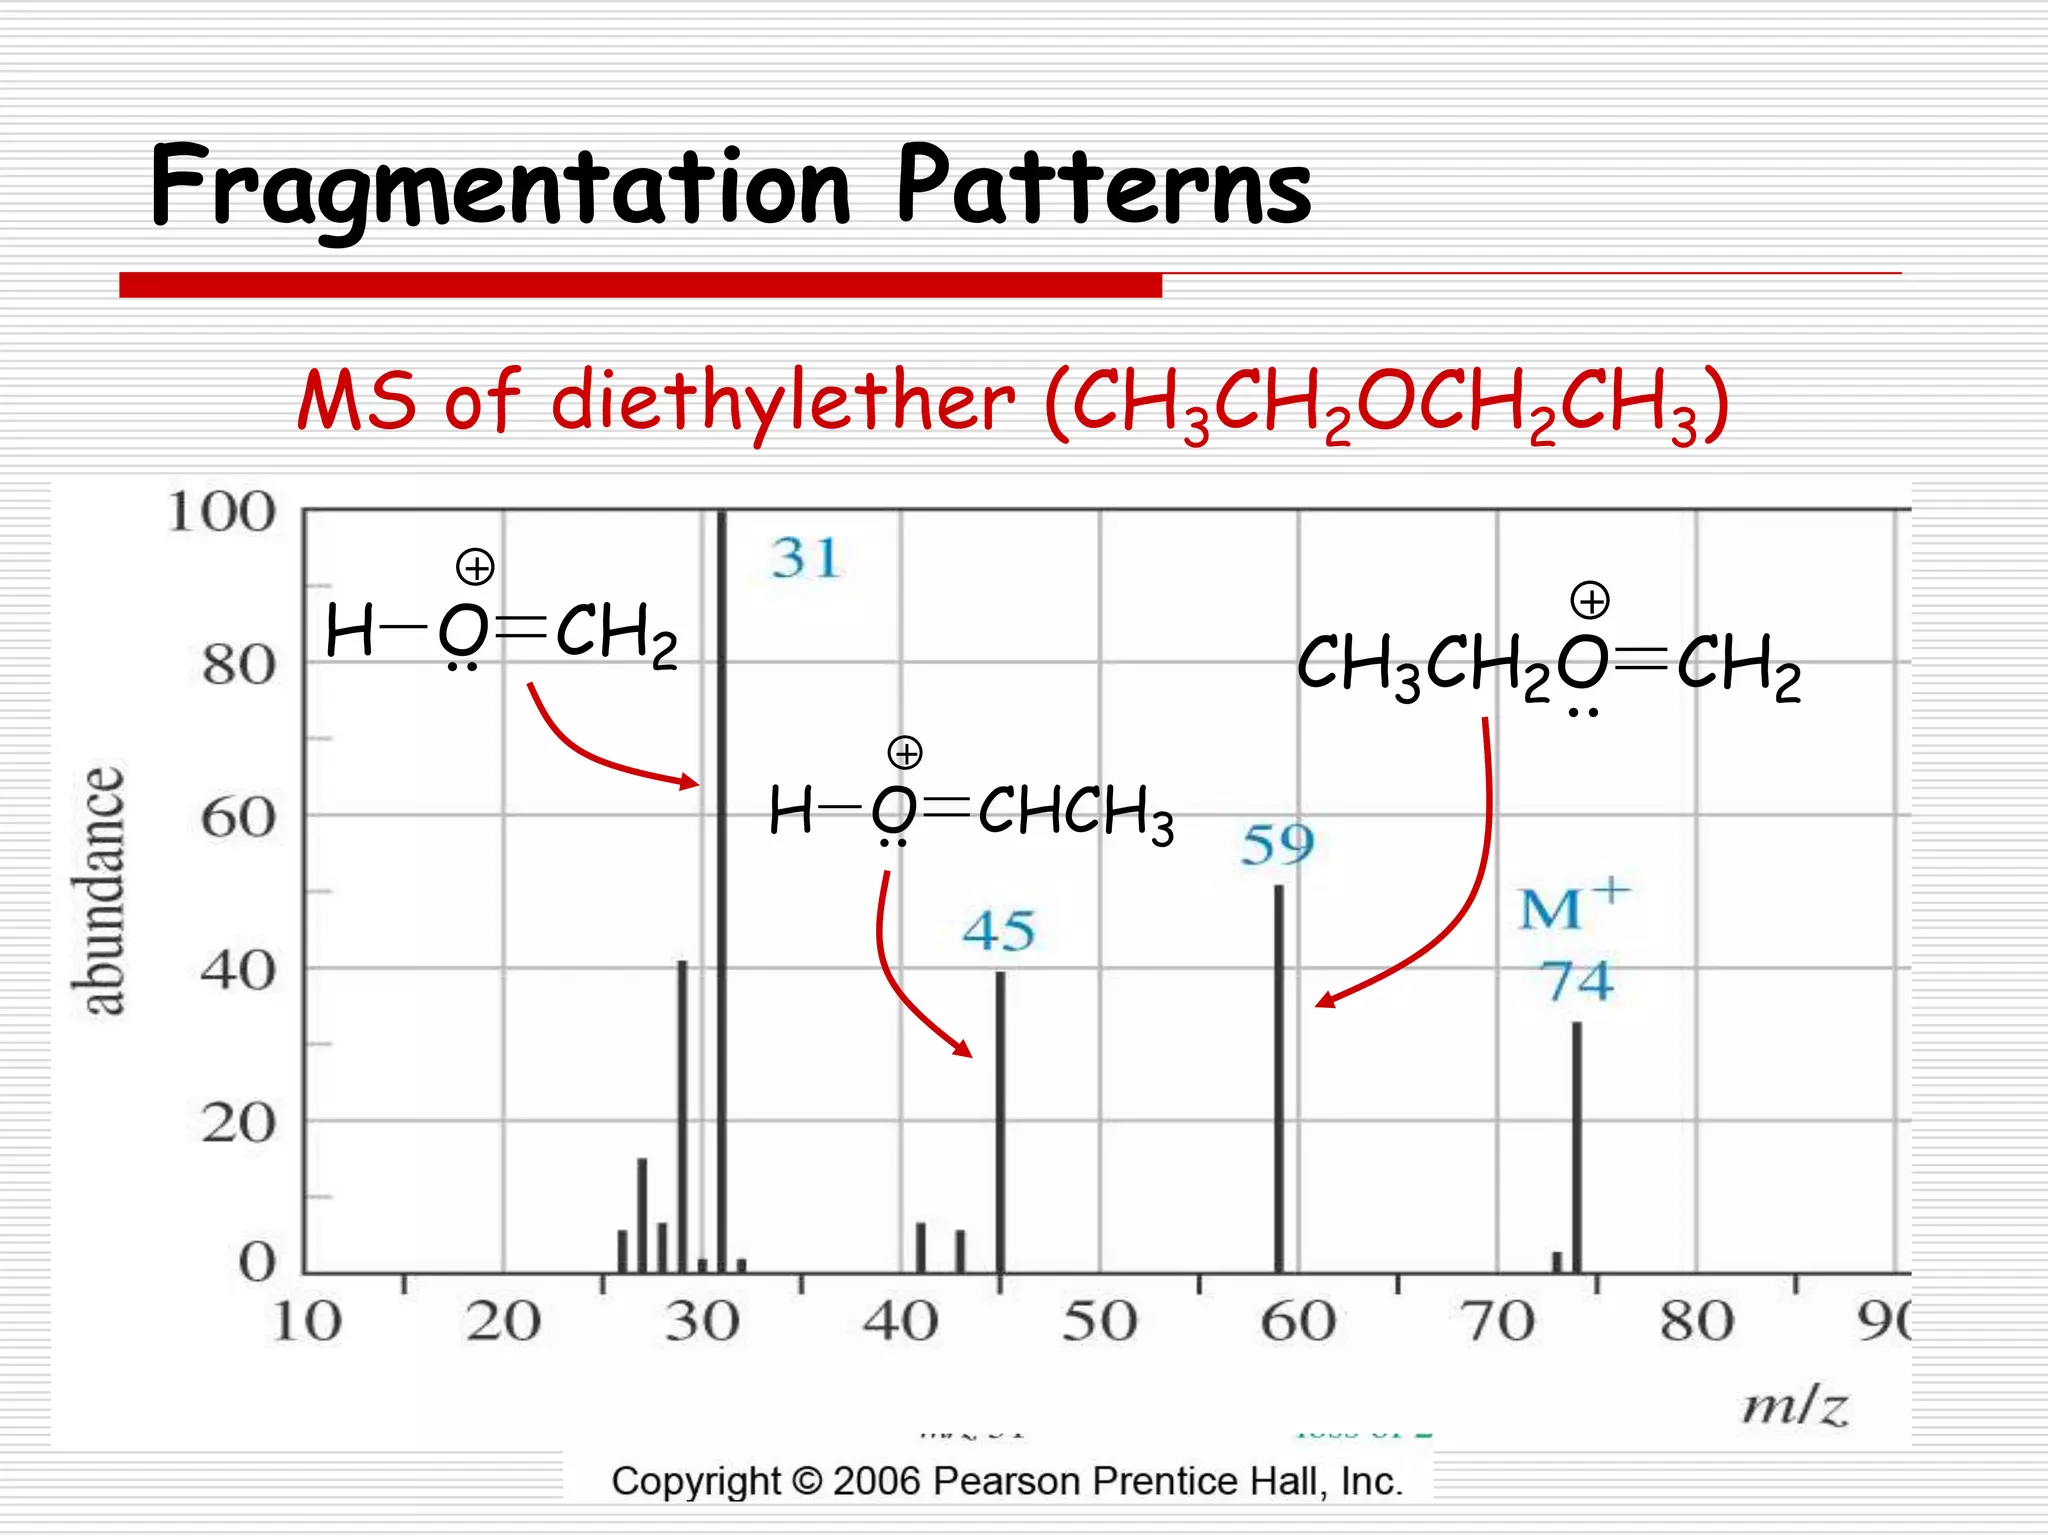
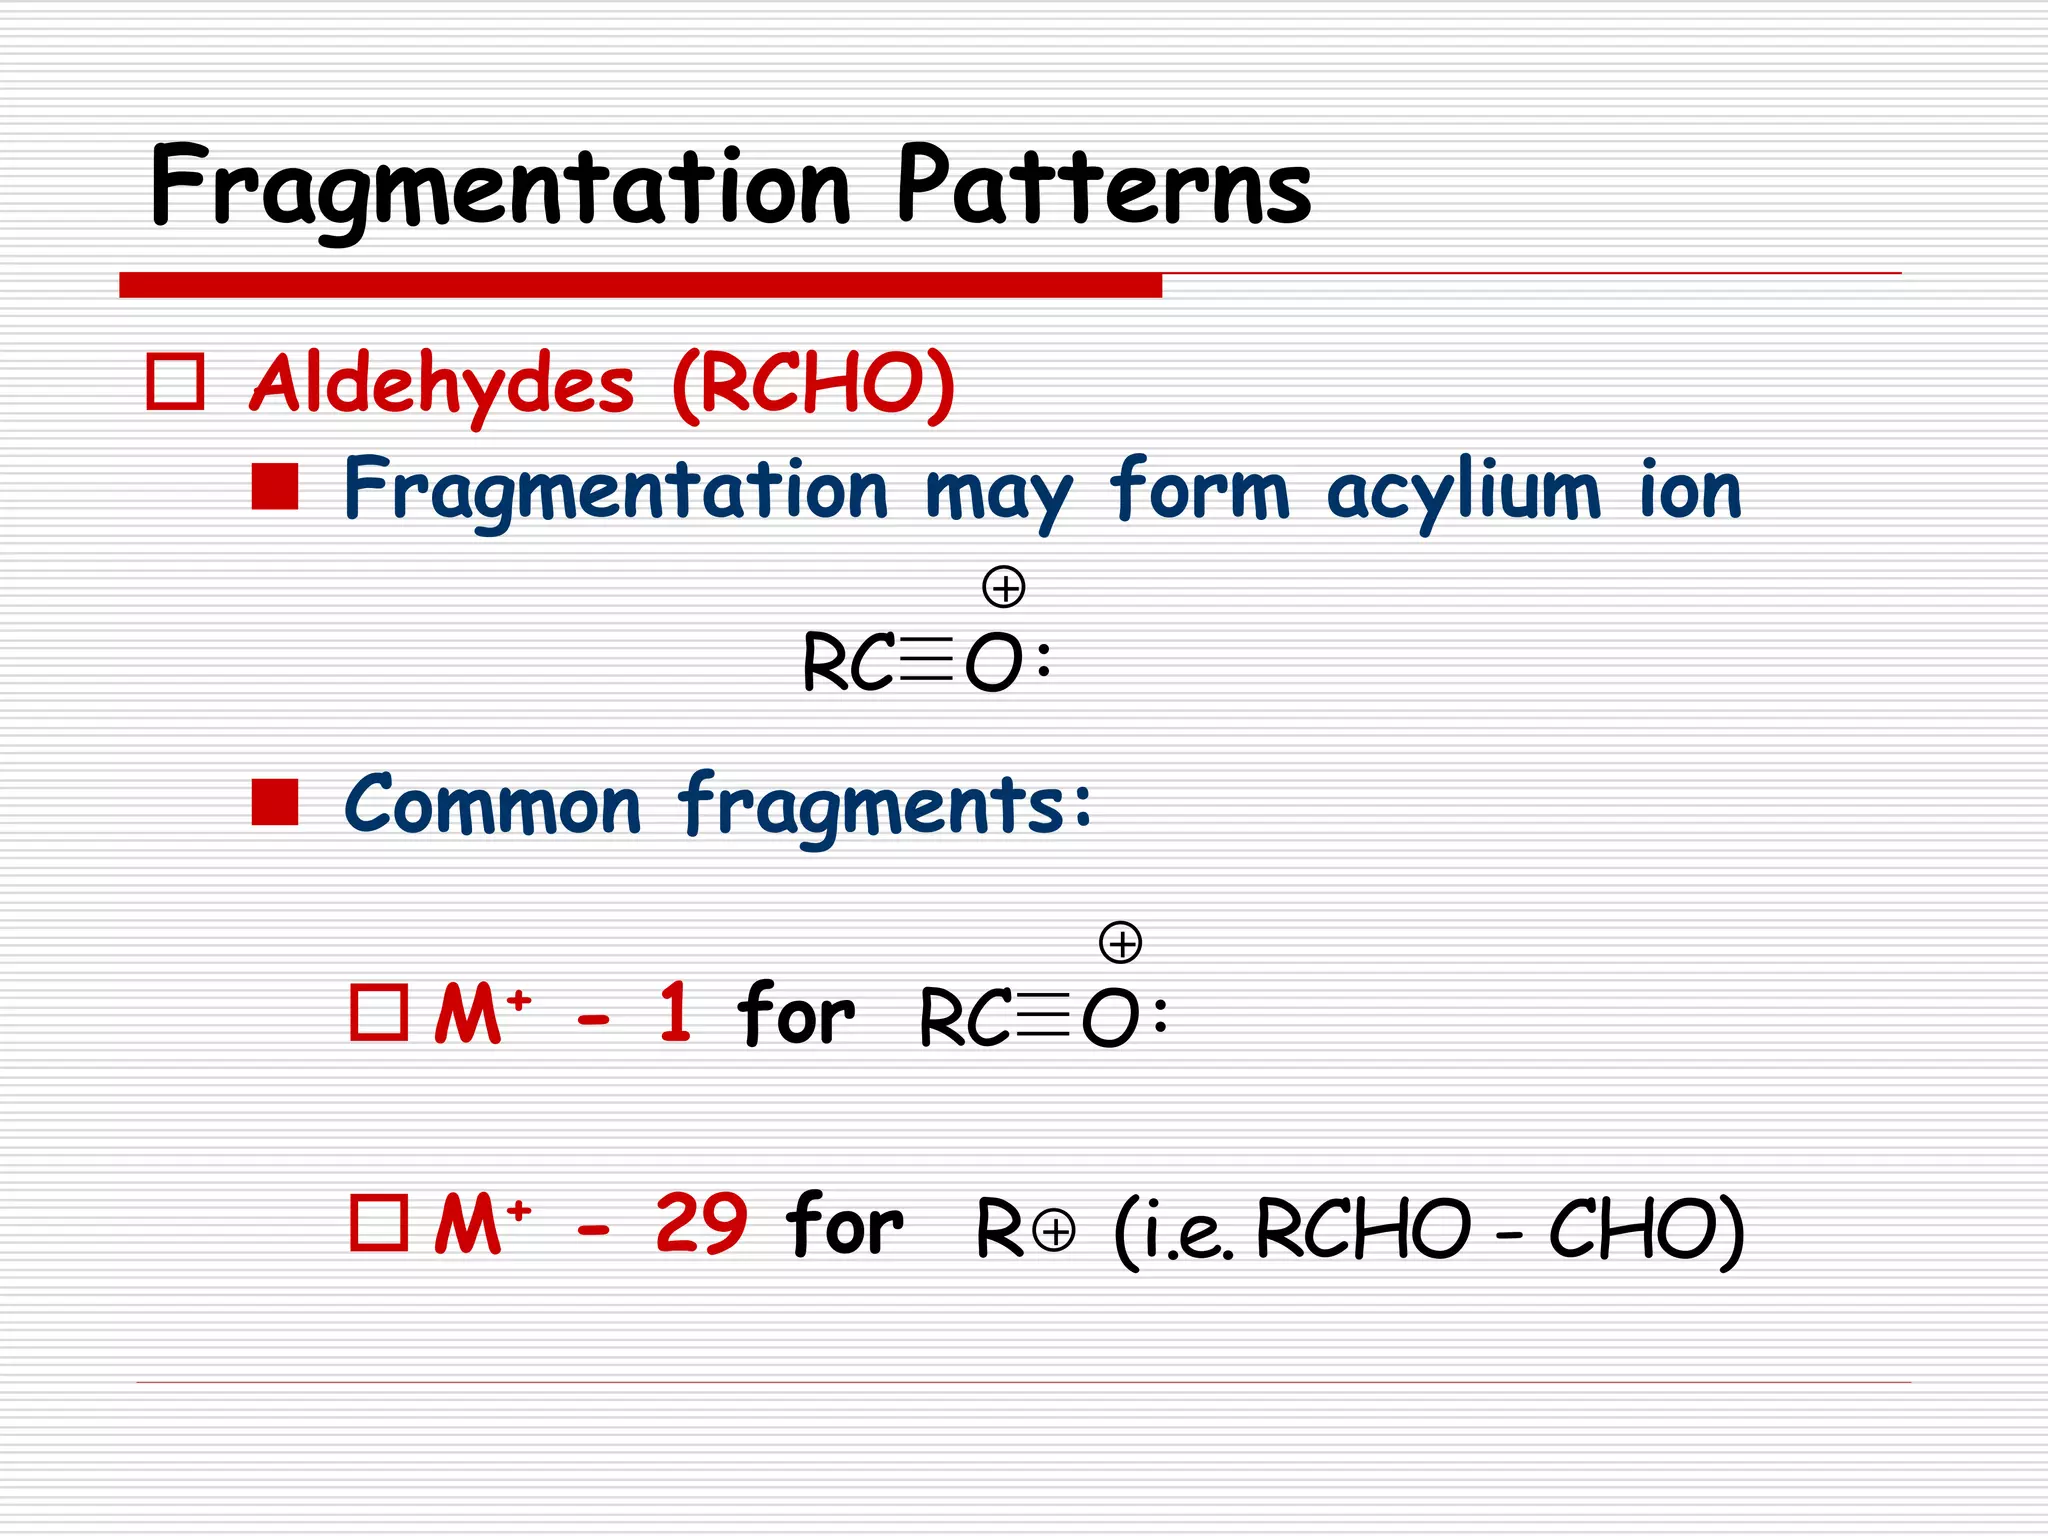
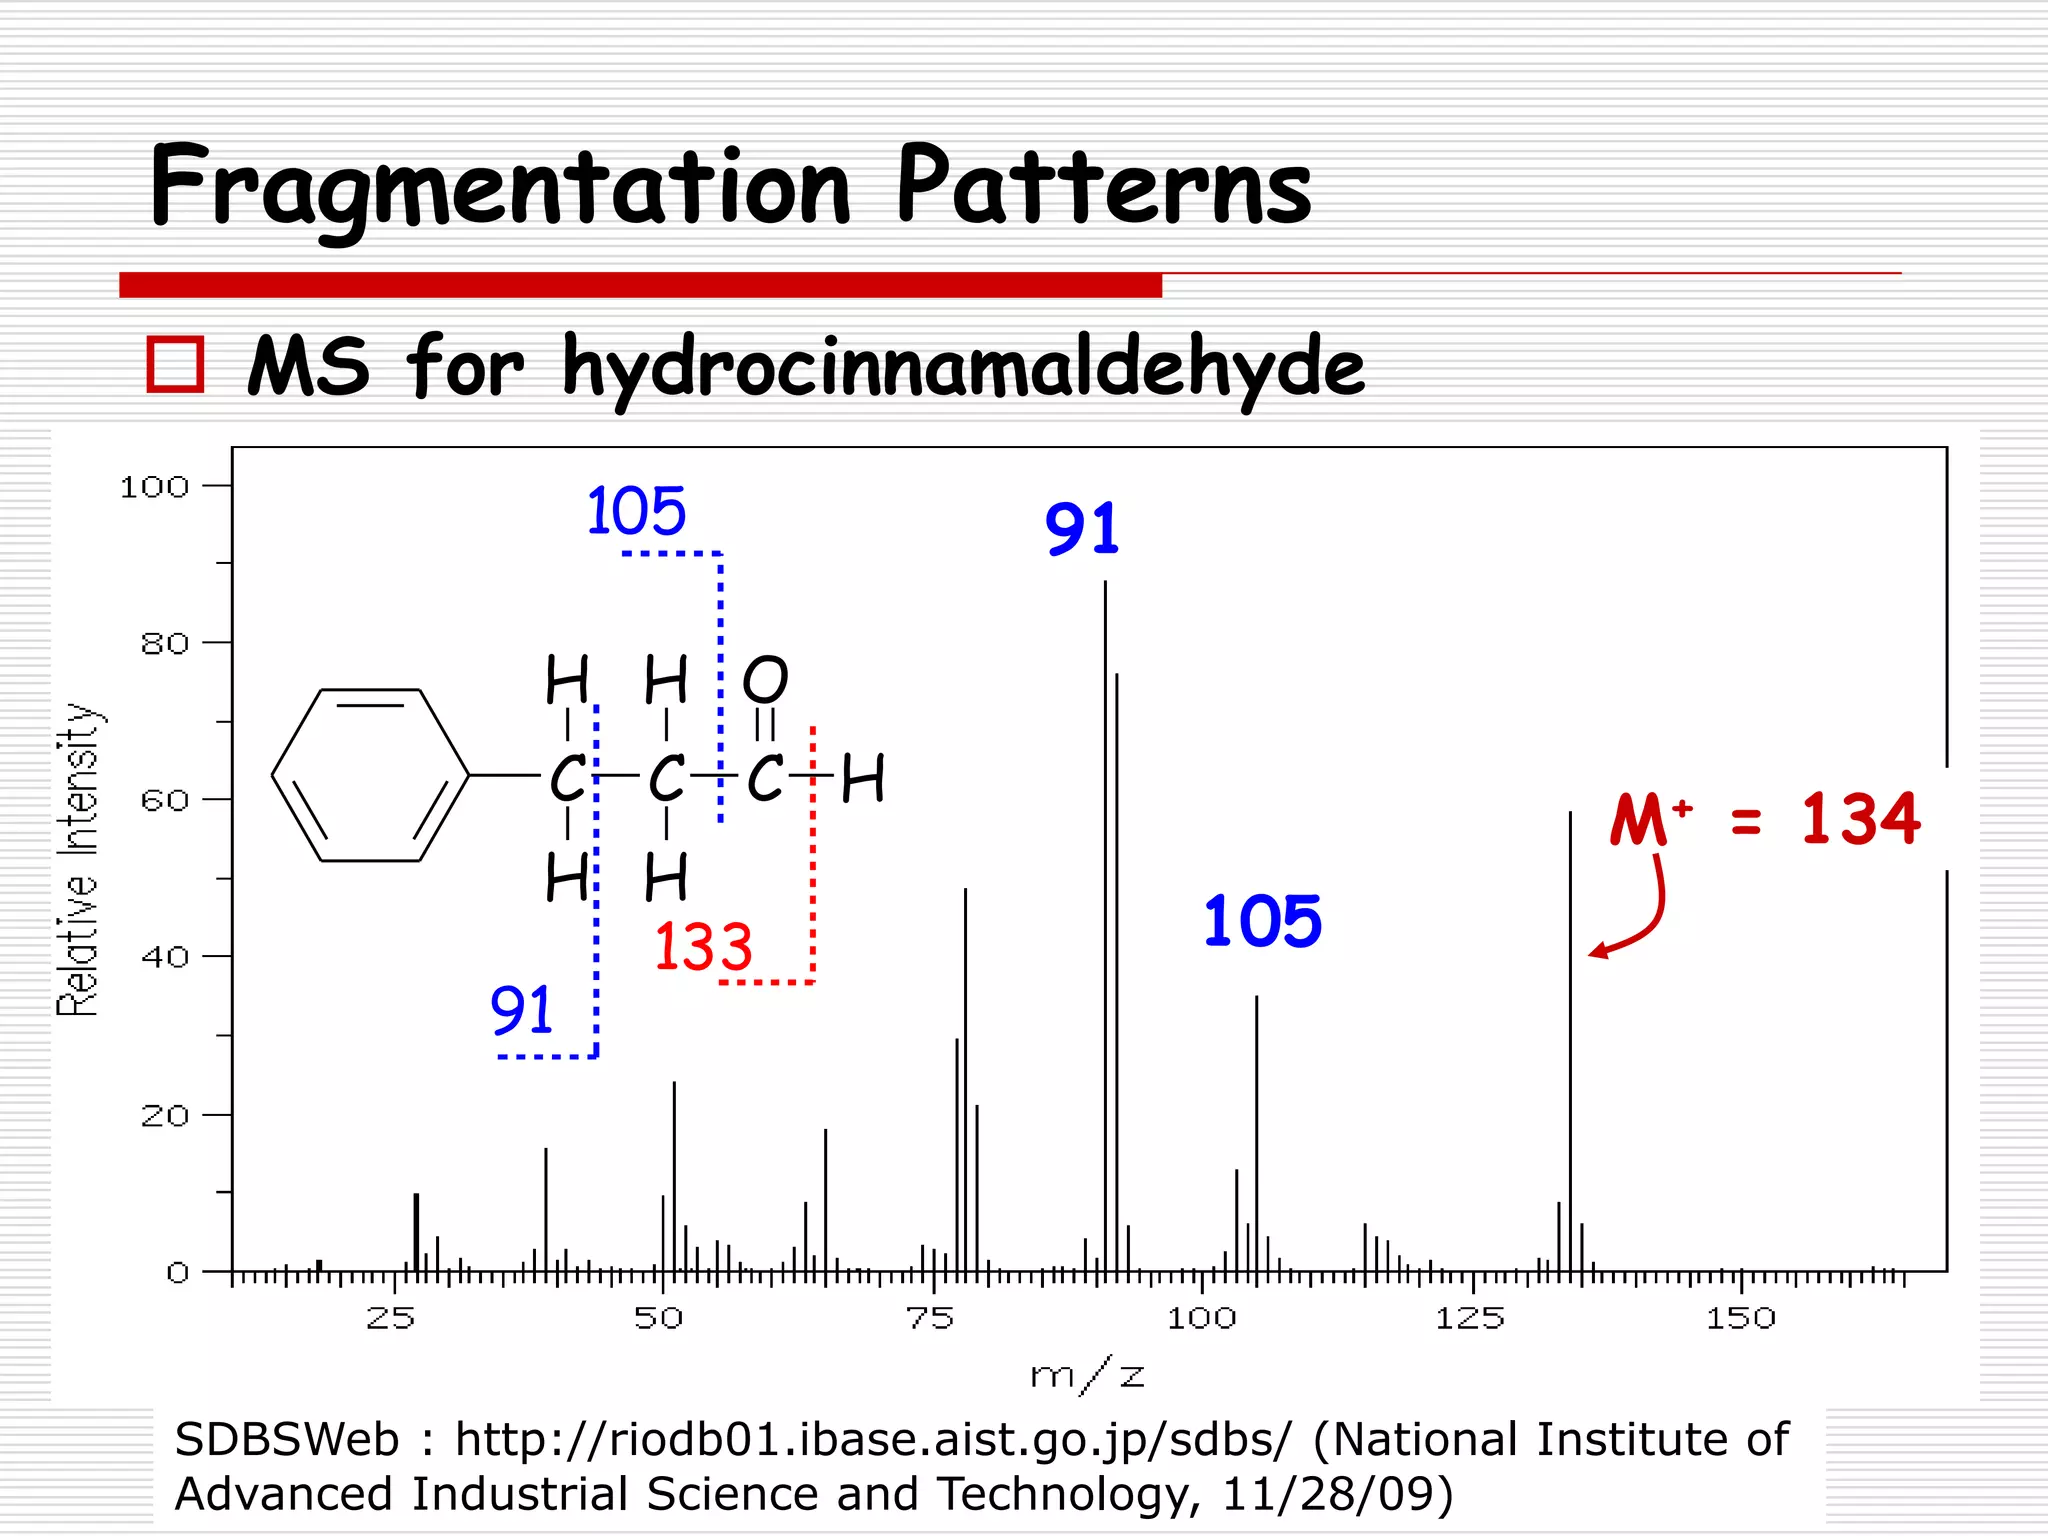
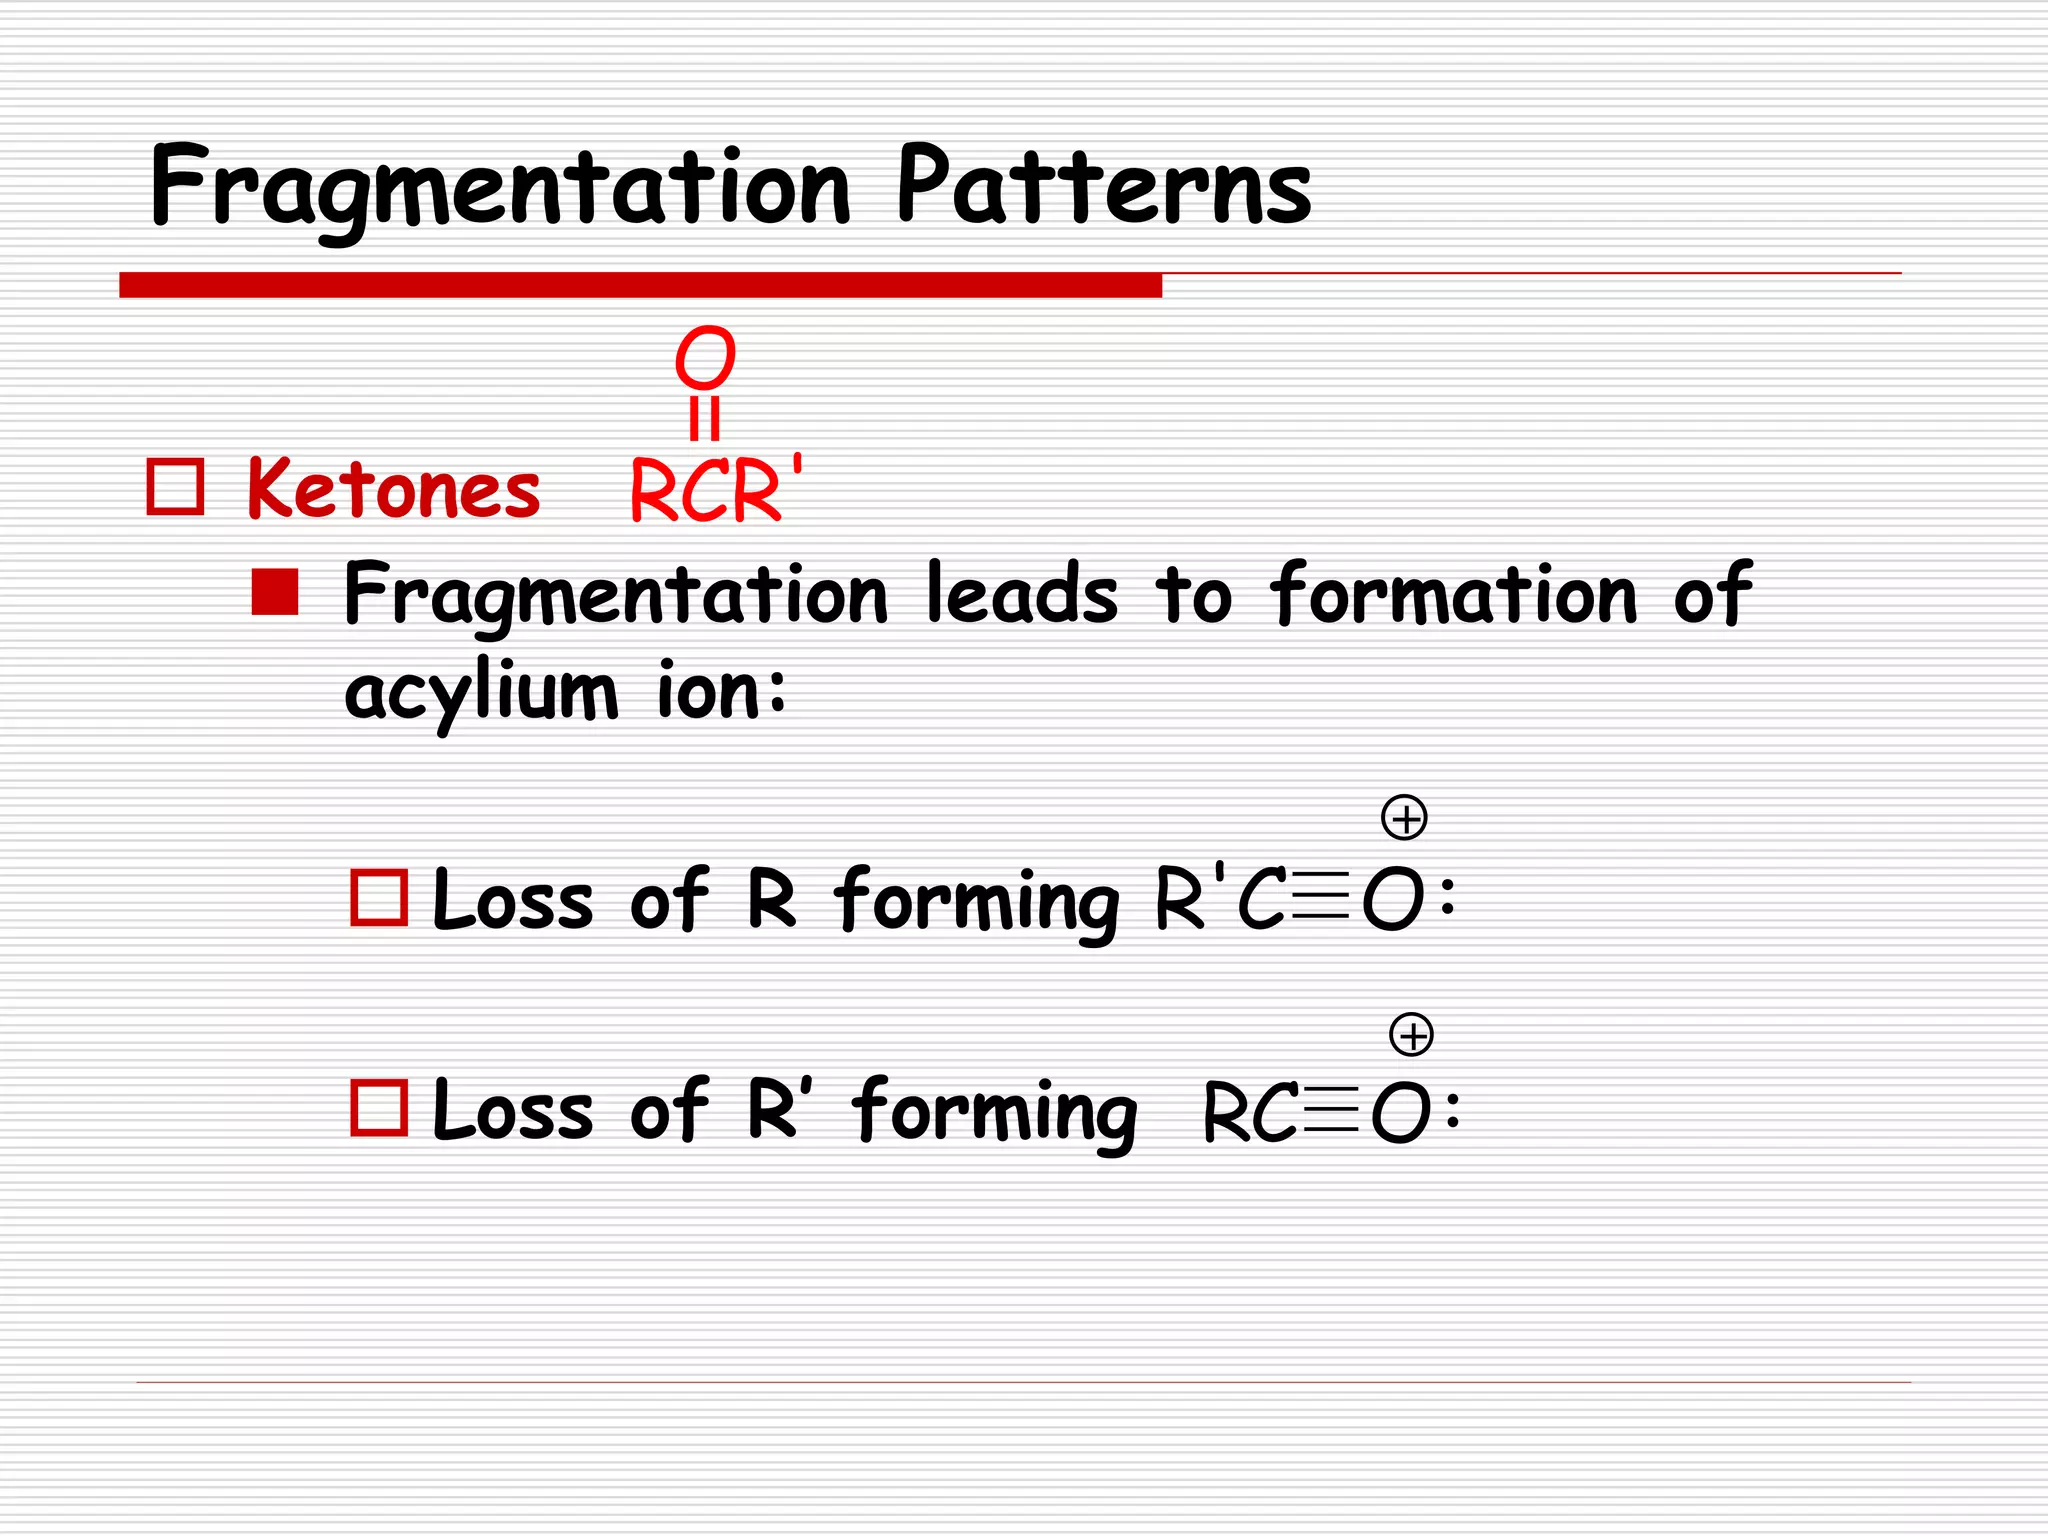
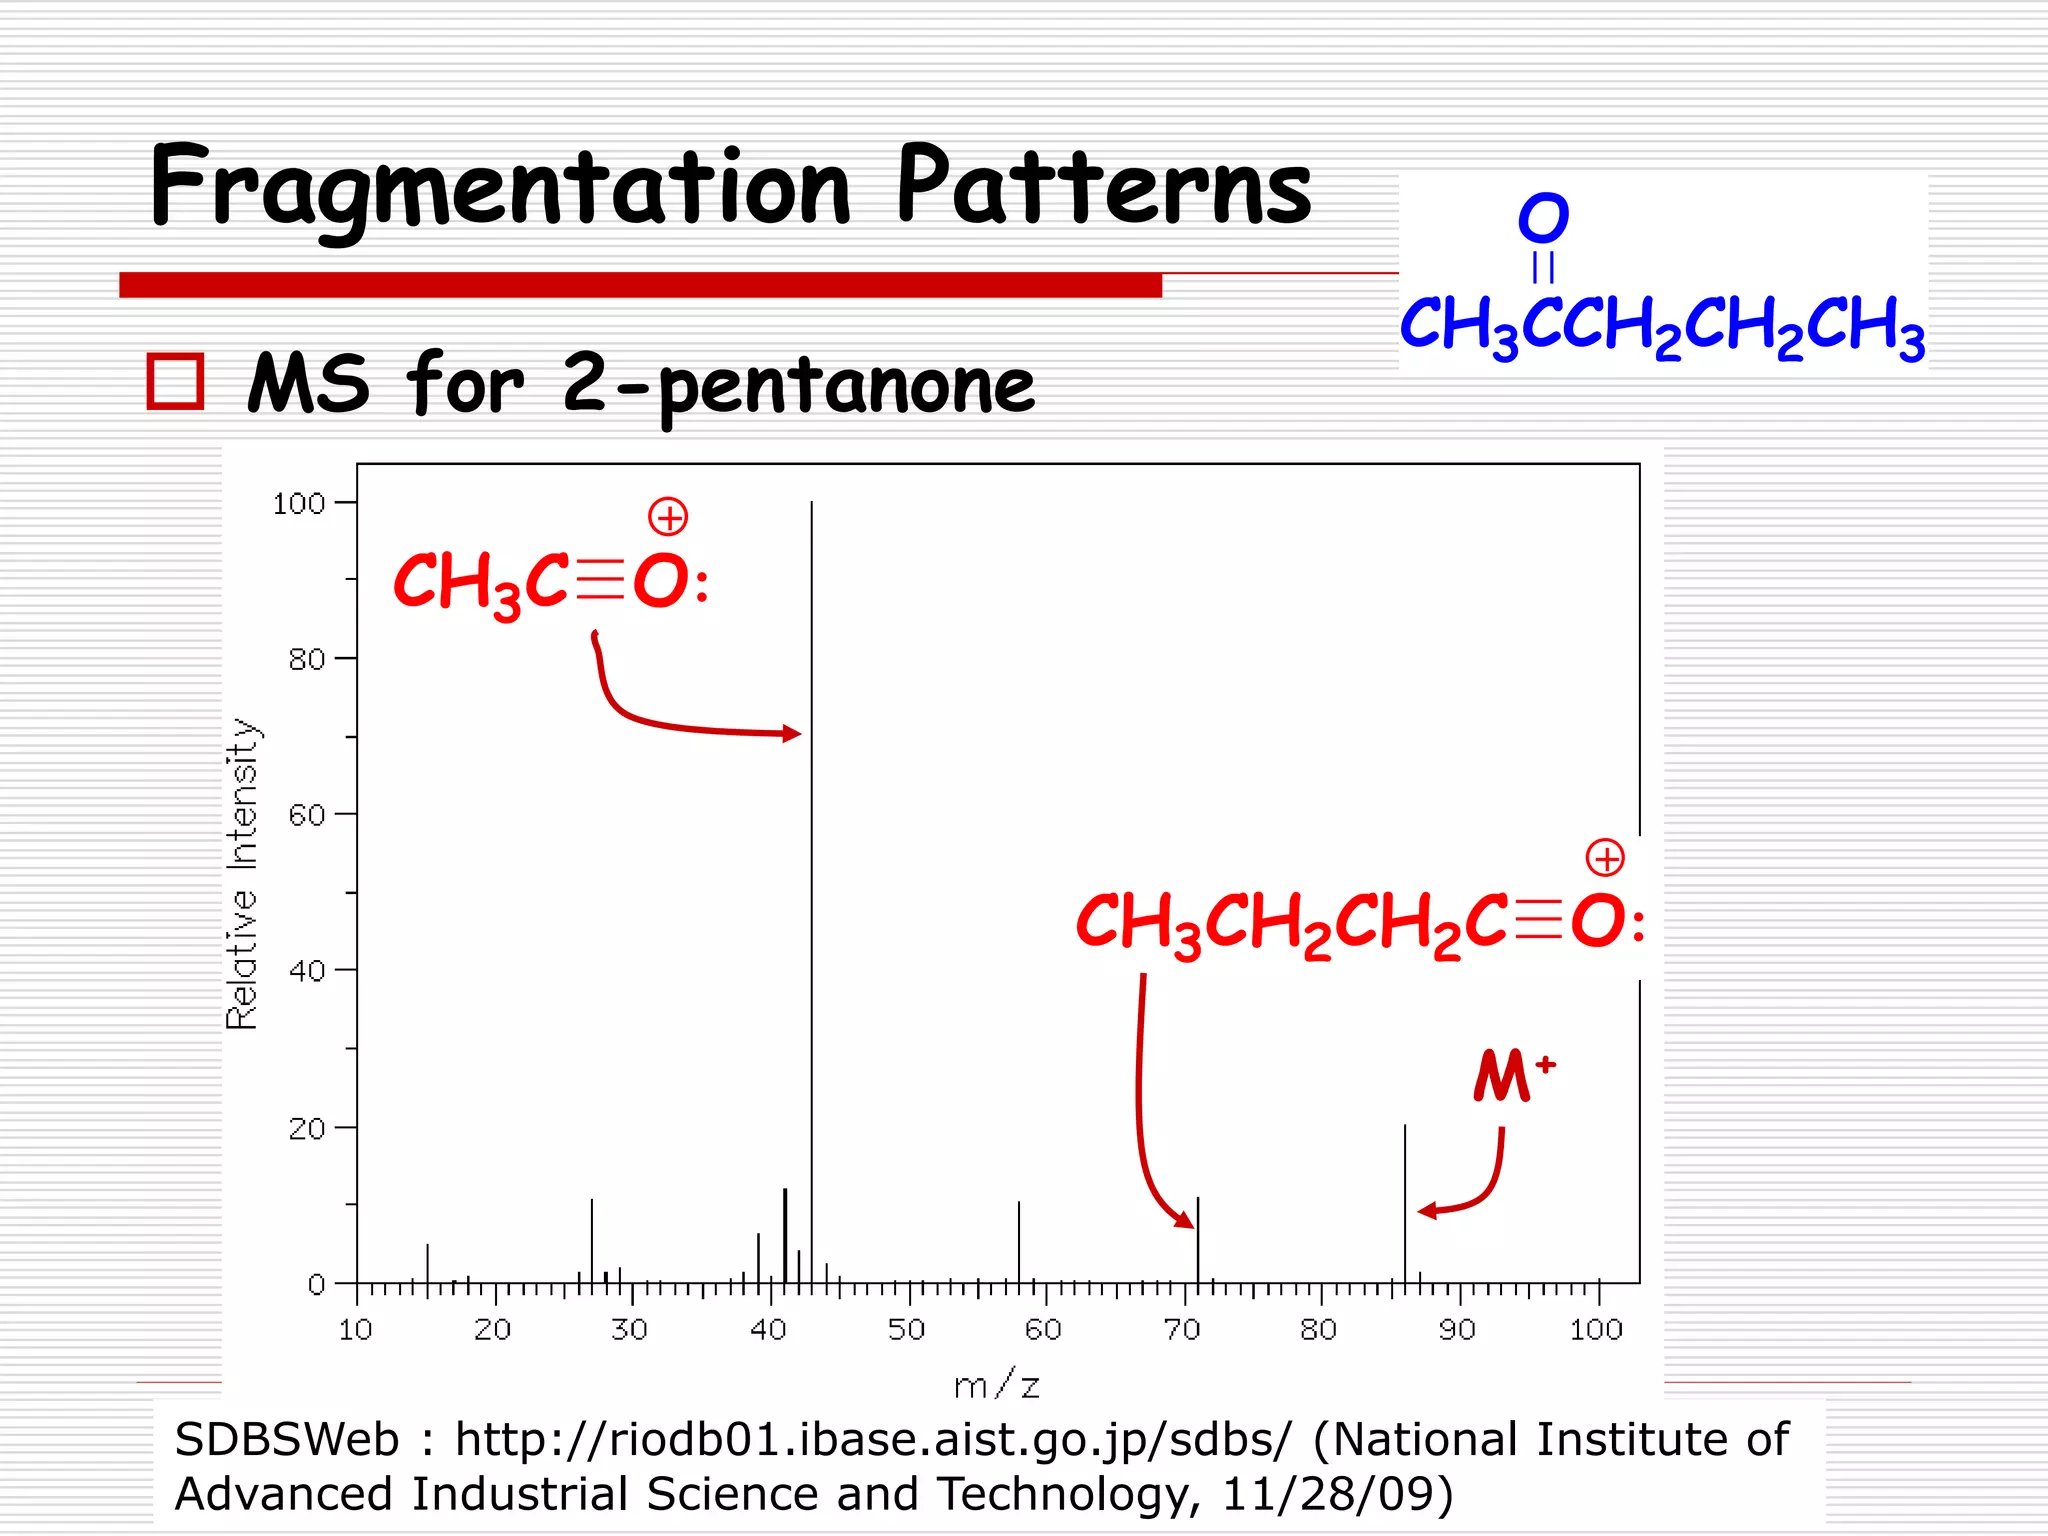
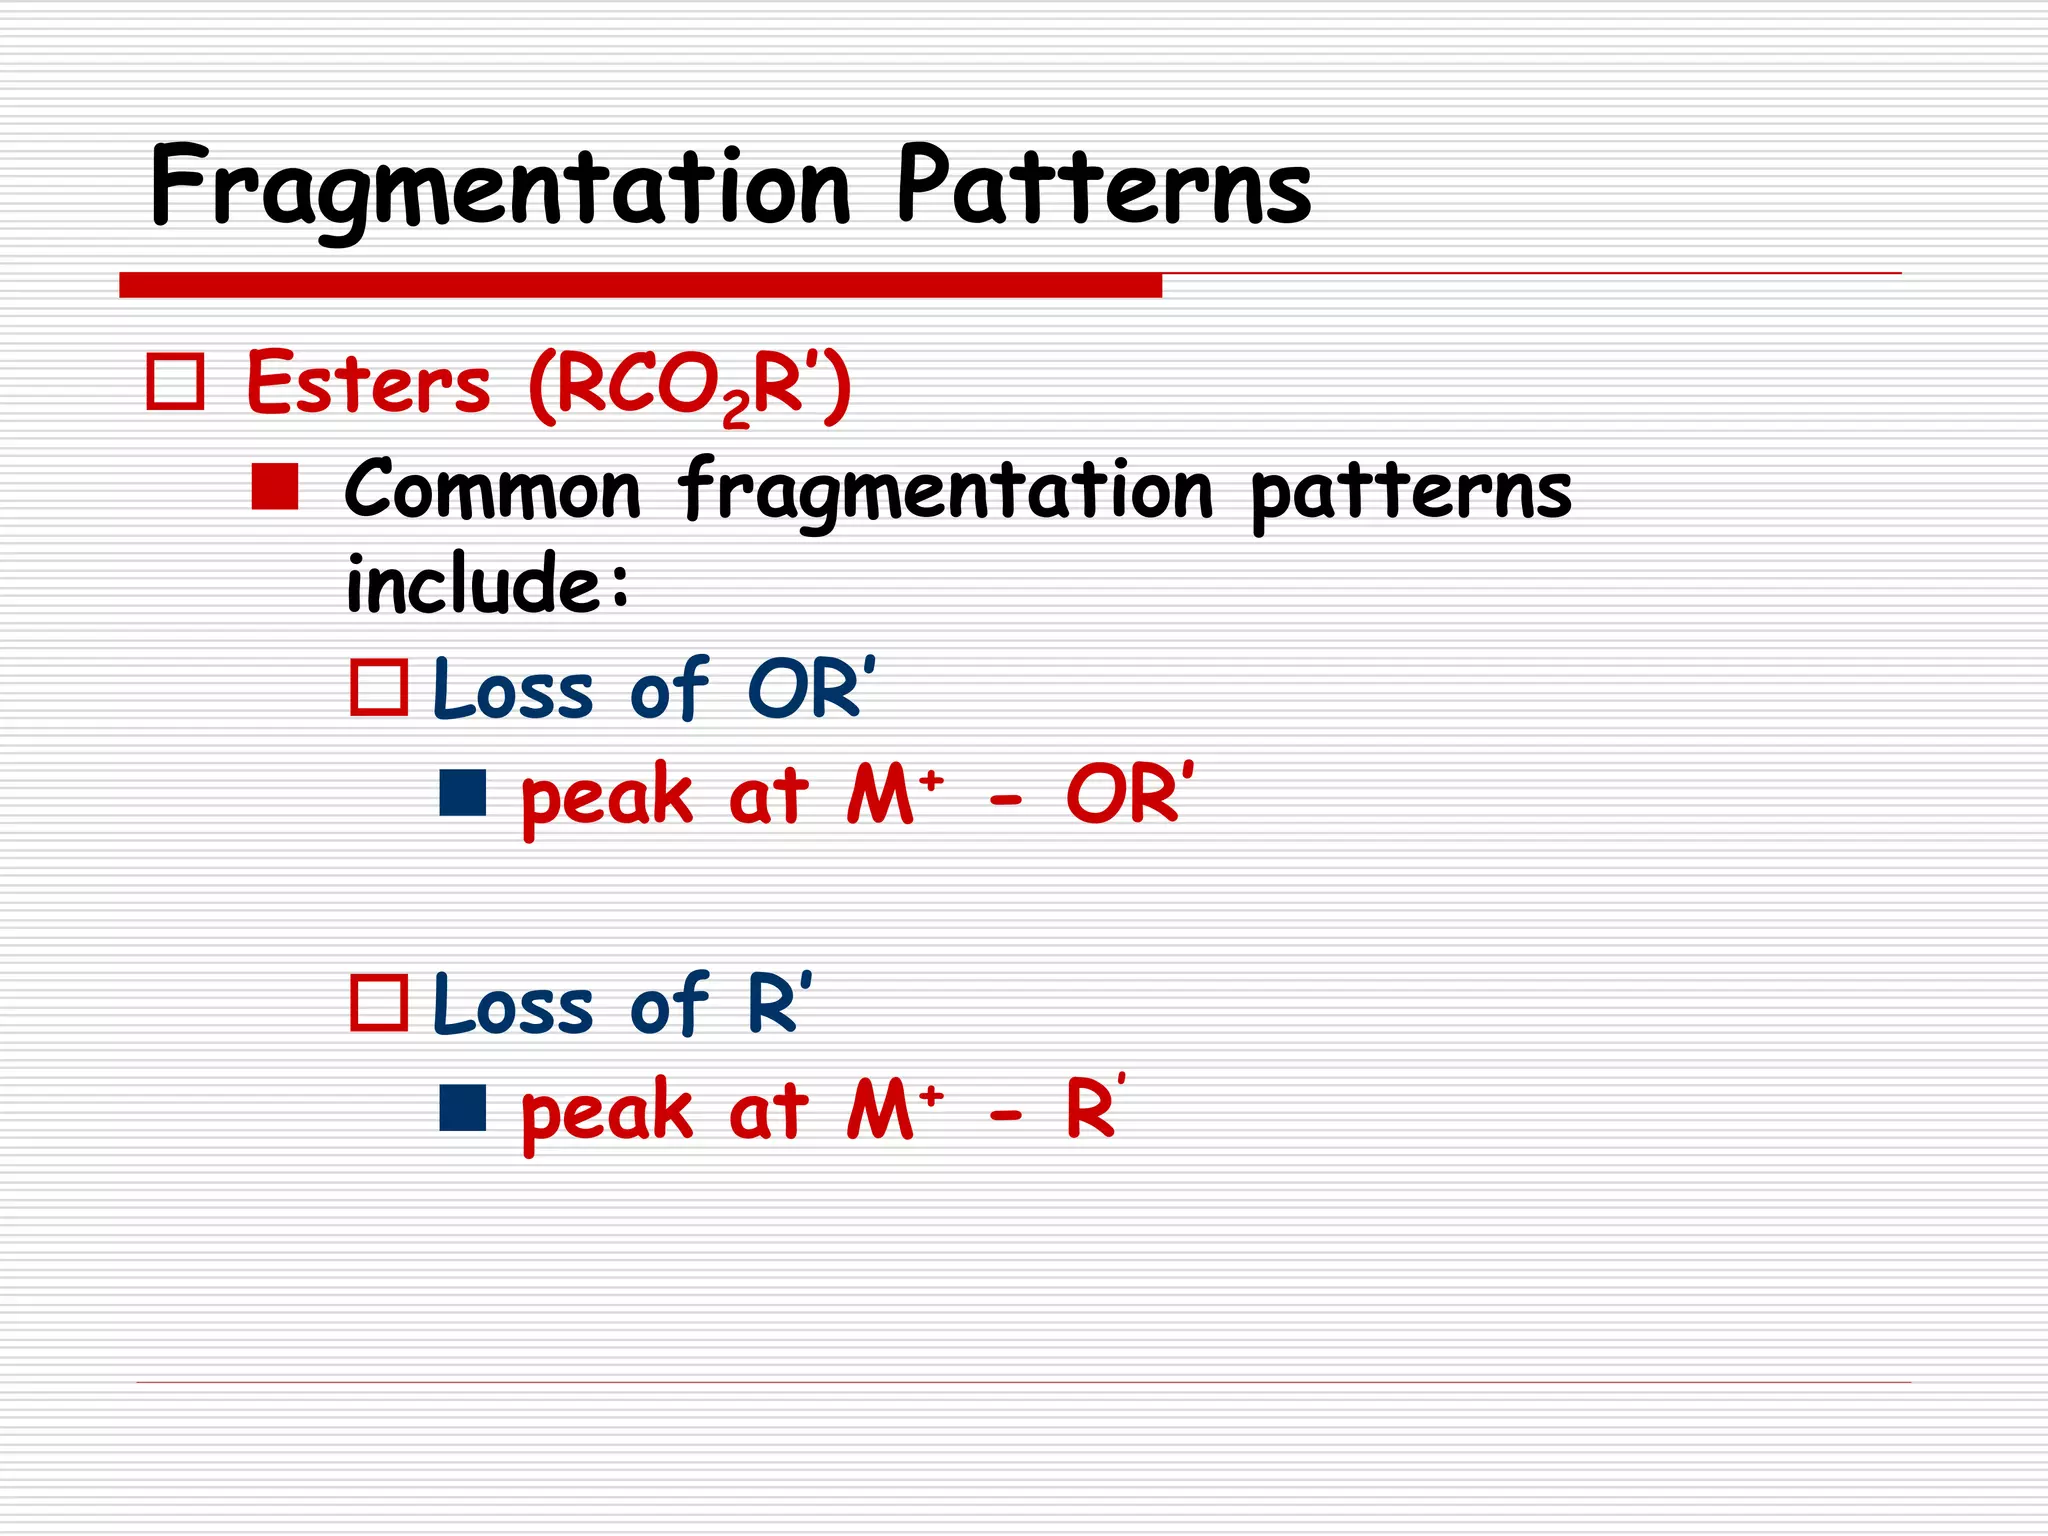
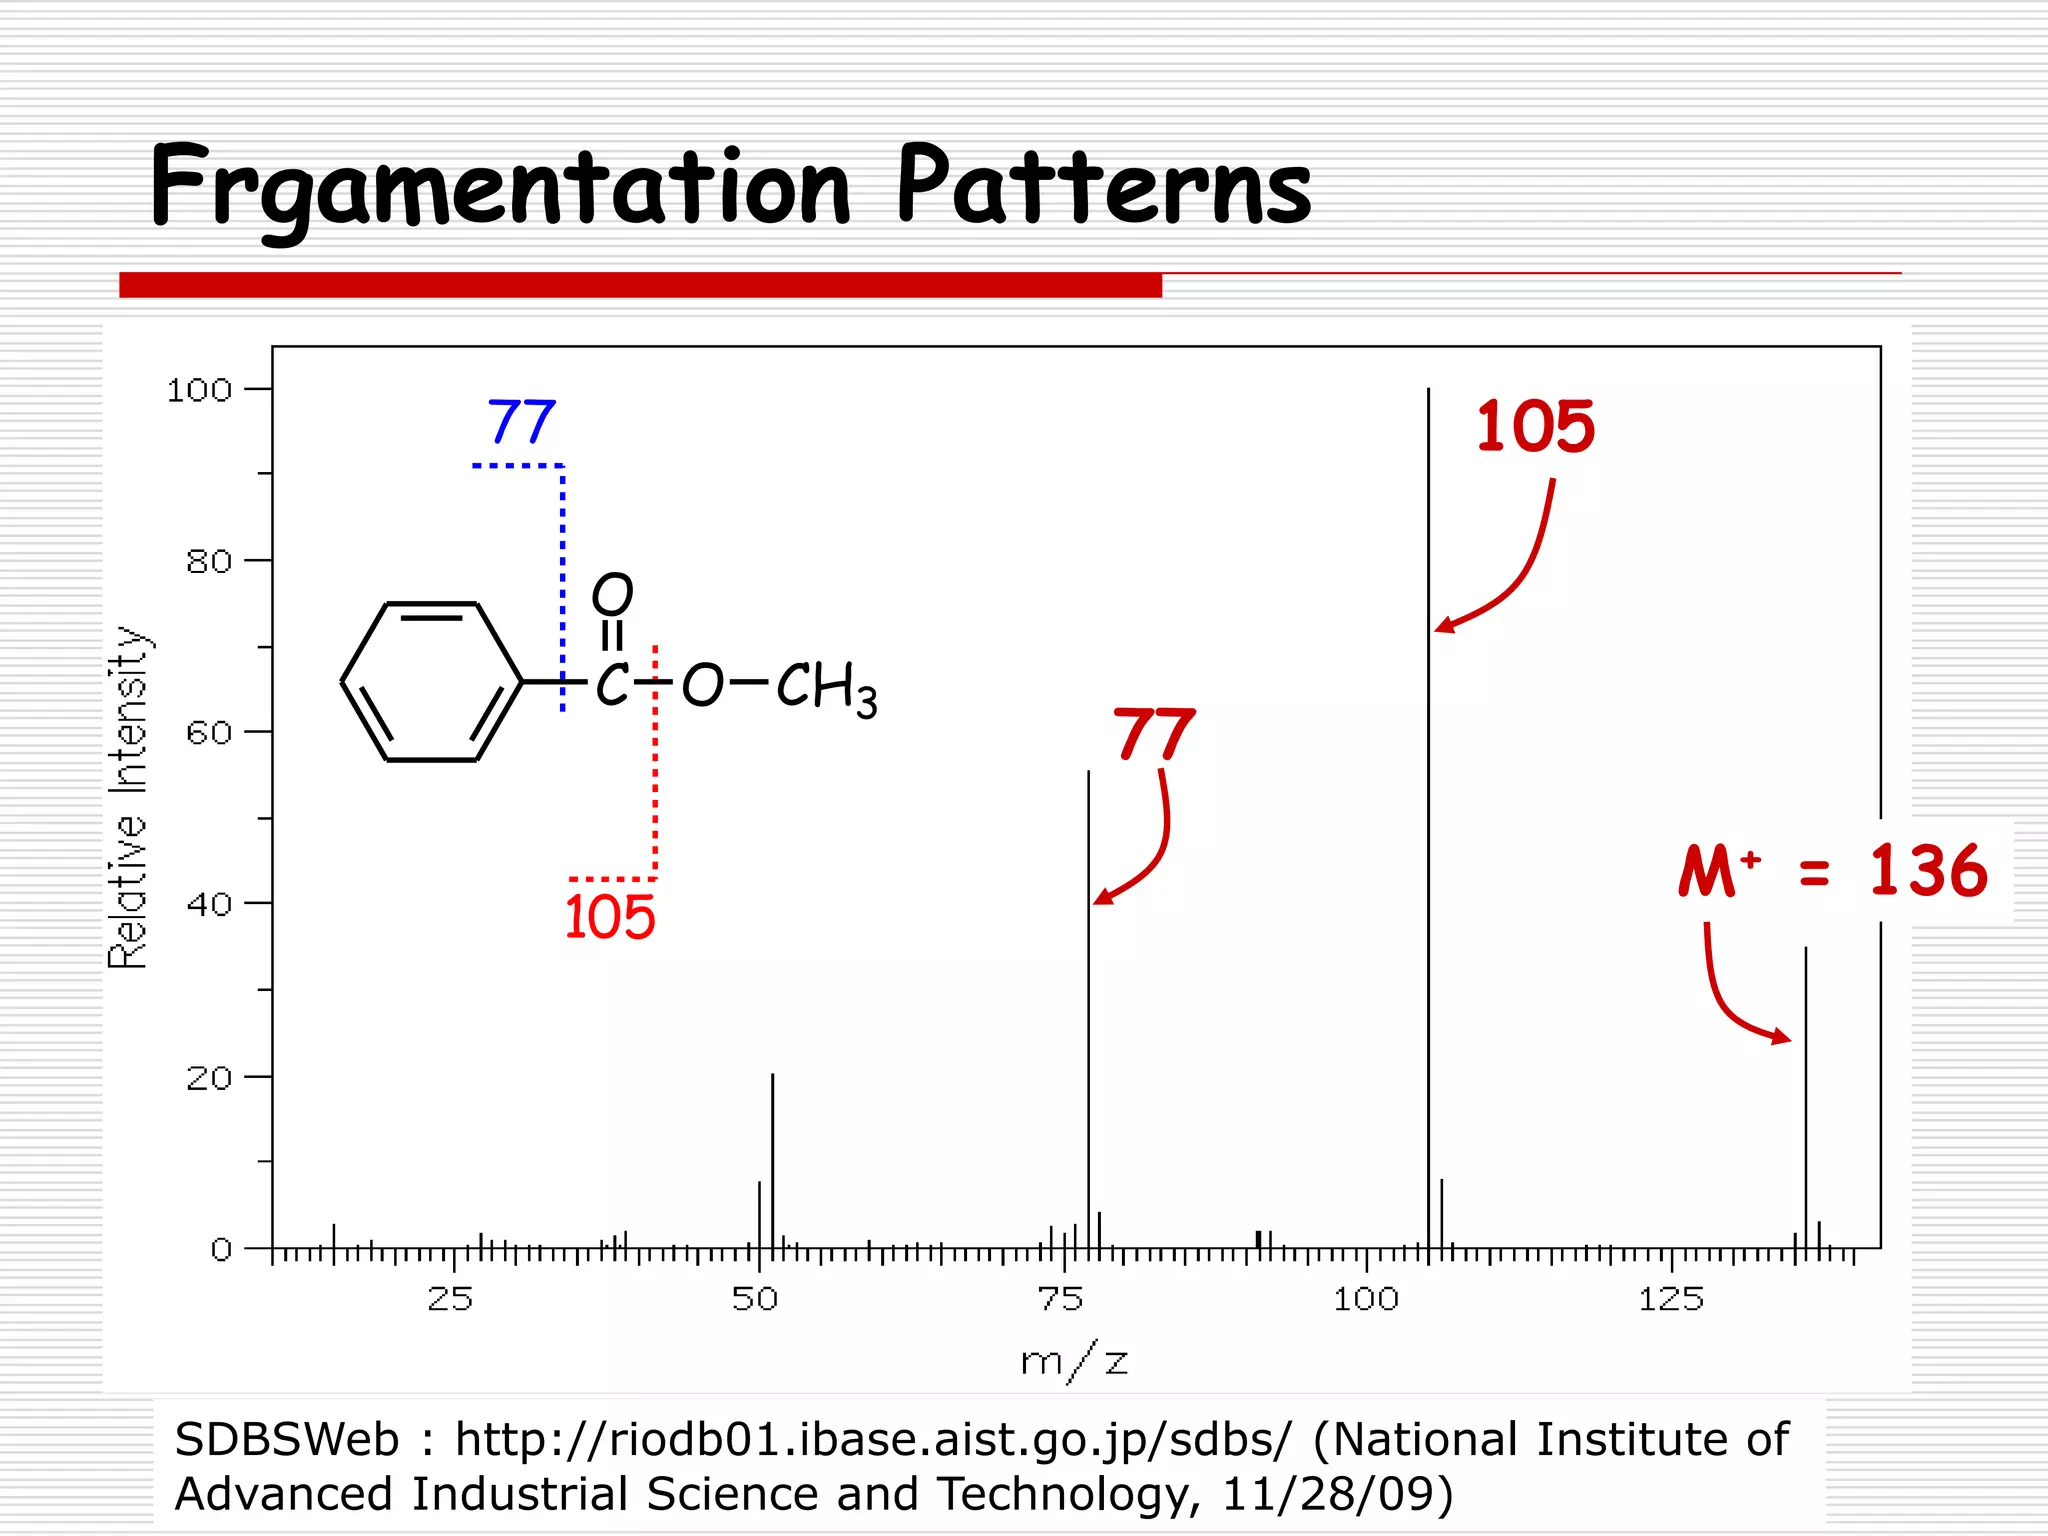
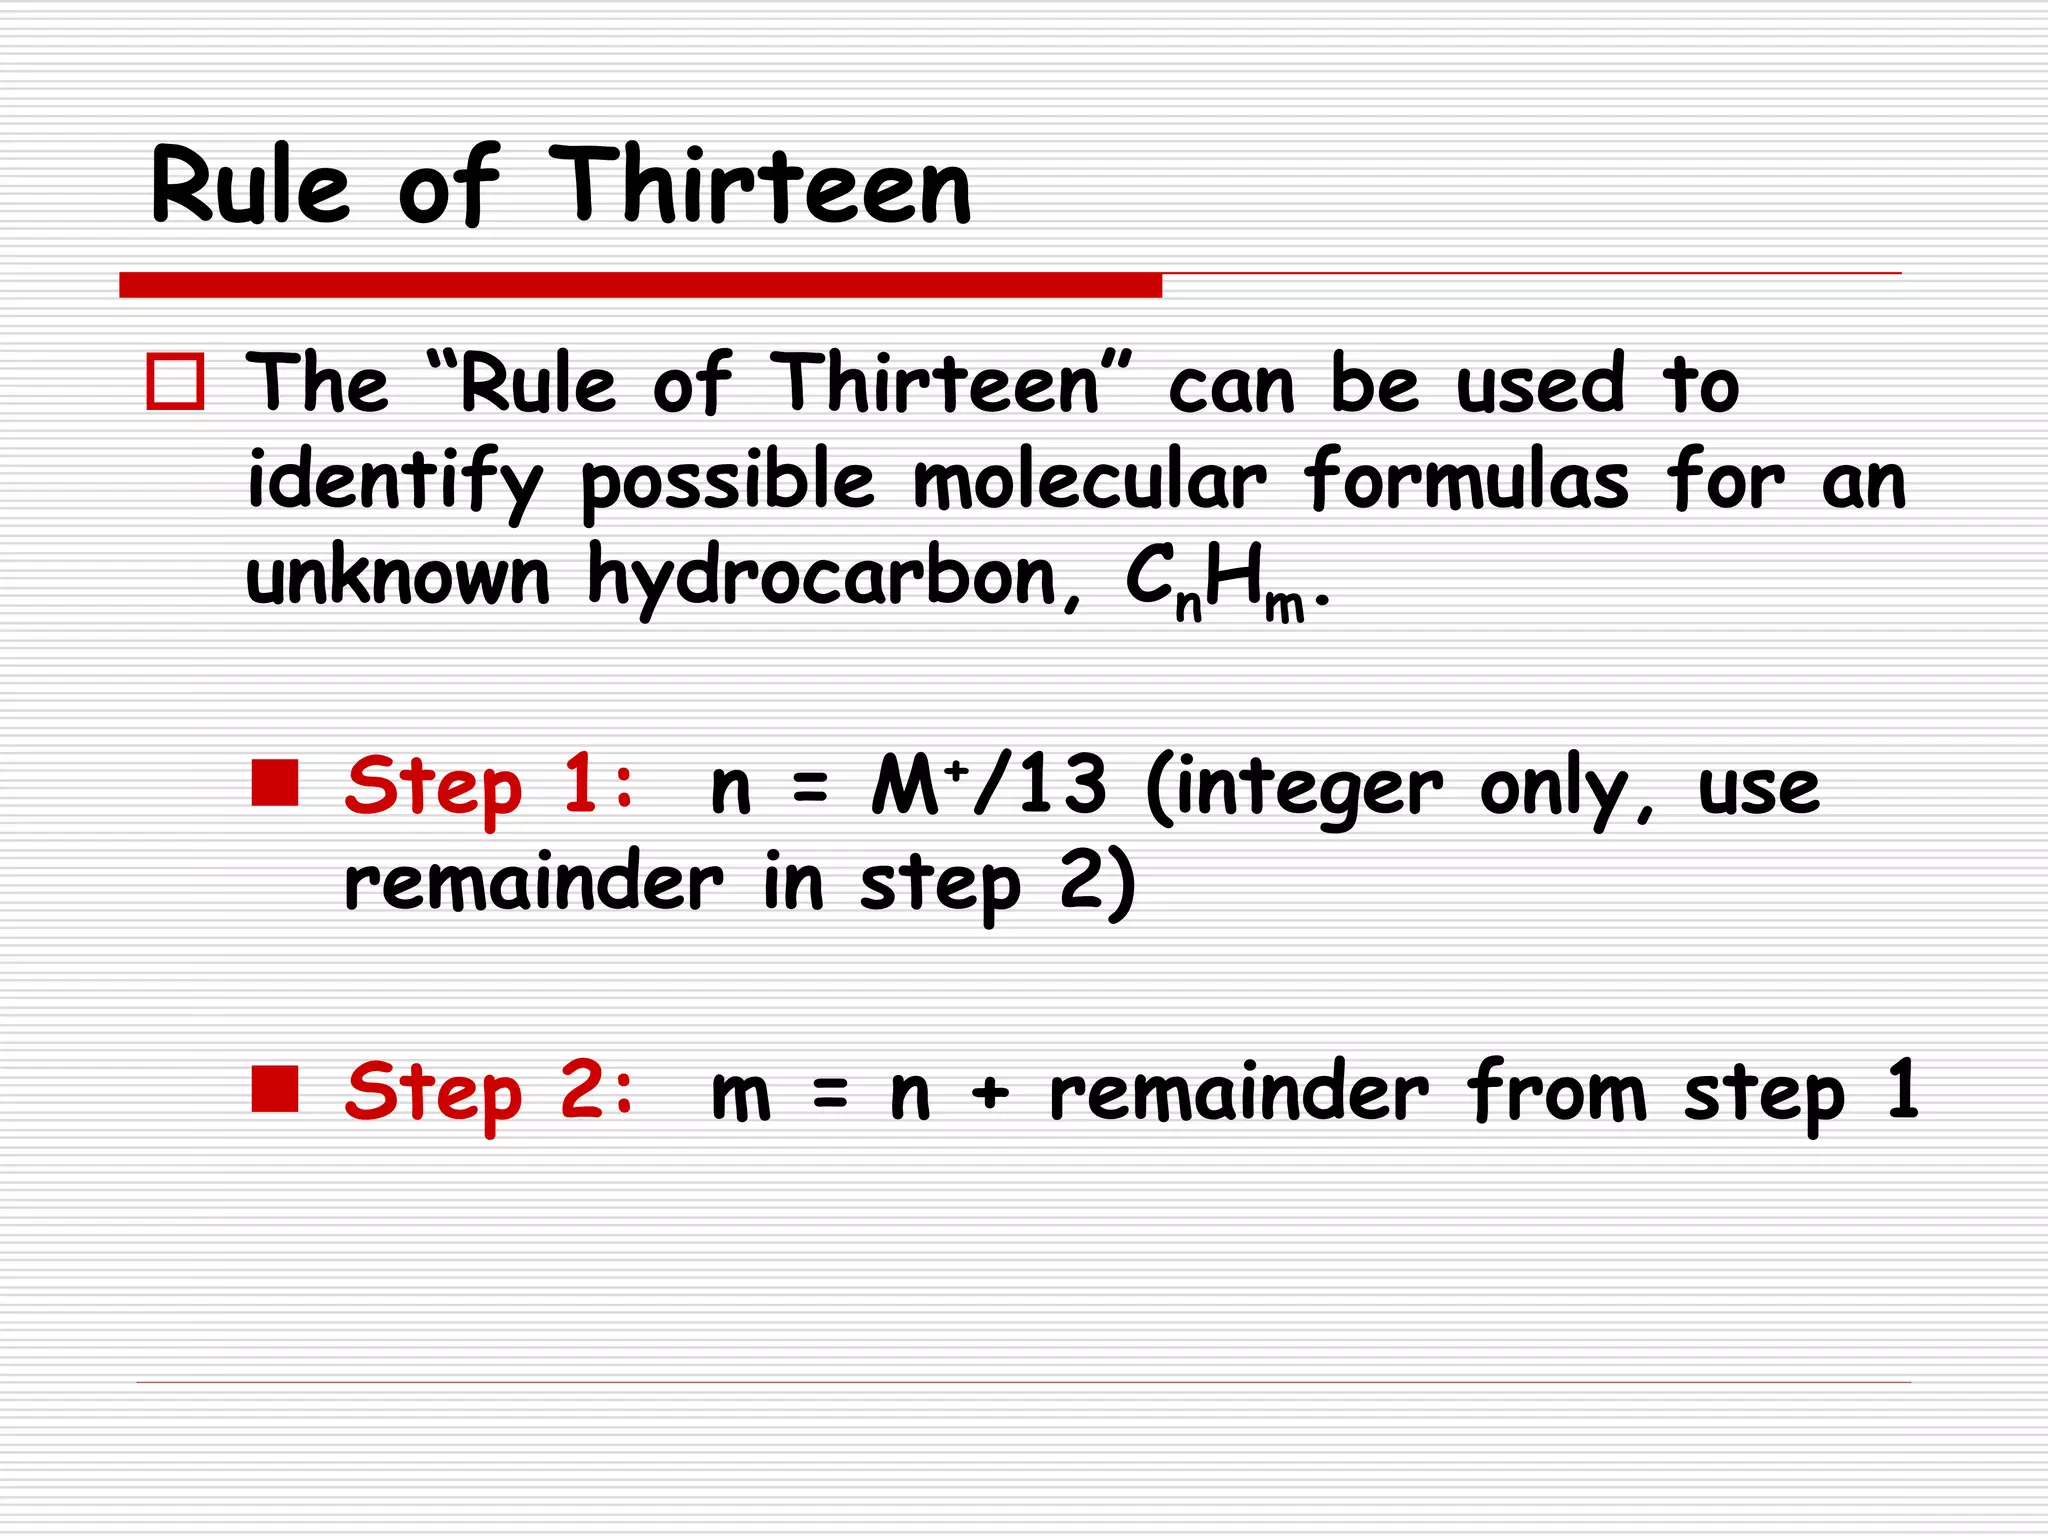
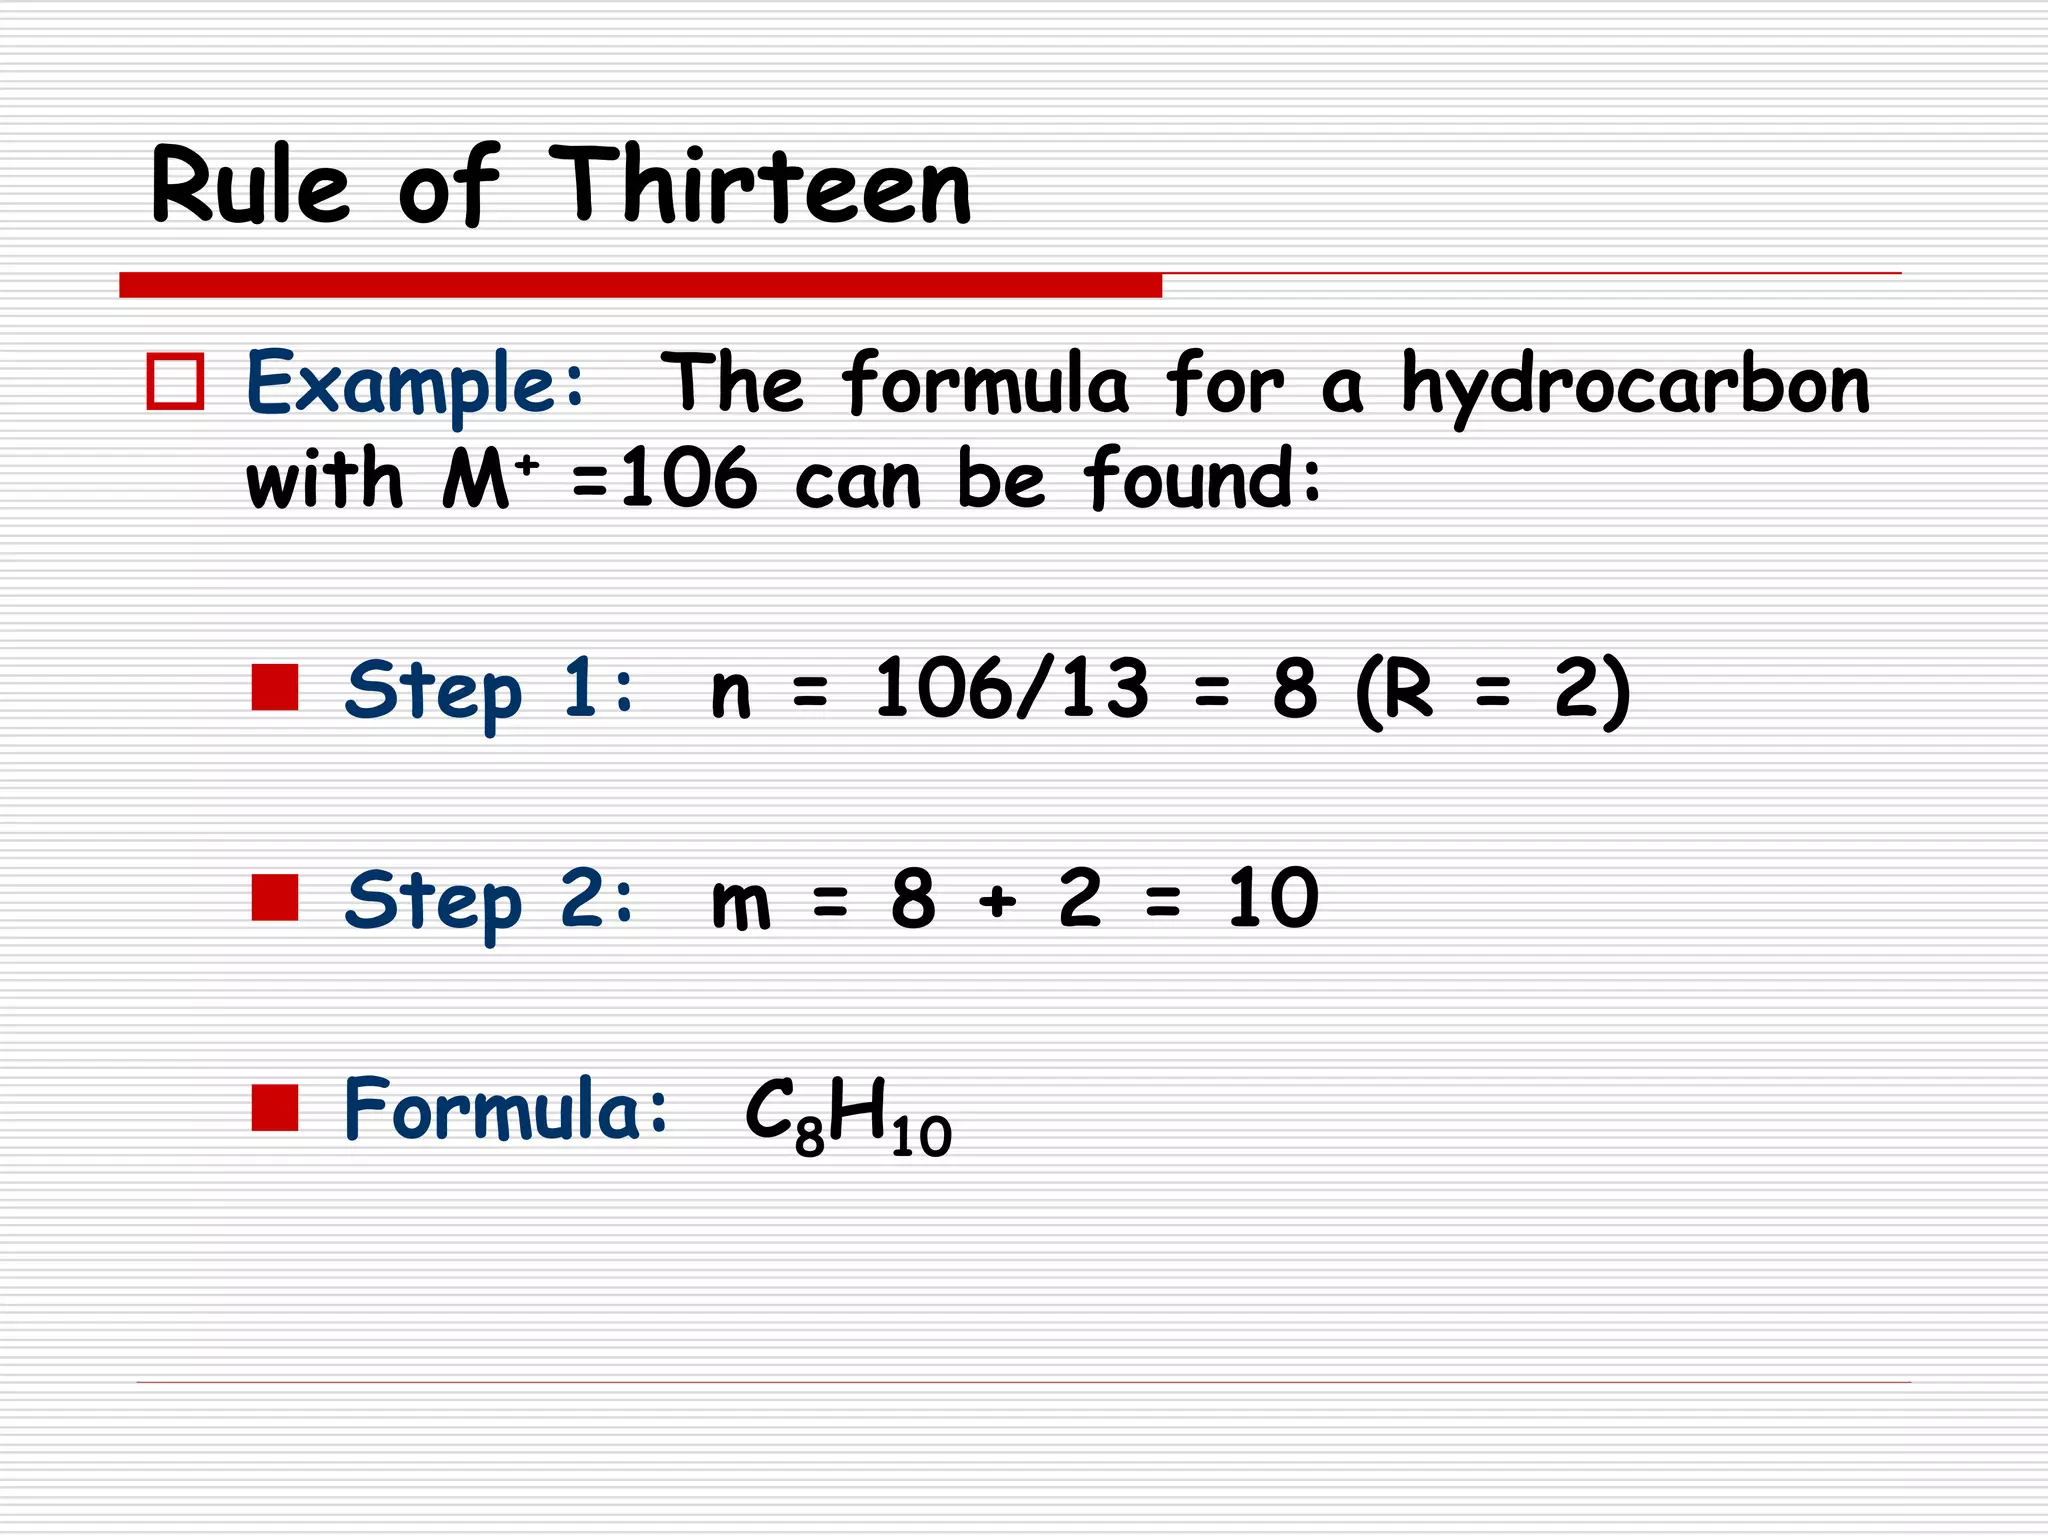
Mass
Spectrometry
Prepared By :
Mahendra G S
M-Pharm,Pharmaceutical
Chemistry
JSSCP, MYSURU
Fragmentation Rules
Background
 Mass spectrometry (Mass Spec or MS)
uses high energy electrons to break a
molecule into fragments.
 Separation and analysis of the fragments
provides information about:
 Molecular weight
 Structure
Background
 The impact of a stream of high energy
electrons causes the molecule to lose an
electron forming a radical cation.
 A species with a positive charge and
one unpaired electron
+ e
-
C H
H
H
H H
H
H
HC + 2 e
-
Molecular ion (M+)
m/z = 16
Background
 The impact of the stream of high energy
electrons can also break the molecule or
the radical cation into fragments.
(not detected by MS)
m/z = 29
molecular ion (M
+
) m/z = 30
+ C
H
H
H
+ H
HH C
H
H
C
H
H
H C
H
H
C
H
H
H C
H
H
+ e
-
H C
H
H
C
H
H
H
m/z = 15
Background
 Molecular ion (parent ion):
 The radical cation corresponding to the
mass of the original molecule
 The molecular ion is usually the highest
mass in the spectrum
 Some exceptions w/specific isotopes
 Some molecular ion peaks are absent.
H
H
H
HC H C
H
H
C
H
H
H
Background
 Mass spectrum of ethanol (MW = 46)
SDBSWeb : http://riodb01.ibase.aist.go.jp/sdbs/ (National Institute of
Advanced Industrial Science and Technology, 11/1/09)
M+
Background
 The cations that are formed are
separated by magnetic deflection.
Background
 Only cations are detected.
 Radicals are “invisible” in MS.
 The amount of deflection observed
depends on the mass to charge ratio
(m/z).
 Most cations formed have a charge of
+1 so the amount of deflection
observed is usually dependent on the
mass of the ion.
Background
 The resulting mass spectrum is a graph
of the mass of each cation vs. its
relative abundance.
 The peaks are assigned an abundance as
a percentage of the base peak.
 the most intense peak in the spectrum
 The base peak is not necessarily the
same as the parent ion peak.
Background
SDBSWeb : http://riodb01.ibase.aist.go.jp/sdbs/ (National Institute of
Advanced Industrial Science and Technology, 11/1/09)
M+
base peak
The mass spectrum of ethanol
Background
 Most elements occur naturally as a
mixture of isotopes.
 The presence of significant amounts of
heavier isotopes leads to small peaks
that have masses that are higher than
the parent ion peak.
 M+1 = a peak that is one mass unit
higher than M+
 M+2 = a peak that is two mass units
higher than M+
Easily Recognized Elements in MS
 Nitrogen:
 Odd number of N = odd MW
CH3CN
M
+
= 41
SDBSWeb : http://riodb01.ibase.aist.go.jp/sdbs/ (National Institute of
Advanced Industrial Science and Technology, 11/2/09)
Easily Recognized Elements in MS
 Bromine:
 M+ ~ M+2 (50.5% 79Br/49.5% 81Br)
2-bromopropane
M+ ~ M+2
SDBSWeb : http://riodb01.ibase.aist.go.jp/sdbs/ (National Institute of Advanced Industrial
Science and Technology, 11/1/09)
Easily Recognized Elements in MS
 Chlorine:
 M+2 is ~ 1/3 as large as M+
Cl
SDBSWeb : http://riodb01.ibase.aist.go.jp/sdbs/ (National Institute of
Advanced Industrial Science and Technology, 11/2/09)
M+2
M+
 Sulfur:
 M+2 larger than usual (4% of M+)
Easily Recognized Elements in MS
M+
Unusually
large M+2
S
SDBSWeb : http://riodb01.ibase.aist.go.jp/sdbs/ (National Institute of
Advanced Industrial Science and Technology, 11/1/09)
Easily Recognized Elements in MS
 Iodine
 I+ at 127
 Large gap
Large gap
I+
M+
SDBSWeb : http://riodb01.ibase.aist.go.jp/sdbs/ (National Institute of
Advanced Industrial Science and Technology, 11/2/09)
ICH2CN
Fragmentation Patterns
 The impact of the stream of high energy
electrons often breaks the molecule into
fragments, commonly a cation and a
radical.
 Bonds break to give the most stable
cation.
 Stability of the radical is less
important.
Fragmentation Patterns
 Alkanes
 Fragmentation often splits off simple
alkyl groups:
 Loss of methyl M+ - 15
 Loss of ethyl M+ - 29
 Loss of propyl M+ - 43
 Loss of butyl M+ - 57
 Branched alkanes tend to fragment
forming the most stable carbocations.
Fragmentation Patterns
 Mass spectrum of 2-methylpentane
Fragmentation Patterns
 Alkenes:
 Fragmentation typically forms
resonance stabilized allylic carbocations
Fragmentation Patterns
 Aromatics:
 Fragment at the benzylic carbon, forming a
resonance stabilized benzylic carbocation
(which rearranges to the tropylium ion)
M+
CH
H
CH Br
H
C
H
H
or
Fragmentation Patterns
Aromatics may also have a peak at m/z = 77 for
the benzene ring.
NO2
77
M+ = 123
77
Fragmentation Patterns
 Alcohols
 Fragment easily resulting in very small or
missing parent ion peak
 May lose hydroxyl radical or water
 M+ - 17 or M+ - 18
 Commonly lose an alkyl group attached to
the carbinol carbon forming an oxonium
ion.
 1o alcohol usually has prominent peak at
m/z = 31 corresponding to H2C=OH+
Fragmentation Patterns
 MS for 1-propanol
M+M+-18
CH3CH2CH2OH
H2C OH
SDBSWeb : http://riodb01.ibase.aist.go.jp/sdbs/ (National Institute of
Advanced Industrial Science and Technology, 11/28/09)
Fragmentation Patterns
 Amines
 Odd M+ (assuming an odd number of
nitrogens are present)
 a-cleavage dominates forming an
iminium ion
CH3CH2 CH2 N
H
CH2 CH2CH2CH3 CH3CH2CH2N CH2
H
m/z =72
iminium ion
Fragmentation Patterns
86
CH3CH2 CH2 N
H
CH2 CH2CH2CH3
72
Fragmentation Patterns
 Ethers
 a-cleavage forming oxonium ion
 Loss of alkyl group forming oxonium ion
 Loss of alkyl group forming a
carbocation
Fragmentation Patterns
H O CHCH3
MS of diethylether (CH3CH2OCH2CH3)
CH3CH2O CH2
H O CH2
Fragmentation Patterns
 Aldehydes (RCHO)
 Fragmentation may form acylium ion
 Common fragments:
 M+ - 1 for
 M+ - 29 for
RC O
R (i.e. RCHO - CHO)
RC O
Fragmentation Patterns
 MS for hydrocinnamaldehyde
M+ = 134
C C C H
H
H
H
H
O
133
105
91
105
91
SDBSWeb : http://riodb01.ibase.aist.go.jp/sdbs/ (National Institute of
Advanced Industrial Science and Technology, 11/28/09)
Fragmentation Patterns
 Ketones
 Fragmentation leads to formation of
acylium ion:
 Loss of R forming
 Loss of R’ forming RC O
R'C O
RCR'
O
Fragmentation Patterns
 MS for 2-pentanone
CH3CCH2CH2CH3
O
M+
CH3CH2CH2C O
CH3C O
SDBSWeb : http://riodb01.ibase.aist.go.jp/sdbs/ (National Institute of
Advanced Industrial Science and Technology, 11/28/09)
Fragmentation Patterns
 Esters (RCO2R’)
 Common fragmentation patterns
include:
 Loss of OR’
 peak at M+ - OR’
 Loss of R’
 peak at M+ - R’
Frgamentation Patterns
M+ = 136
C
O
O CH3
105
77 105
77
SDBSWeb : http://riodb01.ibase.aist.go.jp/sdbs/ (National Institute of
Advanced Industrial Science and Technology, 11/28/09)
Rule of Thirteen
 The “Rule of Thirteen” can be used to
identify possible molecular formulas for an
unknown hydrocarbon, CnHm.
 Step 1: n = M+/13 (integer only, use
remainder in step 2)
 Step 2: m = n + remainder from step 1
Rule of Thirteen
 Example: The formula for a hydrocarbon
with M+ =106 can be found:
 Step 1: n = 106/13 = 8 (R = 2)
 Step 2: m = 8 + 2 = 10
 Formula: C8H10
Rule of Thirteen
 If a heteroatom is present,
 Subtract the mass of each heteroatom
from the MW
 Calculate the formula for the
corresponding hydrocarbon
 Add the heteroatoms to the formula
Rule of Thirteen
Example: A compound with a molecular ion
peak at m/z = 102 has a strong peak at
1739 cm-1 in its IR spectrum. Determine
its molecular formula.
GC-Mass Spec: Experiment 23
 Mass Spec can be combined with gas
chromatography to analyze mixtures of
compounds.
 GC separates the components of the
mixture.
 Each component is analyzed by the
Mass Spectrometer.
GC-Mass Spec: Experiment 23
 Assignment:
 Observe the GC-mass spec experiment
 Record experimental conditions
 Analyze the mass spectrum of each
component of your mixture:
 Parent ion peak?
 Heteroatoms apparent from
spectrum?
 A minimum of 1 or two significant
fragments and their structures
GC-Mass Spec: Experiment 23
 Assignment (cont.):
 Using the Mass Spec data, retention
times, and boiling points, identify the
components of your mixture.
 Write three paragraphs (one per
compound) summarizing and interpreting
all data. See your data sheet for
more details.

Fragmentation rule MASS

  • 1.
    Mass Spectrometry Prepared By : MahendraG S M-Pharm,Pharmaceutical Chemistry JSSCP, MYSURU Fragmentation Rules
  • 2.
    Background  Mass spectrometry(Mass Spec or MS) uses high energy electrons to break a molecule into fragments.  Separation and analysis of the fragments provides information about:  Molecular weight  Structure
  • 3.
    Background  The impactof a stream of high energy electrons causes the molecule to lose an electron forming a radical cation.  A species with a positive charge and one unpaired electron + e - C H H H H H H H HC + 2 e - Molecular ion (M+) m/z = 16
  • 4.
    Background  The impactof the stream of high energy electrons can also break the molecule or the radical cation into fragments. (not detected by MS) m/z = 29 molecular ion (M + ) m/z = 30 + C H H H + H HH C H H C H H H C H H C H H H C H H + e - H C H H C H H H m/z = 15
  • 5.
    Background  Molecular ion(parent ion):  The radical cation corresponding to the mass of the original molecule  The molecular ion is usually the highest mass in the spectrum  Some exceptions w/specific isotopes  Some molecular ion peaks are absent. H H H HC H C H H C H H H
  • 6.
    Background  Mass spectrumof ethanol (MW = 46) SDBSWeb : http://riodb01.ibase.aist.go.jp/sdbs/ (National Institute of Advanced Industrial Science and Technology, 11/1/09) M+
  • 7.
    Background  The cationsthat are formed are separated by magnetic deflection.
  • 8.
    Background  Only cationsare detected.  Radicals are “invisible” in MS.  The amount of deflection observed depends on the mass to charge ratio (m/z).  Most cations formed have a charge of +1 so the amount of deflection observed is usually dependent on the mass of the ion.
  • 9.
    Background  The resultingmass spectrum is a graph of the mass of each cation vs. its relative abundance.  The peaks are assigned an abundance as a percentage of the base peak.  the most intense peak in the spectrum  The base peak is not necessarily the same as the parent ion peak.
  • 10.
    Background SDBSWeb : http://riodb01.ibase.aist.go.jp/sdbs/(National Institute of Advanced Industrial Science and Technology, 11/1/09) M+ base peak The mass spectrum of ethanol
  • 11.
    Background  Most elementsoccur naturally as a mixture of isotopes.  The presence of significant amounts of heavier isotopes leads to small peaks that have masses that are higher than the parent ion peak.  M+1 = a peak that is one mass unit higher than M+  M+2 = a peak that is two mass units higher than M+
  • 12.
    Easily Recognized Elementsin MS  Nitrogen:  Odd number of N = odd MW CH3CN M + = 41 SDBSWeb : http://riodb01.ibase.aist.go.jp/sdbs/ (National Institute of Advanced Industrial Science and Technology, 11/2/09)
  • 13.
    Easily Recognized Elementsin MS  Bromine:  M+ ~ M+2 (50.5% 79Br/49.5% 81Br) 2-bromopropane M+ ~ M+2 SDBSWeb : http://riodb01.ibase.aist.go.jp/sdbs/ (National Institute of Advanced Industrial Science and Technology, 11/1/09)
  • 14.
    Easily Recognized Elementsin MS  Chlorine:  M+2 is ~ 1/3 as large as M+ Cl SDBSWeb : http://riodb01.ibase.aist.go.jp/sdbs/ (National Institute of Advanced Industrial Science and Technology, 11/2/09) M+2 M+
  • 15.
     Sulfur:  M+2larger than usual (4% of M+) Easily Recognized Elements in MS M+ Unusually large M+2 S SDBSWeb : http://riodb01.ibase.aist.go.jp/sdbs/ (National Institute of Advanced Industrial Science and Technology, 11/1/09)
  • 16.
    Easily Recognized Elementsin MS  Iodine  I+ at 127  Large gap Large gap I+ M+ SDBSWeb : http://riodb01.ibase.aist.go.jp/sdbs/ (National Institute of Advanced Industrial Science and Technology, 11/2/09) ICH2CN
  • 17.
    Fragmentation Patterns  Theimpact of the stream of high energy electrons often breaks the molecule into fragments, commonly a cation and a radical.  Bonds break to give the most stable cation.  Stability of the radical is less important.
  • 18.
    Fragmentation Patterns  Alkanes Fragmentation often splits off simple alkyl groups:  Loss of methyl M+ - 15  Loss of ethyl M+ - 29  Loss of propyl M+ - 43  Loss of butyl M+ - 57  Branched alkanes tend to fragment forming the most stable carbocations.
  • 19.
    Fragmentation Patterns  Massspectrum of 2-methylpentane
  • 20.
    Fragmentation Patterns  Alkenes: Fragmentation typically forms resonance stabilized allylic carbocations
  • 21.
    Fragmentation Patterns  Aromatics: Fragment at the benzylic carbon, forming a resonance stabilized benzylic carbocation (which rearranges to the tropylium ion) M+ CH H CH Br H C H H or
  • 22.
    Fragmentation Patterns Aromatics mayalso have a peak at m/z = 77 for the benzene ring. NO2 77 M+ = 123 77
  • 23.
    Fragmentation Patterns  Alcohols Fragment easily resulting in very small or missing parent ion peak  May lose hydroxyl radical or water  M+ - 17 or M+ - 18  Commonly lose an alkyl group attached to the carbinol carbon forming an oxonium ion.  1o alcohol usually has prominent peak at m/z = 31 corresponding to H2C=OH+
  • 24.
    Fragmentation Patterns  MSfor 1-propanol M+M+-18 CH3CH2CH2OH H2C OH SDBSWeb : http://riodb01.ibase.aist.go.jp/sdbs/ (National Institute of Advanced Industrial Science and Technology, 11/28/09)
  • 25.
    Fragmentation Patterns  Amines Odd M+ (assuming an odd number of nitrogens are present)  a-cleavage dominates forming an iminium ion CH3CH2 CH2 N H CH2 CH2CH2CH3 CH3CH2CH2N CH2 H m/z =72 iminium ion
  • 26.
  • 27.
    Fragmentation Patterns  Ethers a-cleavage forming oxonium ion  Loss of alkyl group forming oxonium ion  Loss of alkyl group forming a carbocation
  • 28.
    Fragmentation Patterns H OCHCH3 MS of diethylether (CH3CH2OCH2CH3) CH3CH2O CH2 H O CH2
  • 29.
    Fragmentation Patterns  Aldehydes(RCHO)  Fragmentation may form acylium ion  Common fragments:  M+ - 1 for  M+ - 29 for RC O R (i.e. RCHO - CHO) RC O
  • 30.
    Fragmentation Patterns  MSfor hydrocinnamaldehyde M+ = 134 C C C H H H H H O 133 105 91 105 91 SDBSWeb : http://riodb01.ibase.aist.go.jp/sdbs/ (National Institute of Advanced Industrial Science and Technology, 11/28/09)
  • 31.
    Fragmentation Patterns  Ketones Fragmentation leads to formation of acylium ion:  Loss of R forming  Loss of R’ forming RC O R'C O RCR' O
  • 32.
    Fragmentation Patterns  MSfor 2-pentanone CH3CCH2CH2CH3 O M+ CH3CH2CH2C O CH3C O SDBSWeb : http://riodb01.ibase.aist.go.jp/sdbs/ (National Institute of Advanced Industrial Science and Technology, 11/28/09)
  • 33.
    Fragmentation Patterns  Esters(RCO2R’)  Common fragmentation patterns include:  Loss of OR’  peak at M+ - OR’  Loss of R’  peak at M+ - R’
  • 34.
    Frgamentation Patterns M+ =136 C O O CH3 105 77 105 77 SDBSWeb : http://riodb01.ibase.aist.go.jp/sdbs/ (National Institute of Advanced Industrial Science and Technology, 11/28/09)
  • 35.
    Rule of Thirteen The “Rule of Thirteen” can be used to identify possible molecular formulas for an unknown hydrocarbon, CnHm.  Step 1: n = M+/13 (integer only, use remainder in step 2)  Step 2: m = n + remainder from step 1
  • 36.
    Rule of Thirteen Example: The formula for a hydrocarbon with M+ =106 can be found:  Step 1: n = 106/13 = 8 (R = 2)  Step 2: m = 8 + 2 = 10  Formula: C8H10
  • 37.
    Rule of Thirteen If a heteroatom is present,  Subtract the mass of each heteroatom from the MW  Calculate the formula for the corresponding hydrocarbon  Add the heteroatoms to the formula
  • 38.
    Rule of Thirteen Example:A compound with a molecular ion peak at m/z = 102 has a strong peak at 1739 cm-1 in its IR spectrum. Determine its molecular formula.
  • 39.
    GC-Mass Spec: Experiment23  Mass Spec can be combined with gas chromatography to analyze mixtures of compounds.  GC separates the components of the mixture.  Each component is analyzed by the Mass Spectrometer.
  • 40.
    GC-Mass Spec: Experiment23  Assignment:  Observe the GC-mass spec experiment  Record experimental conditions  Analyze the mass spectrum of each component of your mixture:  Parent ion peak?  Heteroatoms apparent from spectrum?  A minimum of 1 or two significant fragments and their structures
  • 41.
    GC-Mass Spec: Experiment23  Assignment (cont.):  Using the Mass Spec data, retention times, and boiling points, identify the components of your mixture.  Write three paragraphs (one per compound) summarizing and interpreting all data. See your data sheet for more details.