
Download as PDF, PPTX
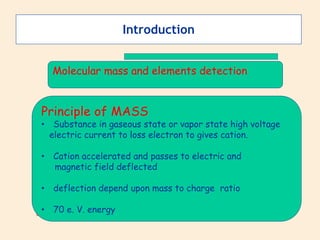


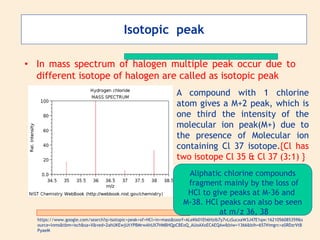

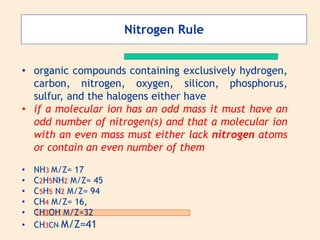


Mass spectroscopy is a technique used to identify molecules based on their mass. It works by ionizing molecules and then separating the resulting ions based on their mass-to-charge ratio. The document discusses the basic principles and instrumentation of mass spectroscopy. It explains how molecules are ionized by bombarding them with electrons, then the ions are accelerated and deflected based on their mass-to-charge ratios before being detected. Key aspects like molecular ion peaks, fragmentation patterns, and isotopic peaks are described to help interpret mass spectra.


