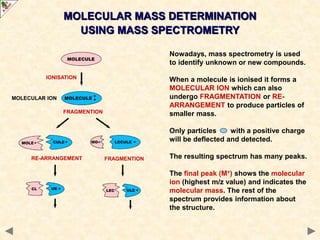
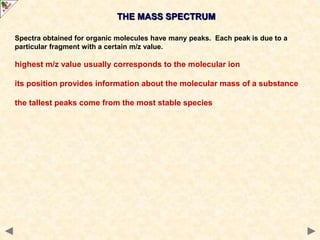
SlideShare a Scribd company logo
FURTHER MASS
SPECTROMETRY
A guide for A level students
KNOCKHARDY PUBLISHING
2015
SPECIFICATIONS
ION SOURCE
ANALYSER
DETECTOR
INTRODUCTION
This Powerpoint show is one of several produced to help students understand
selected topics at AS and A2 level Chemistry. It is based on the requirements of
the AQA and OCR specifications but is suitable for other examination boards.
Individual students may use the material at home for revision purposes or it may
be used for classroom teaching if an interactive white board is available.
Accompanying notes on this, and the full range of AS and A2 topics, are available
from the KNOCKHARDY SCIENCE WEBSITE at...
www.argonet.co.uk/users/hoptonj/sci.htm
Navigation is achieved by...
either clicking on the grey arrows at the foot of each page
or using the left and right arrow keys on the keyboard
MASS SPECTROMETRY
KNOCKHARDY PUBLISHING
CONTENTS
• Fragmentation of molecular ions - theory
• What a mass spectrum tells you
• Molecular ions
• Fragmentation
• Mass spectra of alkanes
• Mass spectra of halogenoalkanes
• Mass spectra of aldehydes and ketones
• Test questions
• Check list
MASS SPECTROMETRY
Before you start it would be helpful to…
• recall the basic principles of a mass spectrometer
• know the different types of functional group in organic chemsitry
MASS SPECTROMETRY
IONISATION
FRAGMENTION
FRAGMENTION
RE-ARRANGEMENT
MOLECULAR MASS DETERMINATION
USING MASS SPECTROMETRY
Nowadays, mass spectrometry is used
to identify unknown or new compounds.
When a molecule is ionised it forms a
MOLECULAR ION which can also
undergo FRAGMENTATION or RE-
ARRANGEMENT to produce particles of
smaller mass.
Only particles with a positive charge
will be deflected and detected.
The resulting spectrum has many peaks.
The final peak (M+) shows the molecular
ion (highest m/z value) and indicates the
molecular mass. The rest of the
spectrum provides information about
the structure.
MOLECULAR ION
Spectra obtained for organic molecules have many peaks. Each peak is due to a
particular fragment with a certain m/z value.
highest m/z value usually corresponds to the molecular ion
its position provides information about the molecular mass of a substance
the tallest peaks come from the most stable species
THE MASS SPECTRUM
Interpretation of thousands of spectra has shown that many classes of organic
compound show characteristic fragmentation patterns due to their functional groups.
It is possible to identify the type of compound from its spectrum by looking at the ...
position of peaks
differences between major peaks
In the spectrum of octane, a signal occurs at 114 due to the species C8H18
+
THE MASS SPECTRUM - THE MOLECULAR ION
10 20 30 40 50 60 70 80 90 100 110 120 130 140
0 m/z
20
40
60
80
100
Abundance
%
114
.
The species due to the final signal is known as the molecular ion and is usually
corresponds to the molecular mass of the compound.
molecular ion
THE MASS SPECTRUM - THE MOLECULAR ION
The small peak (M+1) at 115 due to the natural abundance (about 1%) of carbon-13.
The height of this peak relative to that for the molecular ion depends on the number
of carbon atoms in the molecule. The more carbons present, the larger the M+1 peak.
10 20 30 40 50 60 70 80 90 100 110 120 130 140
0 m/z
20
40
60
80
100
Abundance
%
114
.
THE MASS SPECTRUM - FRAGMENTATION
10 20 30 40 50 60 70 80 90 100 110 120 130 140
0 m/z
20
40
60
80
100
Abundance
%
29
71
43
57
114
85
.
The rest of the spectrum provides additional information of the molecule’s structure.
Peaks appear due to characteristic fragments (e.g. 29 due to C2H5
+) and differences
between two peaks also indicates the loss of certain units (18 for H2O, 28 for CO).
The mass spectra of simple hydrocarbons have peaks at m/z values corresponding to
the ions produced by breaking C-C bonds. Peaks can occur at ...
m/z 15 29 43 57 71 85 etc.
CH3
+ C2H5
+ C3H7
+ C4H9
+ C5H11
+ C6H13
+
• the stability of the carbocation formed affects its abundance
• the more stable the cation the higher the peak
• the more alkyl groups attached to the carbocation the more stable it is
most stable tertiary 3° > secondary 2° > primary 1° least stable
alkyl groups are electron releasing and stabilise the cation
ALKANES
FRAGMENTATION PATTERNS
HALOGENOALKANES
FRAGMENTATION PATTERNS
Multiple peaks occur in the molecular ion region due to different halogen isotopes.
There are two peaks for the molecular ion of C2H5Br, one for the molecule containing
the isotope 79Br and the other for the one with the 81Br isotope. Because the two
isotopes are of similar abundance, the peaks are of similar height.
10 20 30 40 50 60 70 80 90 100 110 120 130 140
0 m/z
20
40
60
80
100
Abundance
%
molecular ion contains...79Br 81Br
Cleavage of bonds next to the carbonyl group (C=O) is a characteristic fragmentation
of aldehydes and ketones. A common fragment is carbon monoxide (CO) but as it is
a molecule and thus uncharged it will not produce a peak of its own. However, it will
produce an m/z drop of 28 somewhere in the spectrum.
The position of the carbonyl group influences the fragmentation pattern because the
molecular ion fragments either side of the carbonyl group
the more stable the acylium ion RCO+, the more abundant it will be and
the more abundant the species the taller its peak in the mass spectrum
FRAGMENTATION PATTERNS
ALDEHYDES AND KETONES
The position of the carbonyl group influences the fragmentation pattern because the
molecular ion fragments either side of the carbonyl group.
FRAGMENTATION PATTERNS
Aldehydes and ketones
O
CH3 C C4H9
MOLECULAR ION
has m/z = 100
• +
The position of the carbonyl group influences the fragmentation pattern because the
molecular ion fragments either side of the carbonyl group.
FRAGMENTATION PATTERNS
Aldehydes and ketones
O
CH3 C C4H9
O
C4H9 C+
CH3•
O
C4H9 C• CH3
+
m/z = 15
m/z = 85
MOLECULAR ION
has m/z = 100
Breaking the bond between the methyl
group and the carbonyl group
produces two possible ions,
depending on how the bond breaks.
Two peaks at m/z values 15 and 85 will
appear in the mass spectrum.
• +
The position of the carbonyl group influences the fragmentation pattern because the
molecular ion fragments either side of the carbonyl group.
FRAGMENTATION PATTERNS
Aldehydes and ketones
O
CH3 C C4H9
O
CH3 C+ C4H9•
O
CH3 C• C4H9
+
m/z = 57
m/z = 43
MOLECULAR ION
has m/z = 100
• +
Breaking the bond between the butyl
group and the carbonyl group
produces two further ions, depending
on how the bond breaks.
Two peaks at m/z values 43 and 57 will
appear in the mass spectrum.
The position of the carbonyl group influences the fragmentation pattern because the
molecular ion fragments either side of the carbonyl group.
FRAGMENTATION PATTERNS
Aldehydes and ketones
O
CH3 C C4H9
O
CH3 C+ C4H9•
O
CH3 C• C4H9
+
m/z = 57
m/z = 43
O
C4H9 C+
CH3•
O
C4H9 C• CH3
+
m/z = 15
m/z = 85
MOLECULAR ION
has m/z = 100
• +
A further peak occurs at m/z = 72 (100-28) due to loss of CO
Example;
m/z = 28
IDENTIFY THE
COMPOUNDS
IDENTIFY THE COMPOUND
122 124
29
79 81
43
10 20 30 40 50 60 70 80 90 100 110 120 130 140
0 m/z
Abundance
%
20
40
60
80
100
IDENTIFY THE COMPOUND
122 124
29
79 81
43
10 20 30 40 50 60 70 80 90 100 110 120 130 140
0 m/z
Abundance
%
20
40
60
80
100
C3H7Br
IDENTIFY THE COMPOUND
120
28
77
43
51
105
10 20 30 40 50 60 70 80 90 100 110 120 130 140
0 m/z
20
40
60
80
100
Abundance
%
IDENTIFY THE COMPOUND
120
28
77
43
51
105
10 20 30 40 50 60 70 80 90 100 110 120 130 140
0 m/z
20
40
60
80
100
Abundance
%
C6H5COCH3
IDENTIFY THE COMPOUND
0
28
105 106
77
57
43
51
10 20 30 40 50 60 70 80 90 100 110 120 130 140
m/z
Abundance
%
20
40
60
80
100
IDENTIFY THE COMPOUND
0
28
105 106
77
57
43
51
10 20 30 40 50 60 70 80 90 100 110 120 130 140
m/z
Abundance
%
20
40
60
80
100
C6H5CHO
IDENTIFY THE COMPOUND
0
142
113
71
56 57
43
10 20 30 40 50 60 70 80 90 100 110 120 130 140
m/z
Abundance
%
20
40
60
80
100
IDENTIFY THE COMPOUND
0
142
113
71
56 57
43
10 20 30 40 50 60 70 80 90 100 110 120 130 140
m/z
Abundance
%
20
40
60
80
100
C10H22
REVISION CHECK
What should you be able to do?
Understand how mass spectrometry can be used to calculate molecular mass
Recall the term molecular ion and understand what information it provides
Interpret simple mass spectra
CAN YOU DO ALL OF THESE? YES NO
You need to go over the
relevant topic(s) again
Click on the button to
return to the menu
WELL DONE!
Try some past paper questions
© 2015 JONATHAN HOPTON & KNOCKHARDY PUBLISHING
FURTHER MASS
SPECTROMETRY
The End

More Related Content

Similar to MASS SPECTRO 3.ppt

C:\Documents And Settings\Admin\Desktop\Mass
C:\Documents And Settings\Admin\Desktop\MassC:\Documents And Settings\Admin\Desktop\Mass
C:\Documents And Settings\Admin\Desktop\Mass
Shaikh Rafique
 
Chap 14 mass spec
Chap 14 mass specChap 14 mass spec
Chap 14 mass spec
ceutics1315
 
mass spectroscopy
mass spectroscopymass spectroscopy
2014, spectra massa
2014, spectra massa2014, spectra massa
2014, spectra massa
Fajar Gama Darmawan
 
Effect of inorganic fillers on Poly(ethylene oxide) crystallization and dynamics
Effect of inorganic fillers on Poly(ethylene oxide) crystallization and dynamicsEffect of inorganic fillers on Poly(ethylene oxide) crystallization and dynamics
Effect of inorganic fillers on Poly(ethylene oxide) crystallization and dynamics
Eleni 'Hellen' Papananou
 
Fragmentation rules mass spectroscopy
Fragmentation rules mass spectroscopyFragmentation rules mass spectroscopy
Fragmentation rules mass spectroscopy
Santhosh Kalakar dj
 
Uv visible spectroscopy
Uv visible spectroscopyUv visible spectroscopy
Uv visible spectroscopy
Narjis Shahid
 
uv.pptx
uv.pptxuv.pptx
Uvspectroscopyup 140119003106-phpapp01
Uvspectroscopyup 140119003106-phpapp01Uvspectroscopyup 140119003106-phpapp01
Uvspectroscopyup 140119003106-phpapp01
Shaik Imran
 
Mass spectrometry-cleavage pattern -organic
Mass spectrometry-cleavage pattern -organicMass spectrometry-cleavage pattern -organic
Mass spectrometry-cleavage pattern -organic
Javed Iqbal
 
Isotope in ms (OAN MUHAMMAD SAHITO)
Isotope in ms (OAN MUHAMMAD SAHITO)Isotope in ms (OAN MUHAMMAD SAHITO)
Isotope in ms (OAN MUHAMMAD SAHITO)
Oan Sahito
 
Atomic Absorption Spectroscopy
Atomic Absorption Spectroscopy Atomic Absorption Spectroscopy
Atomic Absorption Spectroscopy
Ranjith R
 
Uvspectroscopyup
UvspectroscopyupUvspectroscopyup
Uvspectroscopyup
Naveed Ahmed
 
mass spectrometery
mass spectrometerymass spectrometery
mass spectrometery
uog
 
Uv absorption spectroscopy
Uv absorption spectroscopyUv absorption spectroscopy
Uv absorption spectroscopy
KBHSSTrust's institute of Pharmacy
 
Mass 2021 2 (Electron impact)
Mass 2021 2 (Electron impact)Mass 2021 2 (Electron impact)
Mass 2021 2 (Electron impact)
Ahmed Metwaly
 
A handbook of_spectroscopic_data_chemistry
A handbook of_spectroscopic_data_chemistryA handbook of_spectroscopic_data_chemistry
A handbook of_spectroscopic_data_chemistry
valdolacerda
 
B mistry a handbook of spectroscopic data chemistry
B mistry a handbook of spectroscopic data chemistryB mistry a handbook of spectroscopic data chemistry
B mistry a handbook of spectroscopic data chemistry
Harem ahmed
 
Mass
MassMass
5- MS spectrum.pptx
5- MS spectrum.pptx5- MS spectrum.pptx
5- MS spectrum.pptx
DrHusseinAlganzory
 

Similar to MASS SPECTRO 3.ppt (20)

C:\Documents And Settings\Admin\Desktop\Mass
C:\Documents And Settings\Admin\Desktop\MassC:\Documents And Settings\Admin\Desktop\Mass
C:\Documents And Settings\Admin\Desktop\Mass
 
Chap 14 mass spec
Chap 14 mass specChap 14 mass spec
Chap 14 mass spec
 
mass spectroscopy
mass spectroscopymass spectroscopy
mass spectroscopy
 
2014, spectra massa
2014, spectra massa2014, spectra massa
2014, spectra massa
 
Effect of inorganic fillers on Poly(ethylene oxide) crystallization and dynamics
Effect of inorganic fillers on Poly(ethylene oxide) crystallization and dynamicsEffect of inorganic fillers on Poly(ethylene oxide) crystallization and dynamics
Effect of inorganic fillers on Poly(ethylene oxide) crystallization and dynamics
 
Fragmentation rules mass spectroscopy
Fragmentation rules mass spectroscopyFragmentation rules mass spectroscopy
Fragmentation rules mass spectroscopy
 
Uv visible spectroscopy
Uv visible spectroscopyUv visible spectroscopy
Uv visible spectroscopy
 
uv.pptx
uv.pptxuv.pptx
uv.pptx
 
Uvspectroscopyup 140119003106-phpapp01
Uvspectroscopyup 140119003106-phpapp01Uvspectroscopyup 140119003106-phpapp01
Uvspectroscopyup 140119003106-phpapp01
 
Mass spectrometry-cleavage pattern -organic
Mass spectrometry-cleavage pattern -organicMass spectrometry-cleavage pattern -organic
Mass spectrometry-cleavage pattern -organic
 
Isotope in ms (OAN MUHAMMAD SAHITO)
Isotope in ms (OAN MUHAMMAD SAHITO)Isotope in ms (OAN MUHAMMAD SAHITO)
Isotope in ms (OAN MUHAMMAD SAHITO)
 
Atomic Absorption Spectroscopy
Atomic Absorption Spectroscopy Atomic Absorption Spectroscopy
Atomic Absorption Spectroscopy
 
Uvspectroscopyup
UvspectroscopyupUvspectroscopyup
Uvspectroscopyup
 
mass spectrometery
mass spectrometerymass spectrometery
mass spectrometery
 
Uv absorption spectroscopy
Uv absorption spectroscopyUv absorption spectroscopy
Uv absorption spectroscopy
 
Mass 2021 2 (Electron impact)
Mass 2021 2 (Electron impact)Mass 2021 2 (Electron impact)
Mass 2021 2 (Electron impact)
 
A handbook of_spectroscopic_data_chemistry
A handbook of_spectroscopic_data_chemistryA handbook of_spectroscopic_data_chemistry
A handbook of_spectroscopic_data_chemistry
 
B mistry a handbook of spectroscopic data chemistry
B mistry a handbook of spectroscopic data chemistryB mistry a handbook of spectroscopic data chemistry
B mistry a handbook of spectroscopic data chemistry
 
Mass
MassMass
Mass
 
5- MS spectrum.pptx
5- MS spectrum.pptx5- MS spectrum.pptx
5- MS spectrum.pptx
 

Recently uploaded

The debris of the ‘last major merger’ is dynamically young
The debris of the ‘last major merger’ is dynamically youngThe debris of the ‘last major merger’ is dynamically young
The debris of the ‘last major merger’ is dynamically young
Sérgio Sacani
 
Mending Clothing to Support Sustainable Fashion_CIMaR 2024.pdf
Mending Clothing to Support Sustainable Fashion_CIMaR 2024.pdfMending Clothing to Support Sustainable Fashion_CIMaR 2024.pdf
Mending Clothing to Support Sustainable Fashion_CIMaR 2024.pdf
Selcen Ozturkcan
 
ESR spectroscopy in liquid food and beverages.pptx
ESR spectroscopy in liquid food and beverages.pptxESR spectroscopy in liquid food and beverages.pptx
ESR spectroscopy in liquid food and beverages.pptx
PRIYANKA PATEL
 
Micronuclei test.M.sc.zoology.fisheries.
Micronuclei test.M.sc.zoology.fisheries.Micronuclei test.M.sc.zoology.fisheries.
Micronuclei test.M.sc.zoology.fisheries.
Aditi Bajpai
 
The cost of acquiring information by natural selection
The cost of acquiring information by natural selectionThe cost of acquiring information by natural selection
The cost of acquiring information by natural selection
Carl Bergstrom
 
Direct Seeded Rice - Climate Smart Agriculture
Direct Seeded Rice - Climate Smart AgricultureDirect Seeded Rice - Climate Smart Agriculture
Direct Seeded Rice - Climate Smart Agriculture
International Food Policy Research Institute- South Asia Office
 
ESA/ACT Science Coffee: Diego Blas - Gravitational wave detection with orbita...
ESA/ACT Science Coffee: Diego Blas - Gravitational wave detection with orbita...ESA/ACT Science Coffee: Diego Blas - Gravitational wave detection with orbita...
ESA/ACT Science Coffee: Diego Blas - Gravitational wave detection with orbita...
Advanced-Concepts-Team
 
Farming systems analysis: what have we learnt?.pptx
Farming systems analysis: what have we learnt?.pptxFarming systems analysis: what have we learnt?.pptx
Farming systems analysis: what have we learnt?.pptx
Frédéric Baudron
 
Basics of crystallography, crystal systems, classes and different forms
Basics of crystallography, crystal systems, classes and different formsBasics of crystallography, crystal systems, classes and different forms
Basics of crystallography, crystal systems, classes and different forms
MaheshaNanjegowda
 
Randomised Optimisation Algorithms in DAPHNE
Randomised Optimisation Algorithms in DAPHNERandomised Optimisation Algorithms in DAPHNE
Randomised Optimisation Algorithms in DAPHNE
University of Maribor
 
waterlessdyeingtechnolgyusing carbon dioxide chemicalspdf
waterlessdyeingtechnolgyusing carbon dioxide chemicalspdfwaterlessdyeingtechnolgyusing carbon dioxide chemicalspdf
waterlessdyeingtechnolgyusing carbon dioxide chemicalspdf
LengamoLAppostilic
 
Applied Science: Thermodynamics, Laws & Methodology.pdf
Applied Science: Thermodynamics, Laws & Methodology.pdfApplied Science: Thermodynamics, Laws & Methodology.pdf
Applied Science: Thermodynamics, Laws & Methodology.pdf
University of Hertfordshire
 
AJAY KUMAR NIET GreNo Guava Project File.pdf
AJAY KUMAR NIET GreNo Guava Project File.pdfAJAY KUMAR NIET GreNo Guava Project File.pdf
AJAY KUMAR NIET GreNo Guava Project File.pdf
AJAY KUMAR
 
molar-distalization in orthodontics-seminar.pptx
molar-distalization in orthodontics-seminar.pptxmolar-distalization in orthodontics-seminar.pptx
molar-distalization in orthodontics-seminar.pptx
Anagha Prasad
 
Authoring a personal GPT for your research and practice: How we created the Q...
Authoring a personal GPT for your research and practice: How we created the Q...Authoring a personal GPT for your research and practice: How we created the Q...
Authoring a personal GPT for your research and practice: How we created the Q...
Leonel Morgado
 
Travis Hills of MN is Making Clean Water Accessible to All Through High Flux ...
Travis Hills of MN is Making Clean Water Accessible to All Through High Flux ...Travis Hills of MN is Making Clean Water Accessible to All Through High Flux ...
Travis Hills of MN is Making Clean Water Accessible to All Through High Flux ...
Travis Hills MN
 
8.Isolation of pure cultures and preservation of cultures.pdf
8.Isolation of pure cultures and preservation of cultures.pdf8.Isolation of pure cultures and preservation of cultures.pdf
8.Isolation of pure cultures and preservation of cultures.pdf
by6843629
 
Describing and Interpreting an Immersive Learning Case with the Immersion Cub...
Describing and Interpreting an Immersive Learning Case with the Immersion Cub...Describing and Interpreting an Immersive Learning Case with the Immersion Cub...
Describing and Interpreting an Immersive Learning Case with the Immersion Cub...
Leonel Morgado
 
(June 12, 2024) Webinar: Development of PET theranostics targeting the molecu...
(June 12, 2024) Webinar: Development of PET theranostics targeting the molecu...(June 12, 2024) Webinar: Development of PET theranostics targeting the molecu...
(June 12, 2024) Webinar: Development of PET theranostics targeting the molecu...
Scintica Instrumentation
 
HOW DO ORGANISMS REPRODUCE?reproduction part 1
HOW DO ORGANISMS REPRODUCE?reproduction part 1HOW DO ORGANISMS REPRODUCE?reproduction part 1
HOW DO ORGANISMS REPRODUCE?reproduction part 1
Shashank Shekhar Pandey
 

Recently uploaded (20)

The debris of the ‘last major merger’ is dynamically young
The debris of the ‘last major merger’ is dynamically youngThe debris of the ‘last major merger’ is dynamically young
The debris of the ‘last major merger’ is dynamically young
 
Mending Clothing to Support Sustainable Fashion_CIMaR 2024.pdf
Mending Clothing to Support Sustainable Fashion_CIMaR 2024.pdfMending Clothing to Support Sustainable Fashion_CIMaR 2024.pdf
Mending Clothing to Support Sustainable Fashion_CIMaR 2024.pdf
 
ESR spectroscopy in liquid food and beverages.pptx
ESR spectroscopy in liquid food and beverages.pptxESR spectroscopy in liquid food and beverages.pptx
ESR spectroscopy in liquid food and beverages.pptx
 
Micronuclei test.M.sc.zoology.fisheries.
Micronuclei test.M.sc.zoology.fisheries.Micronuclei test.M.sc.zoology.fisheries.
Micronuclei test.M.sc.zoology.fisheries.
 
The cost of acquiring information by natural selection
The cost of acquiring information by natural selectionThe cost of acquiring information by natural selection
The cost of acquiring information by natural selection
 
Direct Seeded Rice - Climate Smart Agriculture
Direct Seeded Rice - Climate Smart AgricultureDirect Seeded Rice - Climate Smart Agriculture
Direct Seeded Rice - Climate Smart Agriculture
 
ESA/ACT Science Coffee: Diego Blas - Gravitational wave detection with orbita...
ESA/ACT Science Coffee: Diego Blas - Gravitational wave detection with orbita...ESA/ACT Science Coffee: Diego Blas - Gravitational wave detection with orbita...
ESA/ACT Science Coffee: Diego Blas - Gravitational wave detection with orbita...
 
Farming systems analysis: what have we learnt?.pptx
Farming systems analysis: what have we learnt?.pptxFarming systems analysis: what have we learnt?.pptx
Farming systems analysis: what have we learnt?.pptx
 
Basics of crystallography, crystal systems, classes and different forms
Basics of crystallography, crystal systems, classes and different formsBasics of crystallography, crystal systems, classes and different forms
Basics of crystallography, crystal systems, classes and different forms
 
Randomised Optimisation Algorithms in DAPHNE
Randomised Optimisation Algorithms in DAPHNERandomised Optimisation Algorithms in DAPHNE
Randomised Optimisation Algorithms in DAPHNE
 
waterlessdyeingtechnolgyusing carbon dioxide chemicalspdf
waterlessdyeingtechnolgyusing carbon dioxide chemicalspdfwaterlessdyeingtechnolgyusing carbon dioxide chemicalspdf
waterlessdyeingtechnolgyusing carbon dioxide chemicalspdf
 
Applied Science: Thermodynamics, Laws & Methodology.pdf
Applied Science: Thermodynamics, Laws & Methodology.pdfApplied Science: Thermodynamics, Laws & Methodology.pdf
Applied Science: Thermodynamics, Laws & Methodology.pdf
 
AJAY KUMAR NIET GreNo Guava Project File.pdf
AJAY KUMAR NIET GreNo Guava Project File.pdfAJAY KUMAR NIET GreNo Guava Project File.pdf
AJAY KUMAR NIET GreNo Guava Project File.pdf
 
molar-distalization in orthodontics-seminar.pptx
molar-distalization in orthodontics-seminar.pptxmolar-distalization in orthodontics-seminar.pptx
molar-distalization in orthodontics-seminar.pptx
 
Authoring a personal GPT for your research and practice: How we created the Q...
Authoring a personal GPT for your research and practice: How we created the Q...Authoring a personal GPT for your research and practice: How we created the Q...
Authoring a personal GPT for your research and practice: How we created the Q...
 
Travis Hills of MN is Making Clean Water Accessible to All Through High Flux ...
Travis Hills of MN is Making Clean Water Accessible to All Through High Flux ...Travis Hills of MN is Making Clean Water Accessible to All Through High Flux ...
Travis Hills of MN is Making Clean Water Accessible to All Through High Flux ...
 
8.Isolation of pure cultures and preservation of cultures.pdf
8.Isolation of pure cultures and preservation of cultures.pdf8.Isolation of pure cultures and preservation of cultures.pdf
8.Isolation of pure cultures and preservation of cultures.pdf
 
Describing and Interpreting an Immersive Learning Case with the Immersion Cub...
Describing and Interpreting an Immersive Learning Case with the Immersion Cub...Describing and Interpreting an Immersive Learning Case with the Immersion Cub...
Describing and Interpreting an Immersive Learning Case with the Immersion Cub...
 
(June 12, 2024) Webinar: Development of PET theranostics targeting the molecu...
(June 12, 2024) Webinar: Development of PET theranostics targeting the molecu...(June 12, 2024) Webinar: Development of PET theranostics targeting the molecu...
(June 12, 2024) Webinar: Development of PET theranostics targeting the molecu...
 
HOW DO ORGANISMS REPRODUCE?reproduction part 1
HOW DO ORGANISMS REPRODUCE?reproduction part 1HOW DO ORGANISMS REPRODUCE?reproduction part 1
HOW DO ORGANISMS REPRODUCE?reproduction part 1
 

MASS SPECTRO 3.ppt

  • 1. FURTHER MASS SPECTROMETRY A guide for A level students KNOCKHARDY PUBLISHING 2015 SPECIFICATIONS ION SOURCE ANALYSER DETECTOR
  • 2. INTRODUCTION This Powerpoint show is one of several produced to help students understand selected topics at AS and A2 level Chemistry. It is based on the requirements of the AQA and OCR specifications but is suitable for other examination boards. Individual students may use the material at home for revision purposes or it may be used for classroom teaching if an interactive white board is available. Accompanying notes on this, and the full range of AS and A2 topics, are available from the KNOCKHARDY SCIENCE WEBSITE at... www.argonet.co.uk/users/hoptonj/sci.htm Navigation is achieved by... either clicking on the grey arrows at the foot of each page or using the left and right arrow keys on the keyboard MASS SPECTROMETRY KNOCKHARDY PUBLISHING
  • 3. CONTENTS • Fragmentation of molecular ions - theory • What a mass spectrum tells you • Molecular ions • Fragmentation • Mass spectra of alkanes • Mass spectra of halogenoalkanes • Mass spectra of aldehydes and ketones • Test questions • Check list MASS SPECTROMETRY
  • 4. Before you start it would be helpful to… • recall the basic principles of a mass spectrometer • know the different types of functional group in organic chemsitry MASS SPECTROMETRY
  • 5. IONISATION FRAGMENTION FRAGMENTION RE-ARRANGEMENT MOLECULAR MASS DETERMINATION USING MASS SPECTROMETRY Nowadays, mass spectrometry is used to identify unknown or new compounds. When a molecule is ionised it forms a MOLECULAR ION which can also undergo FRAGMENTATION or RE- ARRANGEMENT to produce particles of smaller mass. Only particles with a positive charge will be deflected and detected. The resulting spectrum has many peaks. The final peak (M+) shows the molecular ion (highest m/z value) and indicates the molecular mass. The rest of the spectrum provides information about the structure. MOLECULAR ION
  • 6. Spectra obtained for organic molecules have many peaks. Each peak is due to a particular fragment with a certain m/z value. highest m/z value usually corresponds to the molecular ion its position provides information about the molecular mass of a substance the tallest peaks come from the most stable species THE MASS SPECTRUM
  • 7. Spectra obtained for organic molecules have many peaks. Each peak is due to a particular fragment with a certain m/z value. highest m/z value usually corresponds to the molecular ion its position provides information about the molecular mass of a substance the tallest peaks come from the most stable species THE MASS SPECTRUM Interpretation of thousands of spectra has shown that many classes of organic compound show characteristic fragmentation patterns due to their functional groups. It is possible to identify the type of compound from its spectrum by looking at the ... position of peaks differences between major peaks
  • 8. In the spectrum of octane, a signal occurs at 114 due to the species C8H18 + THE MASS SPECTRUM - THE MOLECULAR ION 10 20 30 40 50 60 70 80 90 100 110 120 130 140 0 m/z 20 40 60 80 100 Abundance % 114 . The species due to the final signal is known as the molecular ion and is usually corresponds to the molecular mass of the compound. molecular ion
  • 9. THE MASS SPECTRUM - THE MOLECULAR ION The small peak (M+1) at 115 due to the natural abundance (about 1%) of carbon-13. The height of this peak relative to that for the molecular ion depends on the number of carbon atoms in the molecule. The more carbons present, the larger the M+1 peak. 10 20 30 40 50 60 70 80 90 100 110 120 130 140 0 m/z 20 40 60 80 100 Abundance % 114 .
  • 10. THE MASS SPECTRUM - FRAGMENTATION 10 20 30 40 50 60 70 80 90 100 110 120 130 140 0 m/z 20 40 60 80 100 Abundance % 29 71 43 57 114 85 . The rest of the spectrum provides additional information of the molecule’s structure. Peaks appear due to characteristic fragments (e.g. 29 due to C2H5 +) and differences between two peaks also indicates the loss of certain units (18 for H2O, 28 for CO).
  • 11. The mass spectra of simple hydrocarbons have peaks at m/z values corresponding to the ions produced by breaking C-C bonds. Peaks can occur at ... m/z 15 29 43 57 71 85 etc. CH3 + C2H5 + C3H7 + C4H9 + C5H11 + C6H13 + • the stability of the carbocation formed affects its abundance • the more stable the cation the higher the peak • the more alkyl groups attached to the carbocation the more stable it is most stable tertiary 3° > secondary 2° > primary 1° least stable alkyl groups are electron releasing and stabilise the cation ALKANES FRAGMENTATION PATTERNS
  • 12. HALOGENOALKANES FRAGMENTATION PATTERNS Multiple peaks occur in the molecular ion region due to different halogen isotopes. There are two peaks for the molecular ion of C2H5Br, one for the molecule containing the isotope 79Br and the other for the one with the 81Br isotope. Because the two isotopes are of similar abundance, the peaks are of similar height. 10 20 30 40 50 60 70 80 90 100 110 120 130 140 0 m/z 20 40 60 80 100 Abundance % molecular ion contains...79Br 81Br
  • 13. Cleavage of bonds next to the carbonyl group (C=O) is a characteristic fragmentation of aldehydes and ketones. A common fragment is carbon monoxide (CO) but as it is a molecule and thus uncharged it will not produce a peak of its own. However, it will produce an m/z drop of 28 somewhere in the spectrum. The position of the carbonyl group influences the fragmentation pattern because the molecular ion fragments either side of the carbonyl group the more stable the acylium ion RCO+, the more abundant it will be and the more abundant the species the taller its peak in the mass spectrum FRAGMENTATION PATTERNS ALDEHYDES AND KETONES
  • 14. The position of the carbonyl group influences the fragmentation pattern because the molecular ion fragments either side of the carbonyl group. FRAGMENTATION PATTERNS Aldehydes and ketones O CH3 C C4H9 MOLECULAR ION has m/z = 100 • +
  • 15. The position of the carbonyl group influences the fragmentation pattern because the molecular ion fragments either side of the carbonyl group. FRAGMENTATION PATTERNS Aldehydes and ketones O CH3 C C4H9 O C4H9 C+ CH3• O C4H9 C• CH3 + m/z = 15 m/z = 85 MOLECULAR ION has m/z = 100 Breaking the bond between the methyl group and the carbonyl group produces two possible ions, depending on how the bond breaks. Two peaks at m/z values 15 and 85 will appear in the mass spectrum. • +
  • 16. The position of the carbonyl group influences the fragmentation pattern because the molecular ion fragments either side of the carbonyl group. FRAGMENTATION PATTERNS Aldehydes and ketones O CH3 C C4H9 O CH3 C+ C4H9• O CH3 C• C4H9 + m/z = 57 m/z = 43 MOLECULAR ION has m/z = 100 • + Breaking the bond between the butyl group and the carbonyl group produces two further ions, depending on how the bond breaks. Two peaks at m/z values 43 and 57 will appear in the mass spectrum.
  • 17. The position of the carbonyl group influences the fragmentation pattern because the molecular ion fragments either side of the carbonyl group. FRAGMENTATION PATTERNS Aldehydes and ketones O CH3 C C4H9 O CH3 C+ C4H9• O CH3 C• C4H9 + m/z = 57 m/z = 43 O C4H9 C+ CH3• O C4H9 C• CH3 + m/z = 15 m/z = 85 MOLECULAR ION has m/z = 100 • + A further peak occurs at m/z = 72 (100-28) due to loss of CO Example; m/z = 28
  • 19. IDENTIFY THE COMPOUND 122 124 29 79 81 43 10 20 30 40 50 60 70 80 90 100 110 120 130 140 0 m/z Abundance % 20 40 60 80 100
  • 20. IDENTIFY THE COMPOUND 122 124 29 79 81 43 10 20 30 40 50 60 70 80 90 100 110 120 130 140 0 m/z Abundance % 20 40 60 80 100 C3H7Br
  • 21. IDENTIFY THE COMPOUND 120 28 77 43 51 105 10 20 30 40 50 60 70 80 90 100 110 120 130 140 0 m/z 20 40 60 80 100 Abundance %
  • 22. IDENTIFY THE COMPOUND 120 28 77 43 51 105 10 20 30 40 50 60 70 80 90 100 110 120 130 140 0 m/z 20 40 60 80 100 Abundance % C6H5COCH3
  • 23. IDENTIFY THE COMPOUND 0 28 105 106 77 57 43 51 10 20 30 40 50 60 70 80 90 100 110 120 130 140 m/z Abundance % 20 40 60 80 100
  • 24. IDENTIFY THE COMPOUND 0 28 105 106 77 57 43 51 10 20 30 40 50 60 70 80 90 100 110 120 130 140 m/z Abundance % 20 40 60 80 100 C6H5CHO
  • 25. IDENTIFY THE COMPOUND 0 142 113 71 56 57 43 10 20 30 40 50 60 70 80 90 100 110 120 130 140 m/z Abundance % 20 40 60 80 100
  • 26. IDENTIFY THE COMPOUND 0 142 113 71 56 57 43 10 20 30 40 50 60 70 80 90 100 110 120 130 140 m/z Abundance % 20 40 60 80 100 C10H22
  • 27. REVISION CHECK What should you be able to do? Understand how mass spectrometry can be used to calculate molecular mass Recall the term molecular ion and understand what information it provides Interpret simple mass spectra CAN YOU DO ALL OF THESE? YES NO
  • 28. You need to go over the relevant topic(s) again Click on the button to return to the menu
  • 29. WELL DONE! Try some past paper questions
  • 30. © 2015 JONATHAN HOPTON & KNOCKHARDY PUBLISHING FURTHER MASS SPECTROMETRY The End