
Recommended
More Related Content
What's hot
What's hot (20)
Viewers also liked
Similar to Aaj ka trend 17.10.16
Similar to Aaj ka trend 17.10.16 (20)
Recently uploaded
Recently uploaded (20)
Aaj ka trend 17.10.16
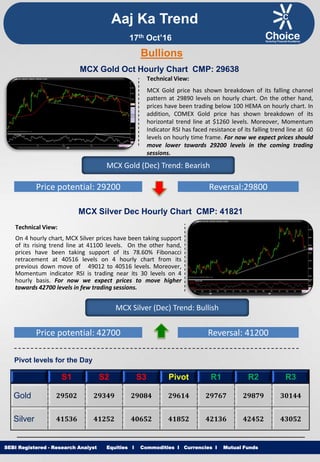
- 1. Equities I Commodities I Currencies I Mutual Funds Aaj Ka Trend Technical View: MCX Gold price has shown breakdown of its falling channel pattern at 29890 levels on hourly chart. On the other hand, prices have been trading below 100 HEMA on hourly chart. In addition, COMEX Gold price has shown breakdown of its horizontal trend line at $1260 levels. Moreover, Momentum Indicator RSI has faced resistance of its falling trend line at 60 levels on hourly time frame. For now we expect prices should move lower towards 29200 levels in the coming trading sessions. SEBI Registered - Research Analyst Equities I Commodities I Currencies I Mutual Funds Bullions MCX Gold Oct Hourly Chart CMP: 29638 MCX Gold (Dec) Trend: Bearish Price potential: 29200 Reversal:29800 MCX Silver Dec Hourly Chart CMP: 41821 Technical View: On 4 hourly chart, MCX Silver prices have been taking support of its rising trend line at 41100 levels. On the other hand, prices have been taking support of its 78.60% Fibonacci retracement at 40516 levels on 4 hourly chart from its previous down move of 49012 to 40516 levels. Moreover, Momentum indicator RSI is trading near its 30 levels on 4 hourly basis. For now we expect prices to move higher towards 42700 levels in few trading sessions. MCX Silver (Dec) Trend: Bullish Price potential: 42700 Reversal: 41200 Pivot levels for the Day S1 S2 S3 Pivot R1 R2 R3 Gold 29502 29349 29084 29614 29767 29879 30144 Silver 41536 41252 40652 41852 42136 42452 43052 17th Oct’16
- 2. Equities I Commodities I Currencies I Mutual Funds Technical View: On hourly chart MCX Copper has given breakdown of its rising trend line at 324 levels. MCX Copper price have been trading in symmetrical pattern form past 1 year and 7 months. In addition, prices have been trading below its 100 DEMA, which suggest medium term remains weak. Moreover, momentum indicator RSI has been trading below 60 levels on daily time frame. In addition, Momentum indicator RSI is trading below 60 levels on hourly basis. For now we expect prices to move lower towards 310 levels in coming trading sessions. SEBI Registered - Research Analyst Equities I Commodities I Currencies I Mutual Funds MCX Copper Nov hourly Chart CMP: 313.05 MCX Copper (Nov) Trend: Bearish Price potential: 308 Reversal: 317 MCX Crude Oil Oct. Hourly Chart CMP: 3339 Technical View: MCX Crude Oil prices have been facing resistance at 3446 levels on 4 hourly chart. On the other hand MCX Crude oil has shown breakdown of its symmetrical triangle pattern at 3360 levels on hourly chart. Moreover, Momentum indicator RSI has shown negative divergence on 4 hourly chart. Furthermore, momentum indicator MACD has shown negative crossover on hourly chart. 50 levels on hourly basis. For now we expect prices to move lower towards 3250 levels in coming trading sessions. MCX Crude Oil (Oct) Trend: Bearish Price potential: 3240 Reversal: 3398 Pivot levels for the Day S1 S2 S3 Pivot R1 R2 R3 Copper 311.4 309.8 305.3 314.3 315.9 318.8 323.3 Crude 3306 3274 3187 3361 3393 3448 3535 Base Metal Energy Aaj Ka Trend 17th Oct’16
- 3. Equities I Commodities I Currencies I Mutual FundsSEBI Registered - Research Analyst Equities I Commodities I Currencies I Mutual Funds Other Base Metals & Energy S1 S2 S3 Pivot R1 R2 R3 Trend Copper 311.4 309.8 305.3 314.3 315.9 318.8 323.3 Aluminum 110.5 109.8 107.8 111.7 112.4 113.7 115.6 Lead 132.2 131.4 129.6 133.2 134.0 135.0 136.8 Nickel 694.6 691.3 685.8 696.8 700.1 702.3 707.8 Zinc 149.3 148.1 146.0 150.3 151.5 152.4 154.6 Natural Gas 224.1 217.6 210.9 224.3 230.8 231.0 237.7 Fundamental News: U.S. consumer sentiment unexpectedly fell in October, hitting more than a one-year low and underlining concern over the wider economy, according to a report published on Friday. The preliminary publication of the data for October from the University of Michigan's Consumer Survey Center showed that consumer sentiment unexpectedly declined to 87.9 from 91.2 in September. That was its lowest reading since September 2015. Producer price inflation in the U.S. increased more than forecast in September, while core prices also rose slightly more than expected, official data showed on Friday. In a report, the Commerce Department said that producer prices increased by a seasonally adjusted 0.3% last month, better than the forecast for a 0.2% advance and after a flat reading in August. Core prices are viewed by the Federal Reserve as a better gauge of longer-term inflationary pressure because they exclude the volatile food and energy categories. Furthermore, when producers pay more for goods, they are more likely to pass price increases on to the consumer, so PPI could be considered a leading indicator of inflation. Oil slipped below $52 a barrel on Friday, giving up an earlier gain, as abundant crude supplies outweighed tighter U.S. fuel inventories and OPEC's plans to cut output. Brent crude reached a 2016 high near $54 on Monday, underpinned by OPEC's Sept. 28 deal to reduce oil production, before weakening on rising U.S. crude stocks and as the Organization of the Petroleum Exporting Countries' own numbers showed output is still rising. U.S. crude inventories overall rose by 4.9 million barrels, the first increase in six weeks, the government's Energy Information Administration reported on Thursday. Aaj Ka Trend 17th Oct’16
- 4. Equities I Commodities I Currencies I Mutual FundsSEBI Registered - Research Analyst Equities I Commodities I Currencies I Mutual Funds International Market Commodity Closing Price Gold 1251.60 Silver 14.25 Crude Oil 50.32 Brent Crude Oil 52.02 Natural Gas 3.28 COMEX/NYMEX/ICE ( Precious Metals & Energy) Currency & Commodity Index Currency (Spot) Current Price USD / INR 66.71 Dollar Index 98.08 EUR / USD 1.09 CRB Index* 189.46 Closing as on 14.10.16 *Closing as on 14.10.16 LME (Base Metals) ( $ per tones) Commodity Closing Price Copper 4675 Aluminum 1675 Zinc 2258 Lead 1998 Nickel 10485 SHFE (Base Metals) (Yuan per tones) Commodity Closing Price Copper 37200 Aluminum 12754 Zinc 17965 Lead 15110 Closing as on 14.10.16 Closing as on 14.10.16 LME INVENTORY DATA Aaj Ka Trend 07-Oct-16 10-Oct-16 12-Oct-16 13-Oct-16 14-Oct-16 Aluminium -7478 -6700 -7301 -9952 -10000 Copper -4424 -4626 -1498 -1658 2925 Lead 26 -149 -677 -151 0 Nickel -277 548 -254 -446 612 Zinc -202 -152 -349 -526 -375 17th Oct’16
- 5. Equities I Commodities I Currencies I Mutual Funds This is solely for information of clients of Choice Broking and does not construe to be an investment advice. It is also not intended as an offer or solicitation for the purchase and sale of any financial instruments. Any action taken by you on the basis of the information contained herein is your responsibility alone and Choice Broking its subsidiaries or its employees or associates will not be liable in any manner for the consequences of such action taken by you. We have exercised due diligence in checking the correctness and authenticity of the information contained in this recommendation, but Choice Broking or any of its subsidiaries or associates or employees shall not be in any way responsible for any loss or damage that may arise to any person from any inadvertent error in the information contained in this recommendation or any action taken on basis of this information. Technical analysis studies market psychology, price patterns and volume levels. It is used to forecast future price and market movements. Technical analysis is complementary to fundamental analysis and news sources. The recommendations issued herewith might be contrary to recommendations issued by Choice Broking in the company research undertaken as the recommendations stated in this report is derived purely from technical analysis. Choice Broking has based this document on information obtained from sources it believes to be reliable but which it has not independently verified; Choice Broking makes no guarantee, representation or warranty and accepts no responsibility or liability as to its accuracy or completeness. The opinions contained within the report are based upon publicly available information at the time of publication and are subject to change without notice. The information and any disclosures provided herein are in summary form and have been prepared for informational purposes. The recommendations and suggested price levels are intended purely for trading purposes. The recommendations are valid for the day of the report however trading trends and volumes might vary substantially on an intraday basis and the recommendations may be subject to change. The information and any disclosures provided herein may be considered confidential. Any use, distribution, modification, copying, forwarding or disclosure by any person is strictly prohibited. The information and any disclosures provided herein do not constitute a solicitation or offer to purchase or sell any security or other financial product or instrument. The current performance may be unaudited. Past performance does not guarantee future returns. There can be no assurance that investments will achieve any targeted rates of return, and there is no guarantee against the loss of your entire investment. POTENTIAL CONFLICT OF INTEREST DISCLOSURE (as on date of report) Disclosure of interest statement – • Analyst interest of the stock /Instrument(s): - No. • Firm interest of the stock / Instrument (s): - No. Disclaimer Contact Us Amit Pathania Research Associate amit.pathania@choiceindia.com Rohan Patil Research Associate rohan.patil@choiceindia.com www.choicebroking.incustomercare@choiceindia.com SEBI Registered - Research Analyst Equities I Commodities I Currencies I Mutual Funds Aaj Ka Trend 17th Oct’16 Neeraj Yadav Research Advisor neeraj.yadav@choiceindia.com Anish Vyas Senior Research Associate anish.vyas@choiceindia.com Amit Pathania Digitally signed by Amit Pathania DN: cn=Amit Pathania, o=Choice Equity Broking Pvt. ltd, ou=Research Department, email=amit.pathania@choiceindia.com, c=IN Date: 2016.10.15 12:31:40 +05'30'