
Recommended
More Related Content
What's hot
What's hot (20)
Similar to Aaj ka trend 15.06.16
Similar to Aaj ka trend 15.06.16 (20)
Recently uploaded
Recently uploaded (20)
Aaj ka trend 15.06.16
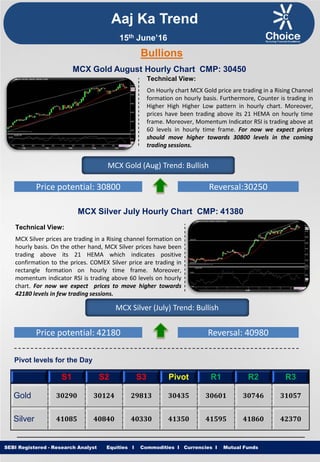
- 1. Equities I Commodities I Currencies I Mutual Funds Aaj Ka Trend Technical View: On Hourly chart MCX Gold price are trading in a Rising Channel formation on hourly basis. Furthermore, Counter is trading in Higher High Higher Low pattern in hourly chart. Moreover, prices have been trading above its 21 HEMA on hourly time frame. Moreover, Momentum Indicator RSI is trading above at 60 levels in hourly time frame. For now we expect prices should move higher towards 30800 levels in the coming trading sessions. SEBI Registered - Research Analyst Equities I Commodities I Currencies I Mutual Funds Bullions MCX Gold August Hourly Chart CMP: 30450 MCX Gold (Aug) Trend: Bullish Price potential: 30800 Reversal:30250 MCX Silver July Hourly Chart CMP: 41380 Technical View: MCX Silver prices are trading in a Rising channel formation on hourly basis. On the other hand, MCX Silver prices have been trading above its 21 HEMA which indicates positive confirmation to the prices. COMEX Silver price are trading in rectangle formation on hourly time frame. Moreover, momentum indicator RSI is trading above 60 levels on hourly chart. For now we expect prices to move higher towards 42180 levels in few trading sessions. MCX Silver (July) Trend: Bullish Price potential: 42180 Reversal: 40980 Pivot levels for the Day S1 S2 S3 Pivot R1 R2 R3 Gold 30290 30124 29813 30435 30601 30746 31057 Silver 41085 40840 40330 41350 41595 41860 42370 15th June’16
- 2. Equities I Commodities I Currencies I Mutual Funds Technical View: MCX Copper prices are trading in a symmetrical triangle formation on hourly chart. Furthermore, prices have been trading below its 60 HEMA on hourly chart. On the other hand, COMEX Copper price has shown breakdown of its horizontal trend line at $2.04 levels. On the other hand, momentum indicator RSI has hold its resistance of 60 levels on hourly chart. For now we expect prices to move lower towards 296 levels in coming trading sessions. SEBI Registered - Research Analyst Equities I Commodities I Currencies I Mutual Funds MCX Copper June hourly Chart CMP: 304 MCX Copper (June) Trend: Bearish Price potential: 296 Reversal: 309 MCX Crude Oil June. Hourly Chart CMP: 3255 Technical View: On Hourly chart MCX Crude Oil prices have given breakdown of its Rising trend line support at 3255 levels. On the other hand prices have been trading below its 21 HEMA on MCX Crude Oil hourly chart. NYMEX WTI Crude oil prices have breached its horizontal trend line support at $48.60 levels. Moreover, Momentum indicator RSI has drift below 50 levels on hourly chart. For now we expect prices to move lower towards 3165 levels in coming trading sessions. MCX Crude Oil (June) Trend: Bearish Price potential: 3165 Reversal: 3305 Pivot levels for the Day S1 S2 S3 Pivot R1 R2 R3 Copper 302.4 301.3 298.4 304.2 305.3 307.1 310.0 Crude 3235 3215 3175 3255 3275 3295 3335 Base Metal Energy Aaj Ka Trend 15th June’16
- 3. Equities I Commodities I Currencies I Mutual FundsSEBI Registered - Research Analyst Equities I Commodities I Currencies I Mutual Funds Other Base Metals & Energy S1 S2 S3 Pivot R1 R2 R3 Trend Copper 302.4 301.3 298.4 304.2 305.3 307.1 310.0 Aluminum 107.0 106.2 104.9 107.6 108.4 108.9 110.3 Lead 113.1 112.4 110.6 114.3 115.0 116.1 118.0 Nickel 593.3 589.9 583.5 596.3 599.7 602.7 609.1 Zinc 134.8 133.8 130.9 136.7 137.7 139.6 142.5 Natural Gas 171.4 168.8 164.0 173.6 176.2 178.4 183.2 Fundamental News: Gold prices dipped in Asia on Tuesday as investors turned cautious after recent gains linked to expectations of steady interest rates in the U.S. and an uncertain outlook for Britain remaining in the European Union. Gold futures were lower in European trade on Tuesday, after climbing to a four-week high in the prior session, as investors readjusted positions ahead of the Federal Reserve's two-day monetary policy meeting due to begin later in the day. Gold futures were little changed in North American trade on Tuesday, holding near the prior session’s four- week high, as investors looked ahead to the Federal Reserve’s policy meeting and the upcoming U.K. vote on whether to leave the European Union. Oil prices extended overnight losses in European trade on Tuesday, slumping to two-week lows as global concerns over a Brexit weighed on appetite for riskier assets. Oil futures prices fell over 1% on Tuesday as concerns over the prospect of Brexit fueled concerns about global economic weakness. Oil prices were under pressure in North American trade on Tuesday, dropping to the lowest level in almost two weeks on worries Britain may leave the European Union in a referendum less than 10 days away. Oil prices fell for a fourth straight day on Tuesday, swept lower by investor nervousness over Britain's vote next week on whether to leave the European Union, which overshadowed signs of a return to health for crude markets. U.S. natural gas futures held near the prior session’s nine-month highs on Tuesday, as forecasts for continued above-normal temperatures across most parts of the U.S. over the next two weeks continued to provide support. Aaj Ka Trend 15th June’16
- 4. Equities I Commodities I Currencies I Mutual FundsSEBI Registered - Research Analyst Equities I Commodities I Currencies I Mutual Funds International Market Commodity Closing Price Gold 1276.10 Silver 17.34 Crude Oil 48.91 Brent Crude Oil 50.45 Natural Gas 2.57 COMEX/NYMEX/ICE ( Precious Metals & Energy) Currency & Commodity Index Currency (Spot) Current Price USD / INR 66.95 Dollar Index 94.65 EUR / USD 1.12 CRB Index* 192.88 Closing as on 14.06.16 *Closing as on 14.06.16 LME (Base Metals) ( $ per tones) Commodity Closing Price Copper 4514 Aluminum 1599 Zinc 1996 Lead 1687 Nickel 8935 SHFE (Base Metals) (Yuan per tones) Commodity Closing Price Copper 35550 Aluminum 12200 Zinc 15800 Lead 12725 Closing as on 14.06.16 Closing as on 14.06.16 LME INVENTORY DATA Aaj Ka Trend 08-June-16 09-June-16 10-June-16 13-June-16 14-June-16 Aluminium -6650 -6700 -7400 -5375 -7025 Copper 11075 5925 -2550 -3050 -4350 Lead -25 -768 -25 -930 -25 Nickel -984 550 -84 -84 -3072 Zinc 3075 -1250 -500 -325 -4000 15th June’16
- 5. Equities I Commodities I Currencies I Mutual Funds This is solely for information of clients of Choice Broking and does not construe to be an investment advice. It is also not intended as an offer or solicitation for the purchase and sale of any financial instruments. Any action taken by you on the basis of the information contained herein is your responsibility alone and Choice Broking its subsidiaries or its employees or associates will not be liable in any manner for the consequences of such action taken by you. We have exercised due diligence in checking the correctness and authenticity of the information contained in this recommendation, but Choice Broking or any of its subsidiaries or associates or employees shall not be in any way responsible for any loss or damage that may arise to any person from any inadvertent error in the information contained in this recommendation or any action taken on basis of this information. Technical analysis studies market psychology, price patterns and volume levels. It is used to forecast future price and market movements. Technical analysis is complementary to fundamental analysis and news sources. The recommendations issued herewith might be contrary to recommendations issued by Choice Broking in the company research undertaken as the recommendations stated in this report is derived purely from technical analysis. Choice Broking has based this document on information obtained from sources it believes to be reliable but which it has not independently verified; Choice Broking makes no guarantee, representation or warranty and accepts no responsibility or liability as to its accuracy or completeness. The opinions contained within the report are based upon publicly available information at the time of publication and are subject to change without notice. The information and any disclosures provided herein are in summary form and have been prepared for informational purposes. The recommendations and suggested price levels are intended purely for trading purposes. The recommendations are valid for the day of the report however trading trends and volumes might vary substantially on an intraday basis and the recommendations may be subject to change. The information and any disclosures provided herein may be considered confidential. Any use, distribution, modification, copying, forwarding or disclosure by any person is strictly prohibited. The information and any disclosures provided herein do not constitute a solicitation or offer to purchase or sell any security or other financial product or instrument. The current performance may be unaudited. Past performance does not guarantee future returns. There can be no assurance that investments will achieve any targeted rates of return, and there is no guarantee against the loss of your entire investment. POTENTIAL CONFLICT OF INTEREST DISCLOSURE (as on date of report) Disclosure of interest statement – • Analyst interest of the stock /Instrument(s): - No. • Firm interest of the stock / Instrument (s): - No. Disclaimer Contact Us Amit Pathania Research Associate amit.pathania@choiceindia.com Rohan Patil Research Associate rohan.patil@choiceindia.com www.choiceindia.comcustomercare@choiceindia.com SEBI Registered - Research Analyst Equities I Commodities I Currencies I Mutual Funds Aaj Ka Trend 15th June’16 Neeraj Yadav Research Advisor neeraj.yadav@choiceindia.com Anish Vyas Senior Research Associate anish.vyas@choiceindia.com Amit Pathania Digitally signed by Amit Pathania DN: cn=Amit Pathania, o=Choice Equity Broking Pvt. ltd, ou=Research Department, email=amit.pathania@choiceindia.com, c=IN Date: 2016.06.15 08:46:23 +05'30'