
Recommended
More Related Content
What's hot
What's hot (20)
Similar to Currency high lights 12.08.16
Similar to Currency high lights 12.08.16 (20)
Recently uploaded
Recently uploaded (20)
Currency high lights 12.08.16
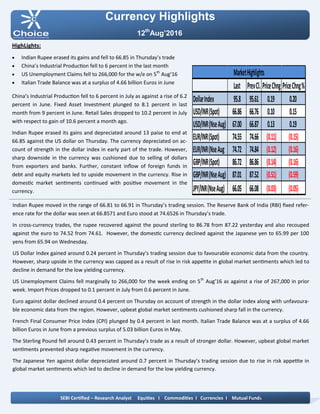
- 1. Currency Highlights 12th Aug’2016 HighLights: Indian Rupee erased its gains and fell to 66.85 in Thursday’s trade China’s Industrial Production fell to 6 percent in the last month US Unemployment Claims fell to 266,000 for the w/e on 5th Aug’16 Italian Trade Balance was at a surplus of 4.66 billion Euros in June China’s Industrial Production fell to 6 percent in July as against a rise of 6.2 percent in June. Fixed Asset Investment plunged to 8.1 percent in last month from 9 percent in June. Retail Sales dropped to 10.2 percent in July with respect to gain of 10.6 percent a month ago. Indian Rupee erased its gains and depreciated around 13 paise to end at 66.85 against the US dollar on Thursday. The currency depreciated on ac- count of strength in the dollar index in early part of the trade. However, sharp downside in the currency was cushioned due to selling of dollars from exporters and banks. Further, constant inflow of foreign funds in debt and equity markets led to upside movement in the currency. Rise in domestic market sentiments continued with positive movement in the currency. Indian Rupee moved in the range of 66.81 to 66.91 in Thursday’s trading session. The Reserve Bank of India (RBI) fixed refer- ence rate for the dollar was seen at 66.8571 and Euro stood at 74.6526 in Thursday’s trade. In cross-currency trades, the rupee recovered against the pound sterling to 86.78 from 87.22 yesterday and also recouped against the euro to 74.52 from 74.61. However, the domestic currency declined against the Japanese yen to 65.99 per 100 yens from 65.94 on Wednesday. US Dollar Index gained around 0.24 percent in Thursday’s trading session due to favourable economic data from the country. However, sharp upside in the currency was capped as a result of rise in risk appetite in global market sentiments which led to decline in demand for the low yielding currency. US Unemployment Claims fell marginally to 266,000 for the week ending on 5th Aug’16 as against a rise of 267,000 in prior week. Import Prices dropped to 0.1 percent in July from 0.6 percent in June. Euro against dollar declined around 0.4 percent on Thursday on account of strength in the dollar index along with unfavoura- ble economic data from the region. However, upbeat global market sentiments cushioned sharp fall in the currency. French Final Consumer Price Index (CPI) plunged by 0.4 percent in last month. Italian Trade Balance was at a surplus of 4.66 billion Euros in June from a previous surplus of 5.03 billion Euros in May. The Sterling Pound fell around 0.43 percent in Thursday’s trade as a result of stronger dollar. However, upbeat global market sentiments prevented sharp negative movement in the currency. The Japanese Yen against dollar depreciated around 0.7 percent in Thursday’s trading session due to rise in risk appetite in global market sentiments which led to decline in demand for the low yielding currency. SEBI Certified – Research Analyst Equities I Commodities I Currencies I Mutual Funds Last PrevCl. PriceChng PriceChng% DollarIndex 95.8 95.61 0.19 0.20 USD/INR(Spot) 66.86 66.76 0.10 0.15 USD/INR(NseAug) 67.00 66.87 0.13 0.19 EUR/INR(Spot) 74.55 74.66 (0.11) (0.15) EUR/INR(NseAug 74.72 74.84 (0.12) (0.16) GBP/INR(Spot) 86.72 86.86 (0.14) (0.16) GBP/INR(NseAug) 87.01 87.52 (0.51) (0.59) JPY/INR(NseAug) 66.05 66.08 (0.03) (0.05) MarketHighlights
- 2. Technical View: The price has taken support of its rising trend line at 64.50 levels on daily chart. The pair has been trading in rising chan- nel pattern and price has taken support of its lower band of channel pattern at 63.40 levels on daily chart. Price has formed bullish inverted hammer candle stick pattern with ap- pealing volumes which is bullish reversal pattern. However, prices have been facing resistance of 66.40 levels on daily chart. Any major movement can been seen after breakout of falling trend line at 66.50 levels. In addition, on daily chart prices have been trading above its 21 daily exponential moving average which gives the bullish confirmation to the prices. On daily chart, momentum oscillator RSI has moved above 60 levels, which gives positive confirmation to the prices. A momentum indicator MACD has shown positive crossover on daily chart, which indicates further bullishness in the pric- es. Pivot levels for the Day Technical View: The price has given breakdown of rising channel pattern at 67.10 levels on daily chart. On the other hand prices have been facing resistance of its horizontal trend line at 67.20 levels on daily chart. Moreover, price have been trading below its 21 daily expo- nential moving average which suggest short term trend is bearish. So any rally in the prices towards 67 level, used as selling opportunity. A momentum indicator RSI has moved below 45 levels on daily chart, which suggest bearishness in the prices. A momentum indictor MACD has given negative crossover on daily chart, which gives negative confirmation to the pric- es. For now we expect prices to move lower towards 66.55 lev- els in few trading sessions. Currency Highlights 12th Aug’2016 USDINR JPYINR SEBI Certified – Research Analyst Equities I Commodities I Currencies I Mutual Funds S3 S2 S1 Pivot R1 R2 R3 USDINR 66.78 66.89 66.95 67.00 67.06 67.11 67.22 JPYINR 65.71 65.90 65.99 66.09 66.18 66.28 66.47
- 3. Pivot levels for the Day Currency Highlights 12th Aug’2016 GBPINR EURINR Technical View: The prices have been trading in descending triangle pattern from past few weeks and prices has faced resistance of its upper band of triangle pattern at 77 levels on daily chart. On the other hand, Pair has been trading below its 21 daily exponential moving average which indicates that trend is remains down. A momentum oscillator RSI have been trading below 50 lev- els on daily chart which gives the signs of bullishness to the prices. Moreover, momentum indicator MACD has shown negative sign on daily chart which support our bearish view on the pair. For now we expect prices should move lower towards 73.90 levels in the coming trading sessions. Technical View: The price has given breakdown of its symmetrical triangle pattern at 88.50 levels on daily chart. Price has also given the breakdown of its consolidation range of 89.50 to 88.50levels on hourly chart. The price has formed Bearish candle on daily with appalling volumes which indicates further down side movement can be seen. A momentum indicator RSI has moved below at 45 levels on hourly chart, which suggest bearishness in the prices. Moreover, momentum indicator MACD has shown negative crossover on 4 hourly chart which support our bearish view on the pair. For now we expect prices should move lower towards 86.50 levels in the coming trading sessions. SEBI Certified – Research Analyst Equities I Commodities I Currencies I Mutual Funds S3 S2 S1 Pivot R1 R2 R3 GBPINR 86.04 86.54 86.79 87.04 87.29 87.54 88.04 EURINR 74.18 74.48 74.60 74.78 74.90 75.08 75.38
- 4. Currency Highlights SEBI Certified – Research Analyst Equities I Commodities I Currencies I Mutual Funds Economic Indicators Date Time Data Prior Expected Impact 12.08.16 7:30 AM Industrial Production y/y 6.2% 6.2% Actual > Forecast = Good for Yuan 12.08.16 7:30 AM Fixed Asset Investment ytd/y 9.0% 8.9% Actual > Forecast = Good for Yuan 12.08.16 11:30 AM German Prelim GDP q/q 0.7% 0.3% Actual > Forecast = Good for currency; EURINR 12.08.16 2:30 PM Flash GDP q/q 0.3% 0.3% Actual > Forecast = Good for currency; EURINR 12.08.16 6:00 PM Core Retail Sales m/m 0.7% 0.2% Actual > Forecast = Good for currency; USDINR 12.08.16 6:00 PM PPI m/m 0.5% 0.1% Actual > Forecast = Good for currency; USDINR 12.08.16 6:00 PM Retail Sales m/m 0.6% 0.4% Actual > Forecast = Good for currency; USDINR 12.08.16 6:00 PM Core PPI m/m 0.4% 0.2% Actual > Forecast = Good for currency; USDINR 12.08.16 7:30 PM Prelim UoM Consumer Senti- ment 90.0 91.5 Actual > Forecast = Good for currency; USDINR 12th Aug’2016
- 5. Currency Highlights 12th Aug’2016 SEBI Certified – Research Analyst Equities I Commodities I Currencies I Mutual Funds Amit Pathania Digitally signed by Amit Pathania DN: cn=Amit Pathania, o=Choice Equity Broking Pvt. ltd, ou=Research Department, email=amit.pathania@choiceindia.com, c=IN Date: 2016.08.12 08:55:28 +05'30'