
Recommended
More Related Content
What's hot
What's hot (20)
Viewers also liked
Viewers also liked (20)
Similar to Currency high lights 27.10.16
Similar to Currency high lights 27.10.16 (15)
Recently uploaded
Recently uploaded (20)
Currency high lights 27.10.16
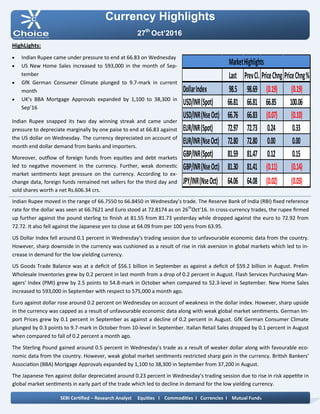
- 1. Currency Highlights 27th Oct’2016 HighLights: Indian Rupee came under pressure to end at 66.83 on Wednesday US New Home Sales increased to 593,000 in the month of Sep- tember GfK German Consumer Climate plunged to 9.7-mark in current month UK’s BBA Mortgage Approvals expanded by 1,100 to 38,300 in Sep’16 Indian Rupee snapped its two day winning streak and came under pressure to depreciate marginally by one paise to end at 66.83 against the US dollar on Wednesday. The currency depreciated on account of month end dollar demand from banks and importers. Moreover, outflow of foreign funds from equities and debt markets led to negative movement in the currency. Further, weak domestic market sentiments kept pressure on the currency. According to ex- change data, foreign funds remained net sellers for the third day and sold shares worth a net Rs.606.34 crs. Indian Rupee moved in the range of 66.7550 to 66.8450 in Wednesday’s trade. The Reserve Bank of India (RBI) fixed reference rate for the dollar was seen at 66.7621 and Euro stood at 72.8174 as on 26th Oct’16. In cross-currency trades, the rupee firmed up further against the pound sterling to finish at 81.55 from 81.73 yesterday while dropped against the euro to 72.92 from 72.72. It also fell against the Japanese yen to close at 64.09 from per 100 yens from 63.95. US Dollar Index fell around 0.1 percent in Wednesday’s trading session due to unfavourable economic data from the country. However, sharp downside in the currency was cushioned as a result of rise in risk aversion in global markets which led to in- crease in demand for the low yielding currency. US Goods Trade Balance was at a deficit of $56.1 billion in September as against a deficit of $59.2 billion in August. Prelim Wholesale Inventories grew by 0.2 percent in last month from a drop of 0.2 percent in August. Flash Services Purchasing Man- agers' Index (PMI) grew by 2.5 points to 54.8-mark in October when compared to 52.3-level in September. New Home Sales increased to 593,000 in September with respect to 575,000 a month ago. Euro against dollar rose around 0.2 percent on Wednesday on account of weakness in the dollar index. However, sharp upside in the currency was capped as a result of unfavourable economic data along with weak global market sentiments. German Im- port Prices grew by 0.1 percent in September as against a decline of 0.2 percent in August. GfK German Consumer Climate plunged by 0.3 points to 9.7-mark in October from 10-level in September. Italian Retail Sales dropped by 0.1 percent in August when compared to fall of 0.2 percent a month ago. The Sterling Pound gained around 0.5 percent in Wednesday’s trade as a result of weaker dollar along with favourable eco- nomic data from the country. However, weak global market sentiments restricted sharp gain in the currency. British Bankers' Association (BBA) Mortgage Approvals expanded by 1,100 to 38,300 in September from 37,200 in August. The Japanese Yen against dollar depreciated around 0.23 percent in Wednesday’s trading session due to rise in risk appetite in global market sentiments in early part of the trade which led to decline in demand for the low yielding currency. SEBI Certified – Research Analyst Equities I Commodities I Currencies I Mutual Funds Last PrevCl. PriceChng PriceChng% DollarIndex 98.5 98.69 (0.19) (0.19) USD/INR(Spot) 66.81 66.81 66.85 100.06 USD/INR(NseOct) 66.76 66.83 (0.07) (0.10) EUR/INR(Spot) 72.97 72.73 0.24 0.33 EUR/INR(NseOct) 72.80 72.80 0.00 0.00 GBP/INR(Spot) 81.59 81.47 0.12 0.15 GBP/INR(NseOct) 81.30 81.41 (0.11) (0.14) JPY/INR(NseOct) 64.06 64.08 (0.02) (0.03) MarketHighlights
- 2. Technical View: On daily chart JPYINR prices have been trading in sym- metrical triangle pattern and shown breakdown of its symmetrical triangle pattern. However, price has formed bearish candle stick on daily chart. Moreover, price has shown breakdown of its rising trend line at 65 levels. On the other hand price has shown breakdown of its rising trend line at 65.60 levels on daily chart. Furthermore, prices have been trading below its 21 DE- MA, which suggest short term trend is negative. On daily chart momentum indicator RSI is trading below at 45 levels which suggest further weakness in the pric- es. So for trading perspective, one could use sell in the range of 64.10 with SL of 64.45 for target of 63.40 levels. Pivot levels for the Day Technical View: The pair has been trading in falling wedge pattern from past few months and prices have been facing resistance of its upper band at 67 levels. On daily USDINR prices have been trading in falling channel formation from past few weeks and prices have been facing resistance at up- per band of channel pattern at 67.05 levels. On the other hand, prices have been facing resistance of horizontal trend line at 66.95 levels on daily chart. Moreover, prices have been trading below 50 DEMA which gives the sign of bearishness in the prices. A momentum indictor RSI has traded below 60 levels, which suggest further weakness in the prices. In addition, momentum indicator MACD has shown neg- ative crossover on daily chart. So for trading perspective, one could sell in range 66.95 with SL of 67.25 for target of 66.30. Currency Highlights 27th Oct’2016 USDINR JPYINR SEBI Certified – Research Analyst Equities I Commodities I Currencies I Mutual Funds S3 S2 S1 Pivot R1 R2 R3 USDINR 66.60 66.69 66.73 66.78 66.82 66.87 66.96 JPYINR 63.84 63.95 64.00 64.06 64.11 64.17 64.28
- 3. Pivot levels for the Day Currency Highlights 27th Oct’2016 GBPINR EURINR Technical View: The EURINR pair has shown breakdown of its descend- ing triangle pattern at 74 levels on daily chart. On the other hand price has shown breakdown of its symmet- rical triangle pattern at 74.80 levels on daily chart. Moreover, prices have been trading below its 21 DE- MA, which suggest short term trend is down. The pair has shown breakdown of its horizontal trend line at 74.70 levels on daily chart. On daily chart momentum oscillator RSI have been trad- ing below 60 which suggest bearishness in the prices. A momentum indicator MACD has shown negative crossover on daily chart, which add more bearishness in the prices. For now we can expect prices should move lower to- wards 72.10 levels in the coming trading session. Technical View: On daily GBPINR prices have been taking support of its falling trend line at 81.20 levels. Moreover, prices have been trading below 21 HEMA, which suggest short term trend looks positive. The price has formed bullish hammer candle stick pattern on daily chart, which is bullish pattern. A momentum indicator MADC has given positive Cross over on hourly chart, which gives the sign of bullishness in the prices. The momentum indictor RSI has been trading in over- sold zone levels on daily chart, which suggest the possi- bilities of bounce back in the in the prices. For now we expect prices should move higher towards 82.20 levels coming trading sessions. SEBI Certified – Research Analyst Equities I Commodities I Currencies I Mutual Funds S3 S2 S1 Pivot R1 R2 R3 GBPINR 80.88 81.09 81.20 81.30 81.41 81.51 81.72 EURINR 72.50 72.64 72.72 72.78 72.86 72.92 73.06
- 4. Currency Highlights SEBI Certified – Research Analyst Equities I Commodities I Currencies I Mutual Funds 27th Oct’2016 Economic Indicators Date Time Data Prior Expected Impact 27.10.16 12:30 PM Spanish Unemployment Rate 20.0% 19.3% Actual < Forecast = Good for currency; EURINR 27.10.16 01:30 PM M3 Money Supply y/y 5.1% 5.1% Actual > Forecast = Good for currency; EURINR 27.10.16 01:30 PM Private Loans y/y 1.8% 1.9% Actual > Forecast = Good for currency; EURINR 27.10.16 02:00 PM Prelim GDP q/q 0.7% 0.3% Actual > Forecast = Good for currency; GBPINR 27.10.16 06:00 PM Core Durable Goods Orders m/m -0.2% 0.2% Actual > Forecast = Good for currency; USDINR 27.10.16 06:00 PM Unemployment Claims 260K 261K Actual < Forecast = Good for currency; USDINR 27.10.16 06:00 PM Durable Goods Orders m/m 0.1% 0.1% Actual > Forecast = Good for currency; USDINR 27.10.16 07:30 PM Pending Home Sales m/m -2.4% 1.2% Actual > Forecast = Good for currency; USDINR
- 5. Currency Highlights 27th Oct’2016 SEBI Certified – Research Analyst Equities I Commodities I Currencies I Mutual Funds Amit Pathania Digitally signed by Amit Pathania DN: cn=Amit Pathania, o=Choice Equity Broking Pvt. ltd, ou=Research Department, email=amit.pathania@choiceindia.com, c=IN Date: 2016.10.27 09:01:31 +05'30'