
Recommended
More Related Content
What's hot
What's hot (20)
Viewers also liked
Viewers also liked (12)
Similar to Currency high lights 16.09.16
Similar to Currency high lights 16.09.16 (18)
Recently uploaded
Recently uploaded (20)
Currency high lights 16.09.16
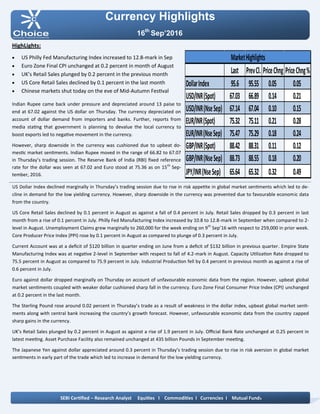
- 1. Currency Highlights 16th Sep’2016 HighLights: US Philly Fed Manufacturing Index increased to 12.8-mark in Sep Euro Zone Final CPI unchanged at 0.2 percent in month of August UK’s Retail Sales plunged by 0.2 percent in the previous month US Core Retail Sales declined by 0.1 percent in the last month Chinese markets shut today on the eve of Mid-Autumn Festival Indian Rupee came back under pressure and depreciated around 13 paise to end at 67.02 against the US dollar on Thursday. The currency depreciated on account of dollar demand from importers and banks. Further, reports from media stating that government is planning to devalue the local currency to boost exports led to negative movement in the currency. However, sharp downside in the currency was cushioned due to upbeat do- mestic market sentiments. Indian Rupee moved in the range of 66.82 to 67.07 in Thursday’s trading session. The Reserve Bank of India (RBI) fixed reference rate for the dollar was seen at 67.02 and Euro stood at 75.36 as on 15th Sep- tember, 2016. US Dollar Index declined marginally in Thursday’s trading session due to rise in risk appetite in global market sentiments which led to de- cline in demand for the low yielding currency. However, sharp downside in the currency was prevented due to favourable economic data from the country. US Core Retail Sales declined by 0.1 percent in August as against a fall of 0.4 percent in July. Retail Sales dropped by 0.3 percent in last month from a rise of 0.1 percent in July. Philly Fed Manufacturing Index increased by 10.8 to 12.8-mark in September when compared to 2- level in August. Unemployment Claims grew marginally to 260,000 for the week ending on 9th Sep’16 with respect to 259,000 in prior week. Core Producer Price Index (PPI) rose by 0.1 percent in August as compared to plunge of 0.3 percent in July. Current Account was at a deficit of $120 billion in quarter ending on June from a deficit of $132 billion in previous quarter. Empire State Manufacturing Index was at negative 2-level in September with respect to fall of 4.2-mark in August. Capacity Utilization Rate dropped to 75.5 percent in August as compared to 75.9 percent in July. Industrial Production fell by 0.4 percent in previous month as against a rise of 0.6 percent in July. Euro against dollar dropped marginally on Thursday on account of unfavourable economic data from the region. However, upbeat global market sentiments coupled with weaker dollar cushioned sharp fall in the currency. Euro Zone Final Consumer Price Index (CPI) unchanged at 0.2 percent in the last month. The Sterling Pound rose around 0.02 percent in Thursday’s trade as a result of weakness in the dollar index, upbeat global market senti- ments along with central bank increasing the country’s growth forecast. However, unfavourable economic data from the country capped sharp gains in the currency. UK’s Retail Sales plunged by 0.2 percent in August as against a rise of 1.9 percent in July. Official Bank Rate unchanged at 0.25 percent in latest meeting. Asset Purchase Facility also remained unchanged at 435 billion Pounds in September meeting. The Japanese Yen against dollar appreciated around 0.3 percent in Thursday’s trading session due to rise in risk aversion in global market sentiments in early part of the trade which led to increase in demand for the low yielding currency. SEBI Certified – Research Analyst Equities I Commodities I Currencies I Mutual Funds Last PrevCl. PriceChng PriceChng% DollarIndex 95.6 95.55 0.05 0.05 USD/INR(Spot) 67.03 66.89 0.14 0.21 USD/INR(NseSep) 67.14 67.04 0.10 0.15 EUR/INR(Spot) 75.32 75.11 0.21 0.28 EUR/INR(NseSep) 75.47 75.29 0.18 0.24 GBP/INR(Spot) 88.42 88.31 0.11 0.12 GBP/INR(NseSep) 88.73 88.55 0.18 0.20 JPY/INR(NseSep) 65.64 65.32 0.32 0.49 MarketHighlights
- 2. Technical View: On daily chart JPYINR pair opened the day at 65.50, made a high of 65.72, low of 64.37, and closed the day at 65.64, thus it closed the day with gain of 0.49 point. On daily chart JPYINR has been facing strong resistance at 66 levels which is unfiled gap and 21 DMA also. Be- side, pair has given closed below 21 moving average which is place at 66.01level. & it show that near term trend is down. On daily chart pair has paying with 50 DMA. Which suggest some consolidation at these levels. On daily chart momentum indicator RSI reading is at 49 levels which is also strong horizontal support now its point out for positive breath in the pair. So for trading perspective, one could use sell on Rise up- to level of 65.79 with SL of 66.60 for Target of 64.40- 63.85 Pivot levels for the Day Technical View: On daily USDINR pair opened the day at 67.00, made a high of 67.27, low of 66.92, and closed the day at 66.14, thus it closed the day with a gain of 0.15 point. Pair has given bearish breakout of head and shoulder. Pattern will fail if price will goes above 67.49 On daily chart pair has open with gap up and made spin- ning top candlestick pattern. Which represent uncertain- ty, and other hand pair has been trading below all medi- um term, and long term moving average which is 100 and 200.Whereas on pair has taking resistance at 200, 100,50 DAM A Daily momentum indicator RSI reading is at 51 levels with positive crossover, besides RSI reading is near to its trend line and horizontal resistance. So for trading perspective, one could sell in range 67.10- 67.20 with SL of 67.50 for target of 66.30-66.10 Currency Highlights 16th Sep’2016 USDINR JPYINR SEBI Certified – Research Analyst Equities I Commodities I Currencies I Mutual Funds S3 S2 S1 Pivot R1 R2 R3 USDINR 66.41 66.76 66.95 67.11 67.30 67.46 67.81 JPYINR 64.88 65.23 65.43 65.58 65.78 65.93 66.28
- 3. Pivot levels for the Day Currency Highlights 16th Sep’2016 GBPINR EURINR Technical View: On daily gap up opening EURINR pair opened the day at 75.51, made a high of 75.62, low of 75.26, and closed the day at 75.47, thus it closed the day with a gain of 0.23 point. On weekly chart pair have formed bullish engulfing pattern. This pattern failed if price goes below 74.48 Price has have been trading in descending triangle pattern now price has bounce back at of 74.50 which is 200 DMA as well lower band of descending triangle. Now price has given closed below 20 & 100DMA. Many more price is trading above all moving averages which suggest all time frame trend is negative. On daily chart momentum oscillator RSI have been trad- ing at 54 with positive cross over which suggest some positive breath in the pair. For now we can expect prices should move to towards 75.60- 75.75.75 levels in the coming trading session. However price is trading above 74.70 Technical View: On daily GBPINR pair opened the day at 88.75, made a high of 89.16, low of 88.62, and closed the day at 88.73, thus it closed the day with a gain of 0.20 point. The price has been trading in following channel for- mation from past weeks and prices have been facing resistance of its upper band of channel at 89.25 levels. The prices have been trading above its 20 DMA and 50 DAM with is at 88.12 and 88.74, that is suggest short term trend is Bullish. A momentum indicator MADC has given bullish Cross over with positive note on daily chart, many more direc- tional indicator given buy signal which suggest bullish momentum in the prices in coming trading session. For now we expect prices should move high towards 90.80 with SL 87.50 levels in the coming trading ses- sions. SEBI Certified – Research Analyst Equities I Commodities I Currencies I Mutual Funds S3 S2 S1 Pivot R1 R2 R3 GBPINR 87.76 88.30 88.51 88.84 89.05 89.38 89.92 EURINR 74.72 75.08 75.25 75.44 75.61 75.80 76.16
- 4. Currency Highlights SEBI Certified – Research Analyst Equities I Commodities I Currencies I Mutual Funds 16th Sep’2016 Economic Indicators Date Time Data Prior Expected Impact 16.09.16 6:00pm CPI m/m 0.0% 0.1% Actual > Forecast = Good 16.09.16 6:00pm Core CPI m/m 0.1% 0.2% Actual > Forecast = Good for currency; USDINR 16.09.16 6:00pm Prelim UoM Consumer Senti- ment 89.8 91.0 Actual > Forecast = Good
- 5. Currency Highlights 16th Sep’2016 SEBI Certified – Research Analyst Equities I Commodities I Currencies I Mutual Funds Vikas Chaudhari Digitally signed by Vikas Chaudhari DN: cn=Vikas Chaudhari, o=Choice Equity Broking Pvt Ltd, ou=Research Department, email=vikas.chaudhari@choiceindia.com, c=IN Date: 2016.09.16 09:05:35 +05'30'