
Recommended
More Related Content
What's hot
What's hot (20)
Viewers also liked
Viewers also liked (12)
Similar to Currency high lights 25.10.16
Similar to Currency high lights 25.10.16 (20)
Recently uploaded
Recently uploaded (20)
Currency high lights 25.10.16
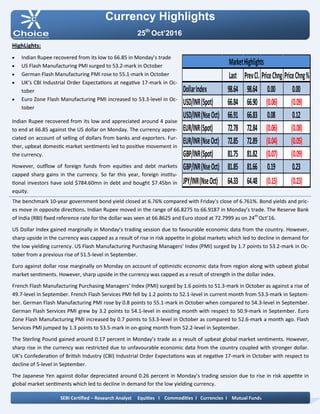
- 1. Currency Highlights 25th Oct’2016 HighLights: Indian Rupee recovered from its low to 66.85 in Monday’s trade US Flash Manufacturing PMI surged to 53.2-mark in October German Flash Manufacturing PMI rose to 55.1-mark in October UK’s CBI Industrial Order Expectations at negative 17-mark in Oc- tober Euro Zone Flash Manufacturing PMI increased to 53.3-level in Oc- tober Indian Rupee recovered from its low and appreciated around 4 paise to end at 66.85 against the US dollar on Monday. The currency appre- ciated on account of selling of dollars from banks and exporters. Fur- ther, upbeat domestic market sentiments led to positive movement in the currency. However, outflow of foreign funds from equities and debt markets capped sharp gains in the currency. So far this year, foreign institu- tional investors have sold $784.60mn in debt and bought $7.45bn in equity. The benchmark 10-year government bond yield closed at 6.76% compared with Friday’s close of 6.761%. Bond yields and pric- es move in opposite directions. Indian Rupee moved in the range of 66.8275 to 66.9187 in Monday’s trade. The Reserve Bank of India (RBI) fixed reference rate for the dollar was seen at 66.8625 and Euro stood at 72.7999 as on 24th Oct’16. US Dollar Index gained marginally in Monday’s trading session due to favourable economic data from the country. However, sharp upside in the currency was capped as a result of rise in risk appetite in global markets which led to decline in demand for the low yielding currency. US Flash Manufacturing Purchasing Managers' Index (PMI) surged by 1.7 points to 53.2-mark in Oc- tober from a previous rise of 51.5-level in September. Euro against dollar rose marginally on Monday on account of optimistic economic data from region along with upbeat global market sentiments. However, sharp upside in the currency was capped as a result of strength in the dollar index. French Flash Manufacturing Purchasing Managers' Index (PMI) surged by 1.6 points to 51.3-mark in October as against a rise of 49.7-level in September. French Flash Services PMI fell by 1.2 points to 52.1-level in current month from 53.3-mark in Septem- ber. German Flash Manufacturing PMI rose by 0.8 points to 55.1-mark in October when compared to 54.3-level in September. German Flash Services PMI grew by 3.2 points to 54.1-level in existing month with respect to 50.9-mark in September. Euro Zone Flash Manufacturing PMI increased by 0.7 points to 53.3-level in October as compared to 52.6-mark a month ago. Flash Services PMI jumped by 1.3 points to 53.5-mark in on-going month from 52.2-level in September. The Sterling Pound gained around 0.17 percent in Monday’s trade as a result of upbeat global market sentiments. However, sharp rise in the currency was restricted due to unfavourable economic data from the country coupled with stronger dollar. UK’s Confederation of British Industry (CBI) Industrial Order Expectations was at negative 17-mark in October with respect to decline of 5-level in September. The Japanese Yen against dollar depreciated around 0.26 percent in Monday’s trading session due to rise in risk appetite in global market sentiments which led to decline in demand for the low yielding currency. SEBI Certified – Research Analyst Equities I Commodities I Currencies I Mutual Funds Last PrevCl. PriceChng PriceChng% DollarIndex 98.64 98.64 0.00 0.00 USD/INR(Spot) 66.84 66.90 (0.06) (0.09) USD/INR(NseOct) 66.91 66.83 0.08 0.12 EUR/INR(Spot) 72.78 72.84 (0.06) (0.08) EUR/INR(NseOct) 72.85 72.89 (0.04) (0.05) GBP/INR(Spot) 81.75 81.82 (0.07) (0.09) GBP/INR(NseOct) 81.85 81.66 0.19 0.23 JPY/INR(NseOct) 64.33 64.48 (0.15) (0.23) MarketHighlights
- 2. Technical View: On daily chart JPYINR prices have been trading in sym- metrical triangle pattern and shown breakdown of its symmetrical triangle pattern. However, price has formed bearish candle stick on daily chart. Moreover, price has shown breakdown of its rising trend line at 65 levels. On the other hand price has shown breakdown of its rising trend line at 65.60 levels on daily chart. Furthermore, prices have been trading below its 21 DE- MA, which suggest short term trend is negative. On daily chart momentum indicator RSI is trading below at 45 levels which suggest further weakness in the pric- es. So for trading perspective, one could use sell in the range of 64.45 with SL of 64.80 for Target of 63.80 levels. Pivot levels for the Day Technical View: The pair has been trading in falling wedge pattern from past few months and prices have been facing resistance of its upper band at 67 levels. On daily USDINR prices have been trading in falling channel formation from past few weeks and prices have been facing resistance at up- per band of channel pattern at 67.05 levels. On the other hand, prices have been facing resistance of horizontal trend line at 66.95 levels on daily chart. Moreover, prices have been trading below 50 DEMA which gives the sign of bearishness in the prices. A momentum indictor RSI has traded below 60 levels, which suggest further weakness in the prices. In addition, momentum indicator MACD has shown neg- ative crossover on daily chart. So for trading perspective, one could sell in range 66.95 with SL of 67.25 for target of 66.30. Currency Highlights 25th Oct’2016 USDINR JPYINR SEBI Certified – Research Analyst Equities I Commodities I Currencies I Mutual Funds S3 S2 S1 Pivot R1 R2 R3 USDINR 66.66 66.76 66.81 66.86 66.91 66.96 67.06 JPYINR 63.97 64.16 64.25 64.35 64.44 64.54 64.73
- 3. Pivot levels for the Day Currency Highlights 25th Oct’2016 GBPINR EURINR Technical View: The EURINR pair has shown breakdown of its descend- ing triangle pattern at 74 levels on daily chart. On the other hand price has shown breakdown of its symmet- rical triangle pattern at 74.80 levels on daily chart. Moreover, prices have been trading below its 21 DE- MA, which suggest short term trend is down. The pair has shown breakdown of its horizontal trend line at 74.70 levels on daily chart. On daily chart momentum oscillator RSI have been trad- ing below 60 which suggest bearishness in the prices. A momentum indicator MACD has shown negative crossover on daily chart, which add more bearishness in the prices. For now we can expect prices should move lower to- wards 72.20 levels in the coming trading session. Technical View: On daily GBPINR prices have been taking support of its falling trend line at 81.20 levels. Moreover, prices have been trading below 21 HEMA, which suggest short term trend looks positive. The price has formed bullish hammer candle stick pattern on daily chart, which is bullish pattern. A momentum indicator MADC has given positive Cross over on hourly chart, which gives the sign of bullishness in the prices. The momentum indictor RSI has been trading in over- sold zone levels on daily chart, which suggest the possi- bilities of bounce back in the in the prices. For now we expect prices should move higher towards 82.60 levels coming trading sessions. SEBI Certified – Research Analyst Equities I Commodities I Currencies I Mutual Funds S3 S2 S1 Pivot R1 R2 R3 GBPINR 81.25 81.53 81.68 81.81 81.96 82.09 82.37 EURINR 72.52 72.66 72.74 72.80 72.88 72.94 73.08
- 4. Currency Highlights SEBI Certified – Research Analyst Equities I Commodities I Currencies I Mutual Funds 25th Oct’2016 Economic Indicators Date Time Data Prior Expected Impact 25.10.16 1:30 PM German Ifo Business Cli- mate 109.5 109.6 Actual > Forecast = Good for currency; EURINR 25.10.16 7:30 PM CB Consumer Confidence 104.1 104.5 Actual > Forecast = Good for currency; USDINR 25.10.16 8:05 PM BOE Gov Carney Speaks 49.7 50.2 More hawkish than expected = Good for currency; 25.10.16 9:00 PM ECB President Draghi Speaks 53.3 54.3 More hawkish than expected = Good for currency;
- 5. Currency Highlights 25th Oct’2016 SEBI Certified – Research Analyst Equities I Commodities I Currencies I Mutual Funds Amit Pathania Digitally signed by Amit Pathania DN: cn=Amit Pathania, o=Choice Equity Broking Pvt. ltd, ou=Research Department, email=amit.pathania@choiceindia.com, c=IN Date: 2016.10.25 09:01:25 +05'30'