The U.S. dollar fell to two-and-a-half month lows against other major currencies after the Federal Reserve provided a less optimistic outlook on the U.S. economy than expected. The dollar weakened further as some measures of U.S. inflation remained low. Meanwhile, the British pound rose against the dollar ahead of an interest rate decision and inflation report from the Bank of England. Other currencies like the Australian dollar also gained after positive domestic economic data. Technical analyses indicate bearish trends for the dollar against the Indian rupee and Japanese yen.
1. Currency Highlights
03rd
Feb’2017
HighLights:
The dollar dropped to two-and-a-half month lows against other major
currencies on Thursday, after the Federal Reserve gave a less optimis-
tic view of the economy than expected and as investors awaited the
release of U.S. economic reports later in the day.
The greenback weakened as optimism over the strength of the U.S.
economy waned after policymakers said that some market-based
measures of inflation were still low.
The dollar slid to two-and-a-half month lows against a basket of the
other major currencies on Thursday after the Federal Reserve’s latest
policy statement offered few insights into its plans for raising interest
rates this year
The U.S. dollar index, which measures the greenback’s strength
against a trade-weighted basket of six major currencies, was down
0.26% at 99.43, the lowest level since November 14.
The statement gave no clear signal on the timing of its next rate hike as officials wait to assess the possible economic impact of
the Trump administration’s protectionist policies and his recent remarks about currencies.
The euro surged on Tuesday after President Trump’s top trade adviser accused Germany of currency exploitation, saying it is
using a “grossly undervalued” euro to exploit the U.S. and its trading partners.
The Institute for Supply Management reported that its index of manufacturers rose to more than two-year highs in January
and the ADP nonfarm payrolls report showed that the private sector boosted hiring last month.
The pound rose to seven-week highs against the dollar on Thursday, as investors awaited the Bank of England’s quarterly infla-
tion report and interest rate decision later in the day.
The BoE was to announce its latest interest rate decision, publish its quarterly inflation report and hold a press conference to
discuss the health of the U.K. economy later Thursday.
The pound strengthened amid expectations that the bank will raise its near-term growth and inflation forecasts after figures
last week showed that the economy grew by 0.6% in the fourth quarter.
The Markit U.K. construction purchasing managers' index dropped to 52.2 last month from December’s nine-month high of
54.2. Economists had expected the index to tick down to 53.8.
The Aussie was bossted after data earlier showed that Australia’s trade surplus widened to A$3.511 billion in December from a
revised A$2.040 billion in November. Analysts had expected the trade surplus to hit A$2.200 billion in December .
SEBI Certified – Research Analyst Equities I Commodities I Currencies I Mutual Funds
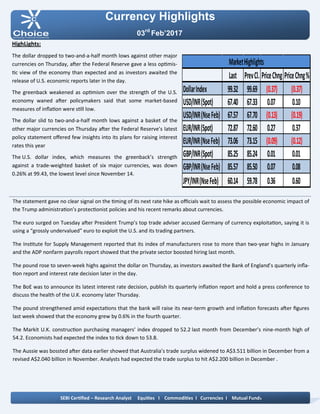
Last PrevCl. PriceChng PriceChng%
DollarIndex 99.32 99.69 (0.37) (0.37)
USD/INR(Spot) 67.40 67.33 0.07 0.10
USD/INR(NseFeb) 67.57 67.70 (0.13) (0.19)
EUR/INR(Spot) 72.87 72.60 0.27 0.37
EUR/INR(NseFeb) 73.06 73.15 (0.09) (0.12)
GBP/INR(Spot) 85.25 85.24 0.01 0.01
GBP/INR(NseFeb) 85.57 85.50 0.07 0.08
JPY/INR(NseFeb) 60.14 59.78 0.36 0.60
MarketHighlights
2. Technical View:
On the hourly chart, the pair has given the breakdown of
its rising trend line at 60 levels.
The pair has been trading in horizontal channel pattern
from past few weeks and price has faced the resistance
of its upper band at 60.50 levels on the hourly chart.
Moreover, prices have been trading below its 21 DSMA
which gives the sign of bearishness in the prices.
On daily chart momentum indicator, RSI is trading below
60 levels which indicate downside momentum can be
seen in the prices.
In addition, momentum indicator MACD has shown neg-
ative crossover which suggests lack of strength in the
prices on the hourly chart.
So for trading perspective, one could JPYINR sell in the
range of 60.20 with SL of 60.50 for the target of 59.60
levels.
Pivot levels for the Day
Technical View:
The pair has given the breakdown of its horizontal chan-
nel pattern and prices have been retested its breakdown
trend line channel pattern at 68 levels on 4 hourly
charts.
On the hourly chart, the pair has given the breakdown
of its rising trend line at 68.20 levels.
Moreover, prices have been trading below its 21 HSMA
which gives the sign of bearishness in the prices.
A momentum indicator RSI has shown bearish range
shift at 45 levels, which suggest further negative mo-
mentum can be seen in the prices.
In addition, momentum indicator MACD has shown neg-
ative crossover and moving above its signal line on 4
hourly chart.
So for trading perspective, one could sell USDINR in
range 67.70 with SL of 68 for target of 67.10
Currency Highlights
03rd
Feb’2017
USDINR JPYINR
SEBI Certified – Research Analyst Equities I Commodities I Currencies I Mutual Funds
S3 S2 S1 Pivot R1 R2 R3
USDINR 67.34 67.47 67.52 67.60 67.65 67.73 67.86
JPYINR 59.43 59.75 59.94 60.07 60.26 60.39 60.71
3. Pivot levels for the Day
Currency Highlights
03rd
Feb’2017
GBPINR EURINR
Technical View:
The pair has given the breakdown of its rising channel
pattern and price have been almost retested its break-
down channel pattern at 85.50 levels on the daily chart.
The pair has been trading below its 21 HSMA on the
hourly chart, which suggests further weakness can be
seen in the prices.
On daily chart momentum oscillator, RSI has been mov-
ing below 50 levels on the hourly chart, which suggest
bearishness in the prices.
A momentum indicator MACD has shown negative
crossover on the hourly chart, which supports our bear-
ish view to the prices.
For now, we can expect prices should move lower to-
wards 72.30 levels in the coming trading session.
Technical View:
The pair has given the breakdown of its rising channel
pattern and price have been almost retested its break-
down channel pattern at 85.50 levels on the daily chart.
The prices have given the breakdown of its horizontal
trend line at 86 levels on the daily chart.
Moreover, prices have been trading below 21 DSMA,
which suggest short term trend looks down.
Moreover, momentum indicator MACD has given nega-
tive crossover on a daily chart, which gives the sign of
bearishness in the prices.
The momentum indicator RSI has been trading below
60 levels on the daily chart, which suggest the possibili-
ties of further downside momentum in the prices.
For now, we expect prices should move lower to-
wards 84.80 levels coming trading sessions.
SEBI Certified – Research Analyst Equities I Commodities I Currencies I Mutual Funds
S3 S2 S1 Pivot R1 R2 R3
GBPINR 84.68 85.15 85.35 85.62 85.82 86.09 86.56
EURINR 72.61 72.83 72.94 73.05 73.16 73.27 73.49
4. Currency Highlights
SEBI Certified – Research Analyst Equities I Commodities I Currencies I Mutual Funds
03rd
Feb’2017
Economic Indicators
Date Time Data Prior Expected Impact
03.02.17 07:15 AM Caixin Manufacturing PMI 51.9 51.8 Actual > Forecast = Good for
currency; CNY
03.02.17 03:00 PM Services PMI 56.2 55.80 Actual > Forecast = Good for
currency; GBPINR
03.02.17 07:00 PM Average Hourly Earnings m/m 0.4% 0.3% Actual > Forecast = Good for
currency; USDINR
03.02.17 07:00 PM Non-Farm Employment Change 156K 170K Actual > Forecast = Good for
currency; USDINR
03.02.17 07:00 PM Unemployment Rate 4.7% 4.7% Actual < Forecast = Good for
currency; USDINR
03.02.17 08:30 PM ISM Non-Manufacturing PMI 57.2 57 Actual > Forecast = Good for
currency; USDINR
5. Currency Highlights
03rd
Feb’2017
SEBI Certified – Research Analyst Equities I Commodities I Currencies I Mutual Funds
Amit Pathania
Digitally signed by Amit Pathania
DN: cn=Amit Pathania, o=Choice Equity Broking Pvt. ltd,
ou=Research Department, email=amit.pathania@choiceindia.com,
c=IN
Date: 2017.02.02 20:38:47 +05'30'