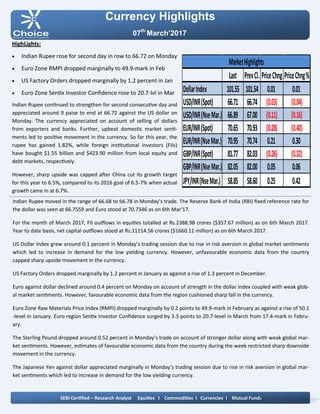
- The Indian rupee rose for the second consecutive day to 66.72 against the US dollar on Monday due to selling of dollars by exporters and banks as well as upbeat domestic market sentiment.
- Eurozone Sentix Investor Confidence rose to 20.7 in March from 17.4 in February, while the Raw Materials Price Index dropped marginally to 49.9 in February.
- US Factory Orders dropped marginally by 1.2% in January compared to a 1.3% rise in December.
1. Currency Highlights
07th
March’2017
HighLights:
Indian Rupee rose for second day in row to 66.72 on Monday
Euro Zone RMPI dropped marginally to 49.9-mark in Feb
US Factory Orders dropped marginally by 1.2 percent in Jan
Euro Zone Sentix Investor Confidence rose to 20.7-lvl in Mar
Indian Rupee continued to strengthen for second consecutive day and
appreciated around 9 paise to end at 66.72 against the US dollar on
Monday. The currency appreciated on account of selling of dollars
from exporters and banks. Further, upbeat domestic market senti-
ments led to positive movement in the currency. So far this year, the
rupee has gained 1.82%, while foreign institutional investors (FIIs)
have bought $1.55 billion and $423.90 million from local equity and
debt markets, respectively.
However, sharp upside was capped after China cut its growth target
for this year to 6.5%, compared to its 2016 goal of 6.5-7% when actual
growth came in at 6.7%.
Indian Rupee moved in the range of 66.68 to 66.78 in Monday’s trade. The Reserve Bank of India (RBI) fixed reference rate for
the dollar was seen at 66.7559 and Euro stood at 70.7346 as on 6th Mar’17.
For the month of March 2017, FII outflows in equities totalled at Rs.2388.98 crores ($357.67 million) as on 6th March 2017.
Year to date basis, net capital outflows stood at Rs.11114.56 crores ($1660.11 million) as on 6th March 2017.
US Dollar Index grew around 0.1 percent in Monday’s trading session due to rise in risk aversion in global market sentiments
which led to increase in demand for the low yielding currency. However, unfavourable economic data from the country
capped sharp upside movement in the currency.
US Factory Orders dropped marginally by 1.2 percent in January as against a rise of 1.3 percent in December.
Euro against dollar declined around 0.4 percent on Monday on account of strength in the dollar index coupled with weak glob-
al market sentiments. However, favourable economic data from the region cushioned sharp fall in the currency.
Euro Zone Raw Materials Price Index (RMPI) dropped marginally by 0.2 points to 49.9-mark in February as against a rise of 50.1
-level in January. Euro region Sentix Investor Confidence surged by 3.3 points to 20.7-level in March from 17.4-mark in Febru-
ary.
The Sterling Pound dropped around 0.52 percent in Monday’s trade on account of stronger dollar along with weak global mar-
ket sentiments. However, estimates of favourable economic data from the country during the week restricted sharp downside
movement in the currency.
The Japanese Yen against dollar appreciated marginally in Monday’s trading session due to rise in risk aversion in global mar-
ket sentiments which led to increase in demand for the low yielding currency.
SEBI Certified – Research Analyst Equities I Commodities I Currencies I Mutual Funds
Last PrevCl. PriceChng PriceChng%
DollarIndex 101.55 101.54 0.01 0.01
USD/INR(Spot) 66.71 66.74 (0.03) (0.04)
USD/INR(NseMar.) 66.89 67.00 (0.11) (0.16)
EUR/INR(Spot) 70.65 70.93 (0.28) (0.40)
EUR/INR(NseMar.) 70.95 70.74 0.21 0.30
GBP/INR(Spot) 81.77 82.03 (0.26) (0.32)
GBP/INR(NseMar.) 82.05 82.00 0.05 0.06
JPY/INR(NseMar.) 58.85 58.60 0.25 0.42
MarketHighlights
2. Technical View:
On a daily chart, the pair has given a breakdown of its
rising channel pattern at 59.10 levels.
The pair has shown a breakdown of its rising trend line
at 59.20 levels on a daily chart.
Moreover, prices have been trading below its 21HSMA
which gives the sign of bearishness in the prices.
On daily chart momentum indicator, RSI is trading below
50 levels which indicate more downside momentum can
be seen in the prices.
In addition, momentum indicator MACD has shown neg-
ative crossover which suggests a lack of strength in the
prices on a daily chart.
So for trading perspective, one can sell JPYINR in the
range of 58.95 with SL of 59.20 for the target of 58.40
levels.
Pivot levels for the Day
Technical View:
The pair has been trading in falling channel pattern from
past few weeks and price has taken the support of its
lower band of channel pattern at 66.70 levels on the
hourly chart.
Moreover, prices have been trading above its 21 HSMA
which gives the sign of bullishness in the prices.
A momentum indicator RSI has taken support at 30 lev-
els, which suggest further positive momentum can be
seen in the prices.
In addition, momentum indicator MACD has shown pos-
itive crossover and moving above its signal line on an
hourly chart.
So for trading perspective, one can buy USDINR in the
range of 66.85 with SL of 66.60 for the target of 67.35
levels.
Currency Highlights
07th
March’2017
USDINR JPYINR
SEBI Certified – Research Analyst Equities I Commodities I Currencies I Mutual Funds
S3 S2 S1 Pivot R1 R2 R3
USDINR 66.73 66.82 66.85 66.91 66.94 67.00 67.09
JPYINR 58.54 58.70 58.78 58.86 58.94 59.02 59.18
3. Pivot levels for the Day
Currency Highlights
07th
March’2017
GBPINR EURINR
Technical View:
The price has taken the support of its horizontal trend
line at 70.30 levels o daily chart.
The pair has been trading above its 10 HSMA on the
hourly chart, which suggests further positive momen-
tum can be seen in the prices.
On daily chart momentum oscillator, RSI has been tak-
ing support at 35 levels on a daily chart, which suggests
bullishness in the prices.
A momentum indicator MACD has shown positive cross-
over on the hourly chart, which supports our bullish
view on the prices.
For now, we can expect prices should move higher to-
wards 71.60 levels in the coming trading session.
Technical View:
The pair has been trading in symmetrical triangle for-
mation from past few weeks and price has given a
breakdown of its lower band of the pattern at 82.60 lev-
els on a daily chart.
Moreover, prices have been trading below 21 DSMA,
which suggest short term trend looks down.
Moreover, momentum indicator MACD has given nega-
tive crossover on a daily chart, which gives the sign of
bearishness in the prices.
The momentum indicator RSI has been trading below
50 levels on the daily chart, which suggest the possibili-
ties of further downside momentum in the prices.
For now, we expect prices should move lower to-
wards 81.30 levels in the coming trading sessions.
SEBI Certified – Research Analyst Equities I Commodities I Currencies I Mutual Funds
S3 S2 S1 Pivot R1 R2 R3
GBPINR 81.50 81.82 81.95 82.14 82.27 82.46 82.78
EURINR 70.30 70.67 70.82 71.04 71.19 71.41 71.78
4. Currency Highlights
SEBI Certified – Research Analyst Equities I Commodities I Currencies I Mutual Funds
07th
March’2017
Economic Indicators
Date Time Data Prior Expected Impact
07.03.17 12:30 pm German Factory Orders m/m 5.2% -2.5% Actual > Forecast = Good for
currency; EURINR
07.03.17 02:00 pm Halifax HPI m/m -0.9 0.4% Actual > Forecast = Good for
currency; GBPINR
07.03.17 07:00 pm Trade Balance -44.3B -47.0B Actual > Forecast = Good for
currency; USDINR
5. Currency Highlights
07th
March’2017
SEBI Certified – Research Analyst Equities I Commodities I Currencies I Mutual Funds
Anish Vyas
Digitally signed by Anish Vyas
DN: cn=Anish Vyas, o=Choice Merchandise
Broking Pvt. Ltd, ou=Sr. Research Associate,
email=anish.vyas@choiceindia.com, c=IN
Date: 2017.03.07 09:12:11 +05'30'