
Recommended
More Related Content
What's hot
What's hot (20)
Viewers also liked
Similar to Currency high lights 29.12.16
Similar to Currency high lights 29.12.16 (16)
Recently uploaded
Recently uploaded (20)
Currency high lights 29.12.16
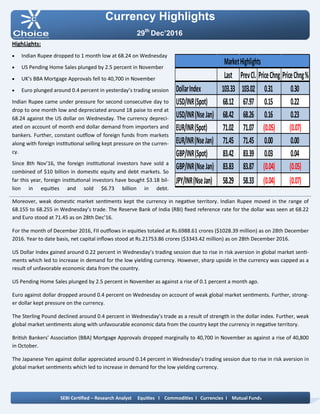
- 1. Currency Highlights 29th Dec’2016 HighLights: Indian Rupee dropped to 1 month low at 68.24 on Wednesday US Pending Home Sales plunged by 2.5 percent in November UK’s BBA Mortgage Approvals fell to 40,700 in November Euro plunged around 0.4 percent in yesterday’s trading session Indian Rupee came under pressure for second consecutive day to drop to one month low and depreciated around 18 paise to end at 68.24 against the US dollar on Wednesday. The currency depreci- ated on account of month end dollar demand from importers and bankers. Further, constant outflow of foreign funds from markets along with foreign institutional selling kept pressure on the curren- cy. Since 8th Nov’16, the foreign institutional investors have sold a combined of $10 billion in domestic equity and debt markets. So far this year, foreign institutional investors have bought $3.18 bil- lion in equities and sold $6.73 billion in debt. Moreover, weak domestic market sentiments kept the currency in negative territory. Indian Rupee moved in the range of 68.155 to 68.255 in Wednesday’s trade. The Reserve Bank of India (RBI) fixed reference rate for the dollar was seen at 68.22 and Euro stood at 71.45 as on 28th Dec’16. For the month of December 2016, FII outflows in equities totaled at Rs.6988.61 crores ($1028.39 million) as on 28th December 2016. Year to date basis, net capital inflows stood at Rs.21753.86 crores ($3343.42 million) as on 28th December 2016. US Dollar Index gained around 0.22 percent in Wednesday’s trading session due to rise in risk aversion in global market senti- ments which led to increase in demand for the low yielding currency. However, sharp upside in the currency was capped as a result of unfavorable economic data from the country. US Pending Home Sales plunged by 2.5 percent in November as against a rise of 0.1 percent a month ago. Euro against dollar dropped around 0.4 percent on Wednesday on account of weak global market sentiments. Further, strong- er dollar kept pressure on the currency. The Sterling Pound declined around 0.4 percent in Wednesday’s trade as a result of strength in the dollar index. Further, weak global market sentiments along with unfavourable economic data from the country kept the currency in negative territory. British Bankers' Association (BBA) Mortgage Approvals dropped marginally to 40,700 in November as against a rise of 40,800 in October. The Japanese Yen against dollar appreciated around 0.14 percent in Wednesday’s trading session due to rise in risk aversion in global market sentiments which led to increase in demand for the low yielding currency. SEBI Certified – Research Analyst Equities I Commodities I Currencies I Mutual Funds Last PrevCl. PriceChng PriceChng% DollarIndex 103.33 103.02 0.31 0.30 USD/INR(Spot) 68.12 67.97 0.15 0.22 USD/INR(NseJan) 68.42 68.26 0.16 0.23 EUR/INR(Spot) 71.02 71.07 (0.05) (0.07) EUR/INR(NseJan) 71.45 71.45 0.00 0.00 GBP/INR(Spot) 83.42 83.39 0.03 0.04 GBP/INR(NseJan) 83.83 83.87 (0.04) (0.05) JPY/INR(NseJan) 58.29 58.33 (0.04) (0.07) MarketHighlights
- 2. Technical View: On daily chart, it has been observed that the JPYINR has completed a Bullish Bat harmonic pattern at 57.55 levels the coordinates of which are as follows: Technical Parameter: XA of the leg from 56 to 67.90,AB of the leg completed at 63.30 (i.e.38.20% of XA leg.), BC of the leg completed at 67.50 (i.e. near 88.60% of AB leg) and CD of the leg completed at 57.55 level. (i.e. 88% of XA and 224% of BC leg). On daily chart momentum indicator RSI is trading in oversold zone which indicates up side momentum can be seen in the prices. In addition, momentum indicator MACD has shown posi- tive crossover which suggest possibilities of rebound in the prices on daily chart. So for trading perspective, one could JPYINR buy in the range of 58.15 with SL of 57.85 for target of 58.65 levels. Pivot levels for the Day Technical View: The pair has shown breakout of its horizontal channel at 67.50 levels on daily chart and price has retested its breakout trend line at 67.40 levels. On daily chart price has taken support of its 61.80% Fib- onacci retracement levels. Moreover, prices have been trading above its 50 DEMA which gives the sign of bullishness in the prices. A momentum indicator RSI has been trading above 40 levels, which suggest further positive momentum can be seen in the prices. In addition, momentum indicator MACD has shown positive crossover on hourly chart. So for trading perspective, one could buy USDINR in range 68.22 with SL of 67.90 for target of 68.80. Currency Highlights 29th Dec’2016 USDINR JPYINR SEBI Certified – Research Analyst Equities I Commodities I Currencies I Mutual Funds S3 S2 S1 Pivot R1 R2 R3 USDINR 68.08 68.23 68.33 68.38 68.48 68.53 68.68 JPYINR 57.90 58.11 58.20 58.32 58.41 58.53 58.74
- 3. Pivot levels for the Day Currency Highlights 29th Dec’2016 GBPINR EURINR Technical View: The price has taken support of its horizontal trend line at 70.60 levels on daily chart. The EURINR pair has also taken support of its falling trend line at 70.70 levels on daily chart. The pair has been trading above its 15 HEMA on hourly chart, which suggest further bullishness can be seen in the prices. On daily chart momentum oscillator RSI has moved up form its oversold zone, which suggest bullishness in the prices. A momentum indicator MACD has shown positive cross- over on 4 hourly chart, which support our bullish view to the prices. For now we can expect prices should move higher to- wards 72.10 levels in the coming trading session. Technical View: The price has shown breakdown of its rising channel pattern at 85 levels on daily chart. The pair has been facing resistance of its falling trend line at 86.10 levels on daily chart. The prices have been facing resistance of its horizontal line at 86 levels. Moreover, prices have been trading below 50 DEMA, which suggest short term trend looks negative. Moreover, momentum indicator MACD has given nega- tive cross over on daily chart, which gives the sign of bearishness in the prices. The momentum indictor RSI has been trading below 60 levels on daily chart, which suggest the possibilities of further weakness in the prices. For now we expect prices should move lower towards 82.70 levels coming trading sessions. SEBI Certified – Research Analyst Equities I Commodities I Currencies I Mutual Funds S3 S2 S1 Pivot R1 R2 R3 GBPINR 82.76 83.35 83.59 83.94 84.18 84.53 85.12 EURINR 70.80 71.10 71.27 71.40 71.57 71.70 72.00
- 4. Currency Highlights SEBI Certified – Research Analyst Equities I Commodities I Currencies I Mutual Funds 29th Dec’2016 Economic Indicators Date Time Data Prior Expected Impact 29.12.16 07:00 PM Unemployment Claims 275K 277K Actual < Forecast = Good for currency; USDINR 29.12.16 07:00 PM Goods Trade Balance -61.9B -61.5B Actual > Forecast = Good for currency; USDINR 29.12.16 09:30 PM Crude Oil Inventories 2.3M
- 5. Currency Highlights 29th Dec’2016 SEBI Certified – Research Analyst Equities I Commodities I Currencies I Mutual Funds Anish Vyas Digitally signed by Anish Vyas DN: cn=Anish Vyas, o=Choice Merchandise Broking Pvt. Ltd, ou=Sr. Research Associate, email=anish.vyas@choiceindia.com, c=IN Date: 2016.12.29 08:42:05 +05'30'