
Recommended
More Related Content
What's hot
What's hot (20)
Similar to Aaj ka trend 25.08.16
Similar to Aaj ka trend 25.08.16 (17)
Recently uploaded
Recently uploaded (20)
Aaj ka trend 25.08.16
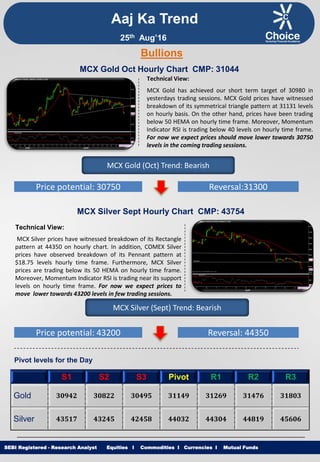
- 1. Equities I Commodities I Currencies I Mutual Funds Aaj Ka Trend Technical View: MCX Gold has achieved our short term target of 30980 in yesterdays trading sessions. MCX Gold prices have witnessed breakdown of its symmetrical triangle pattern at 31131 levels on hourly basis. On the other hand, prices have been trading below 50 HEMA on hourly time frame. Moreover, Momentum Indicator RSI is trading below 40 levels on hourly time frame. For now we expect prices should move lower towards 30750 levels in the coming trading sessions. SEBI Registered - Research Analyst Equities I Commodities I Currencies I Mutual Funds Bullions MCX Gold Oct Hourly Chart CMP: 31044 MCX Gold (Oct) Trend: Bearish Price potential: 30750 Reversal:31300 MCX Silver Sept Hourly Chart CMP: 43754 Technical View: MCX Silver prices have witnessed breakdown of its Rectangle pattern at 44350 on hourly chart. In addition, COMEX Silver prices have observed breakdown of its Pennant pattern at $18.75 levels hourly time frame. Furthermore, MCX Silver prices are trading below its 50 HEMA on hourly time frame. Moreover, Momentum Indicator RSI is trading near its support levels on hourly time frame. For now we expect prices to move lower towards 43200 levels in few trading sessions. MCX Silver (Sept) Trend: Bearish Price potential: 43200 Reversal: 44350 Pivot levels for the Day S1 S2 S3 Pivot R1 R2 R3 Gold 30942 30822 30495 31149 31269 31476 31803 Silver 43517 43245 42458 44032 44304 44819 45606 25th Aug’16
- 2. Equities I Commodities I Currencies I Mutual Funds Technical View: MCX Copper prices have observed breakdown of its Descending triangle pattern at 315 levels on hourly chart. Furthermore, COMEX Copper prices are trading in a Lower high lower low formation on hourly time frame. Moreover, MCX Copper is trading below its 50 HEMA on hourly chart. On the other hand, momentum indicator RSI is trading below 30 levels on hourly chart. For now we expect prices to move lower towards 300 levels in coming trading sessions. SEBI Registered - Research Analyst Equities I Commodities I Currencies I Mutual Funds MCX Copper Aug hourly Chart CMP: 308.55 MCX Copper (Aug) Trend: Bearish Price potential: 300 Reversal: 314 MCX Crude Oil Sept. Hourly Chart CMP: 3150 Technical View: MCX Crude Oil has achieved our short term target of 3155 in yesterdays trading sessions. MCX Crude oil prices witnessed breakdown of its Falling channel pattern at 3132 levels on hourly chart. Counter is trading below its 50 HEMA on. Moreover, Momentum indicator RSI is trading below 40 levels on hourly chart. For now we expect prices to move lower towards 3075 levels in coming trading sessions. MCX Crude Oil (Sept) Trend: Bearish Price potential: 3075 Reversal: 3200 Pivot levels for the Day S1 S2 S3 Pivot R1 R2 R3 Copper 306.8 304.8 299.1 310.6 312.6 316.3 322.1 Crude 3107 3077 2991 3163 3193 3249 3335 Base Metal Energy Aaj Ka Trend 25th Aug’16
- 3. Equities I Commodities I Currencies I Mutual FundsSEBI Registered - Research Analyst Equities I Commodities I Currencies I Mutual Funds Other Base Metals & Energy S1 S2 S3 Pivot R1 R2 R3 Trend Copper 306.8 304.8 299.1 310.6 312.6 316.3 322.1 Aluminum 109.5 109.0 107.5 110.5 111.0 112.0 113.5 Lead 123.5 123.0 121.6 124.3 124.9 125.7 127.0 Nickel 661.9 654.7 634.2 675.2 682.4 695.7 716.2 Zinc 151.8 150.8 148.1 153.6 154.5 156.3 159.1 Natural Gas 185.3 183.2 179.4 187.0 189.1 190.8 194.6 Fundamental News: Gold dipped in Asia on Wednesday with the focus on remarks by the Fed chief at the end of the week to see if recent hawkish views by colleagues on the need to hike interest rates soon are repeated and expanded. Gold prices edged lower in European hours on Wednesday, holding in a familiar range with traders hesitant to make big bets ahead of a highly anticipated speech from Federal Reserve Chair Janet Yellen later this week. Gold prices were slightly lower in North American hours on Wednesday, remaining in a familiar trading range as market players looked ahead to a highly anticipated speech from Federal Reserve Chair Janet Yellen at the end of this week. The world's central banks are still net buyers of gold, but they may be slowing down those purchases. Oil prices were under heavy selling pressure in North American trade on Wednesday, extending overnight losses after data showed that both oil and gasoline supplies in the U.S. rose last week. U.S. crude stocks rose last week as refineries cut output, while gasoline and distillate stocks rose modestly, the U.S. Energy Information Administration said on Wednesday. Oil prices extended their losses on Wednesday, with U.S. crude futures falling more than 2 percent, after an unexpected large build in U.S. crude stockpiles renewed worries about oversupply in the market. U.S. natural gas futures rose for the third day in a row on Wednesday, hitting a more than two-week high as market players looked ahead to fresh weekly information on U.S. gas inventories to gauge the strength of demand for the fuel. Aaj Ka Trend 25th Aug’16
- 4. Equities I Commodities I Currencies I Mutual FundsSEBI Registered - Research Analyst Equities I Commodities I Currencies I Mutual Funds International Market Commodity Closing Price Gold 1328.55 Silver 18.54 Crude Oil 46.77 Brent Crude Oil 49.02 Natural Gas 2.79 COMEX/NYMEX/ICE ( Precious Metals & Energy) Currency & Commodity Index Currency (Spot) Current Price USD / INR 67.11 Dollar Index 94.70 EUR / USD 1.12 CRB Index* 185.74 Closing as on 24.08.16 *Closing as on 24.08.16 LME (Base Metals) ( $ per tones) Commodity Closing Price Copper 4629 Aluminum 1630 Zinc 2275 Lead 1832 Nickel 9897 SHFE (Base Metals) (Yuan per tones) Commodity Closing Price Copper 37050 Aluminum 12320 Zinc 17220 Lead 13500 Closing as on 24.08.16 Closing as on 24.08.16 LME INVENTORY DATA Aaj Ka Trend 18-Aug-16 19-Aug-16 22-Aug-16 23-Aug-16 24-Aug-16 Aluminium 18300 -7100 -3500 -7025 24570 Copper 7925 -2800 18750 10700 14626 Lead -125 -100 -875 -250 -252 Nickel -414 -60 180 144 -340 Zinc -375 -1175 -675 -100 177 25th Aug’16
- 5. Equities I Commodities I Currencies I Mutual Funds This is solely for information of clients of Choice Broking and does not construe to be an investment advice. It is also not intended as an offer or solicitation for the purchase and sale of any financial instruments. Any action taken by you on the basis of the information contained herein is your responsibility alone and Choice Broking its subsidiaries or its employees or associates will not be liable in any manner for the consequences of such action taken by you. We have exercised due diligence in checking the correctness and authenticity of the information contained in this recommendation, but Choice Broking or any of its subsidiaries or associates or employees shall not be in any way responsible for any loss or damage that may arise to any person from any inadvertent error in the information contained in this recommendation or any action taken on basis of this information. Technical analysis studies market psychology, price patterns and volume levels. It is used to forecast future price and market movements. Technical analysis is complementary to fundamental analysis and news sources. The recommendations issued herewith might be contrary to recommendations issued by Choice Broking in the company research undertaken as the recommendations stated in this report is derived purely from technical analysis. Choice Broking has based this document on information obtained from sources it believes to be reliable but which it has not independently verified; Choice Broking makes no guarantee, representation or warranty and accepts no responsibility or liability as to its accuracy or completeness. The opinions contained within the report are based upon publicly available information at the time of publication and are subject to change without notice. The information and any disclosures provided herein are in summary form and have been prepared for informational purposes. The recommendations and suggested price levels are intended purely for trading purposes. The recommendations are valid for the day of the report however trading trends and volumes might vary substantially on an intraday basis and the recommendations may be subject to change. The information and any disclosures provided herein may be considered confidential. Any use, distribution, modification, copying, forwarding or disclosure by any person is strictly prohibited. The information and any disclosures provided herein do not constitute a solicitation or offer to purchase or sell any security or other financial product or instrument. The current performance may be unaudited. Past performance does not guarantee future returns. There can be no assurance that investments will achieve any targeted rates of return, and there is no guarantee against the loss of your entire investment. POTENTIAL CONFLICT OF INTEREST DISCLOSURE (as on date of report) Disclosure of interest statement – • Analyst interest of the stock /Instrument(s): - No. • Firm interest of the stock / Instrument (s): - No. Disclaimer Contact Us Amit Pathania Research Associate amit.pathania@choiceindia.com Rohan Patil Research Associate rohan.patil@choiceindia.com www.choiceindia.comcustomercare@choiceindia.com SEBI Registered - Research Analyst Equities I Commodities I Currencies I Mutual Funds Aaj Ka Trend 25th Aug’16 Neeraj Yadav Research Advisor neeraj.yadav@choiceindia.com Anish Vyas Senior Research Associate anish.vyas@choiceindia.com Amit Pathania Digitally signed by Amit Pathania DN: cn=Amit Pathania, o=Choice Equity Broking Pvt. ltd, ou=Research Department, email=amit.pathania@choiceindia.com, c=IN Date: 2016.08.25 08:40:02 +05'30'