Downloaded 134 times


This document discusses the pathophysiology of myocardial ischemia and infarction. It describes how myocardial oxygen demand can exceed supply, leading to ischemia. Factors that determine oxygen demand and supply are explored, including heart rate, contractility, wall tension, coronary blood flow, oxygen carrying capacity of blood, and autoregulatory resistance in arterioles. The progression and vulnerability of atherosclerotic plaque is summarized. Clinical syndromes like stable angina and acute coronary syndromes (unstable angina and myocardial infarction) are defined and their presentations, diagnoses, and treatment approaches are overviewed.
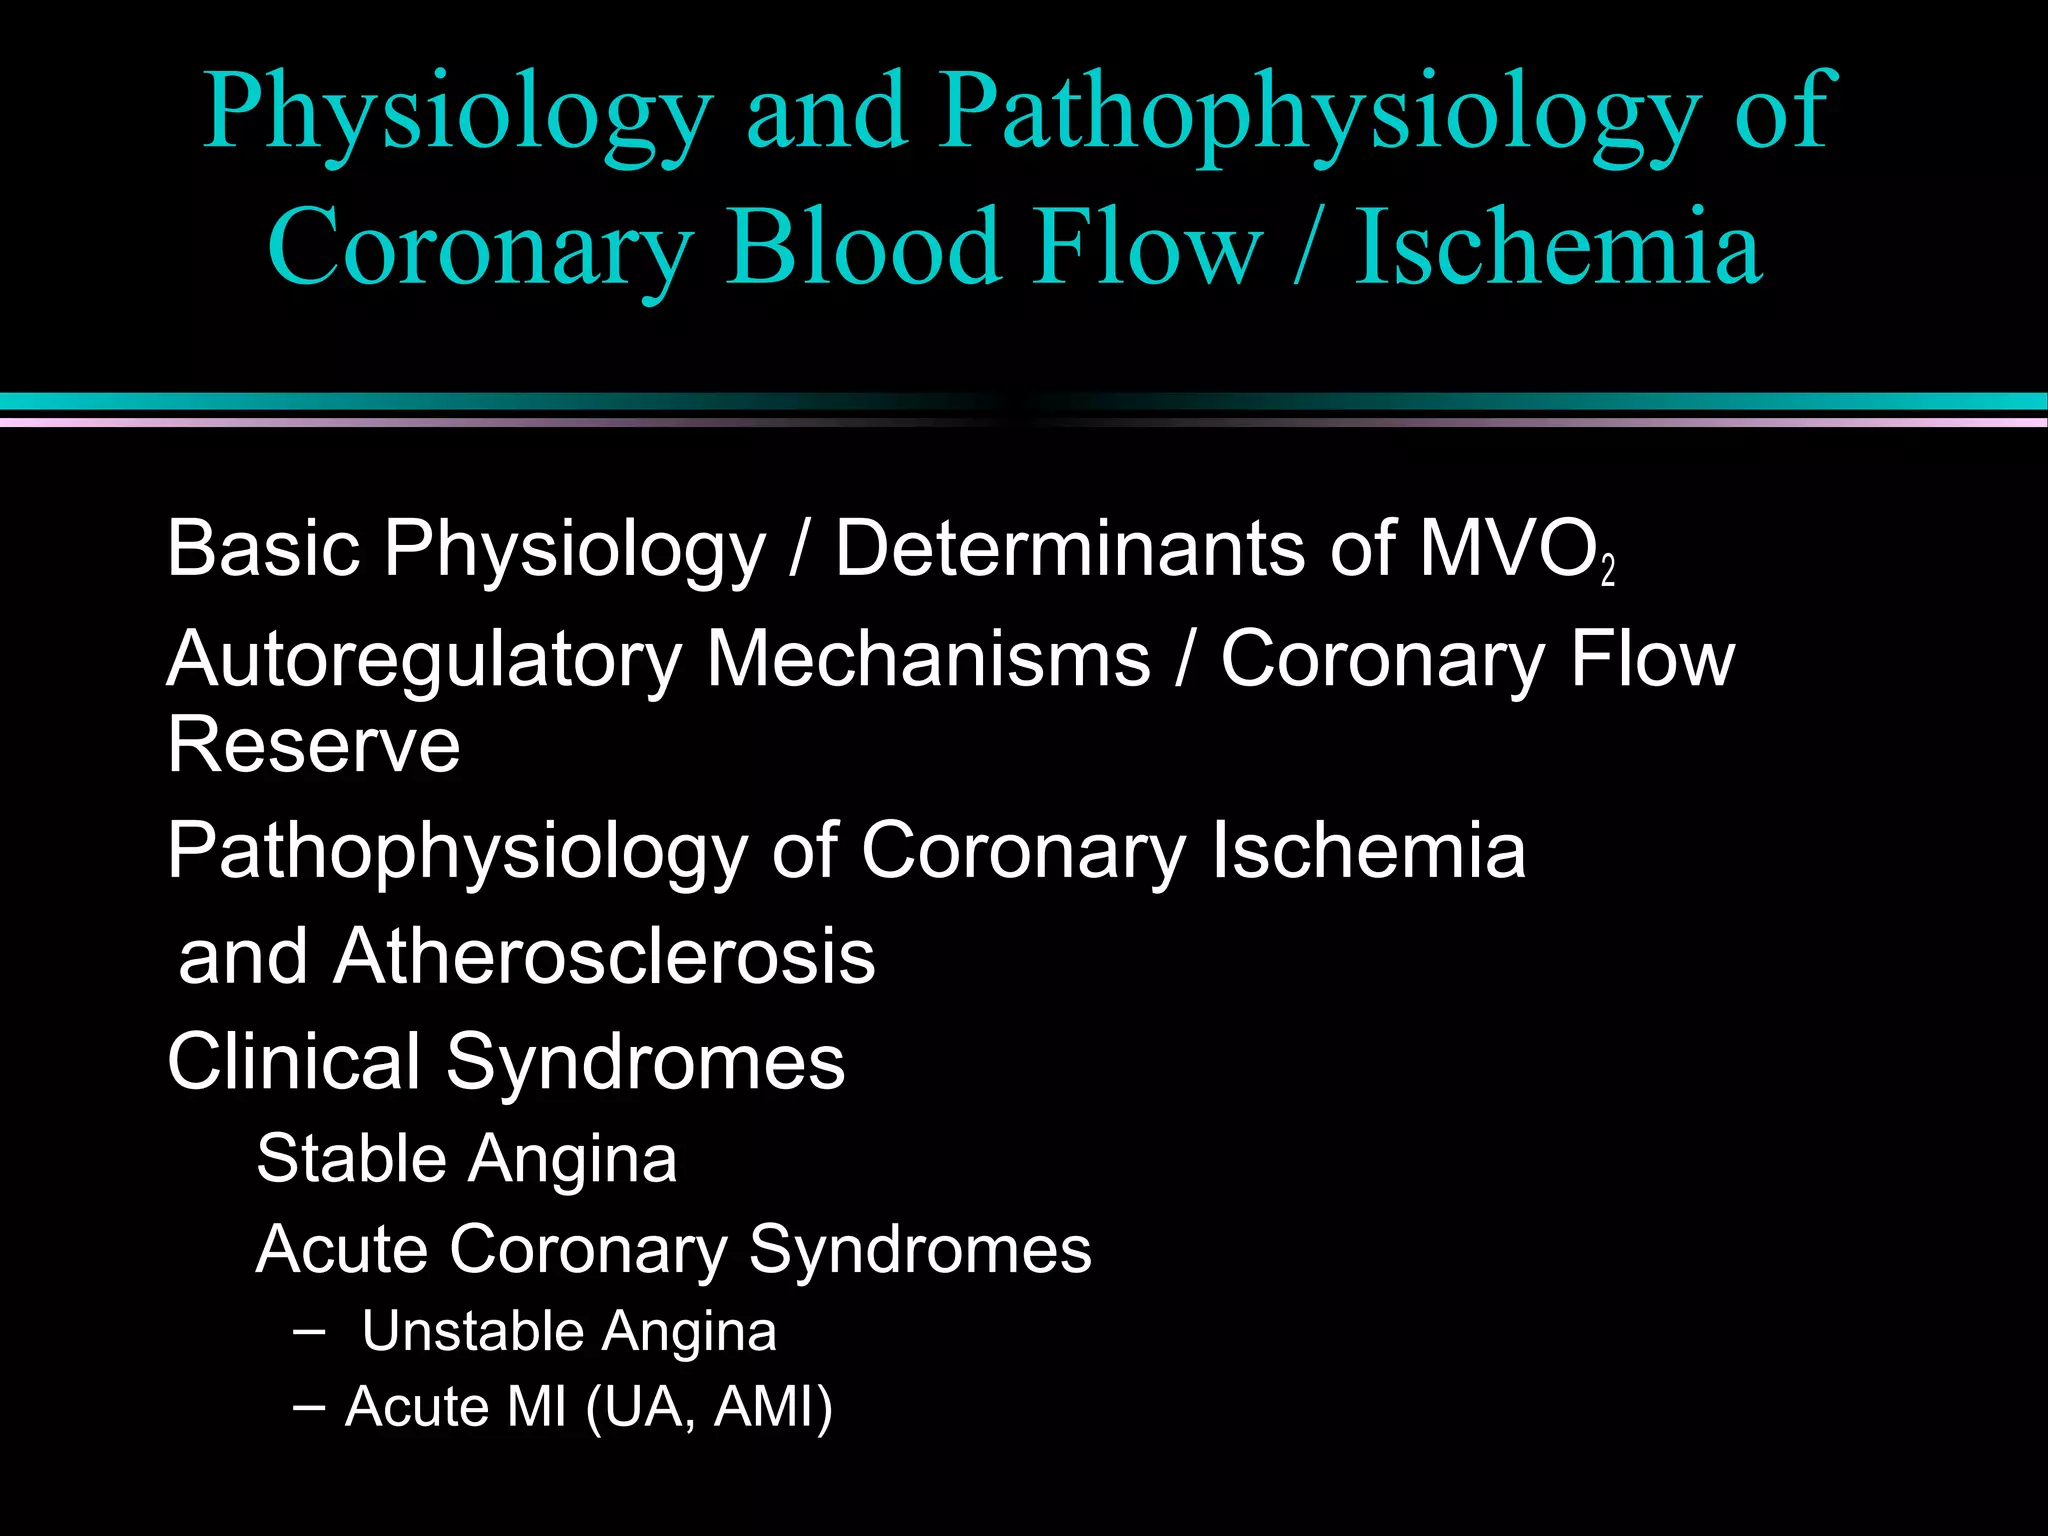
Introduction to Ischemic Heart Disease, focusing on myocardial ischemia, coronary flow, and clinical syndromes including Stable Angina and Acute Coronary Syndromes.
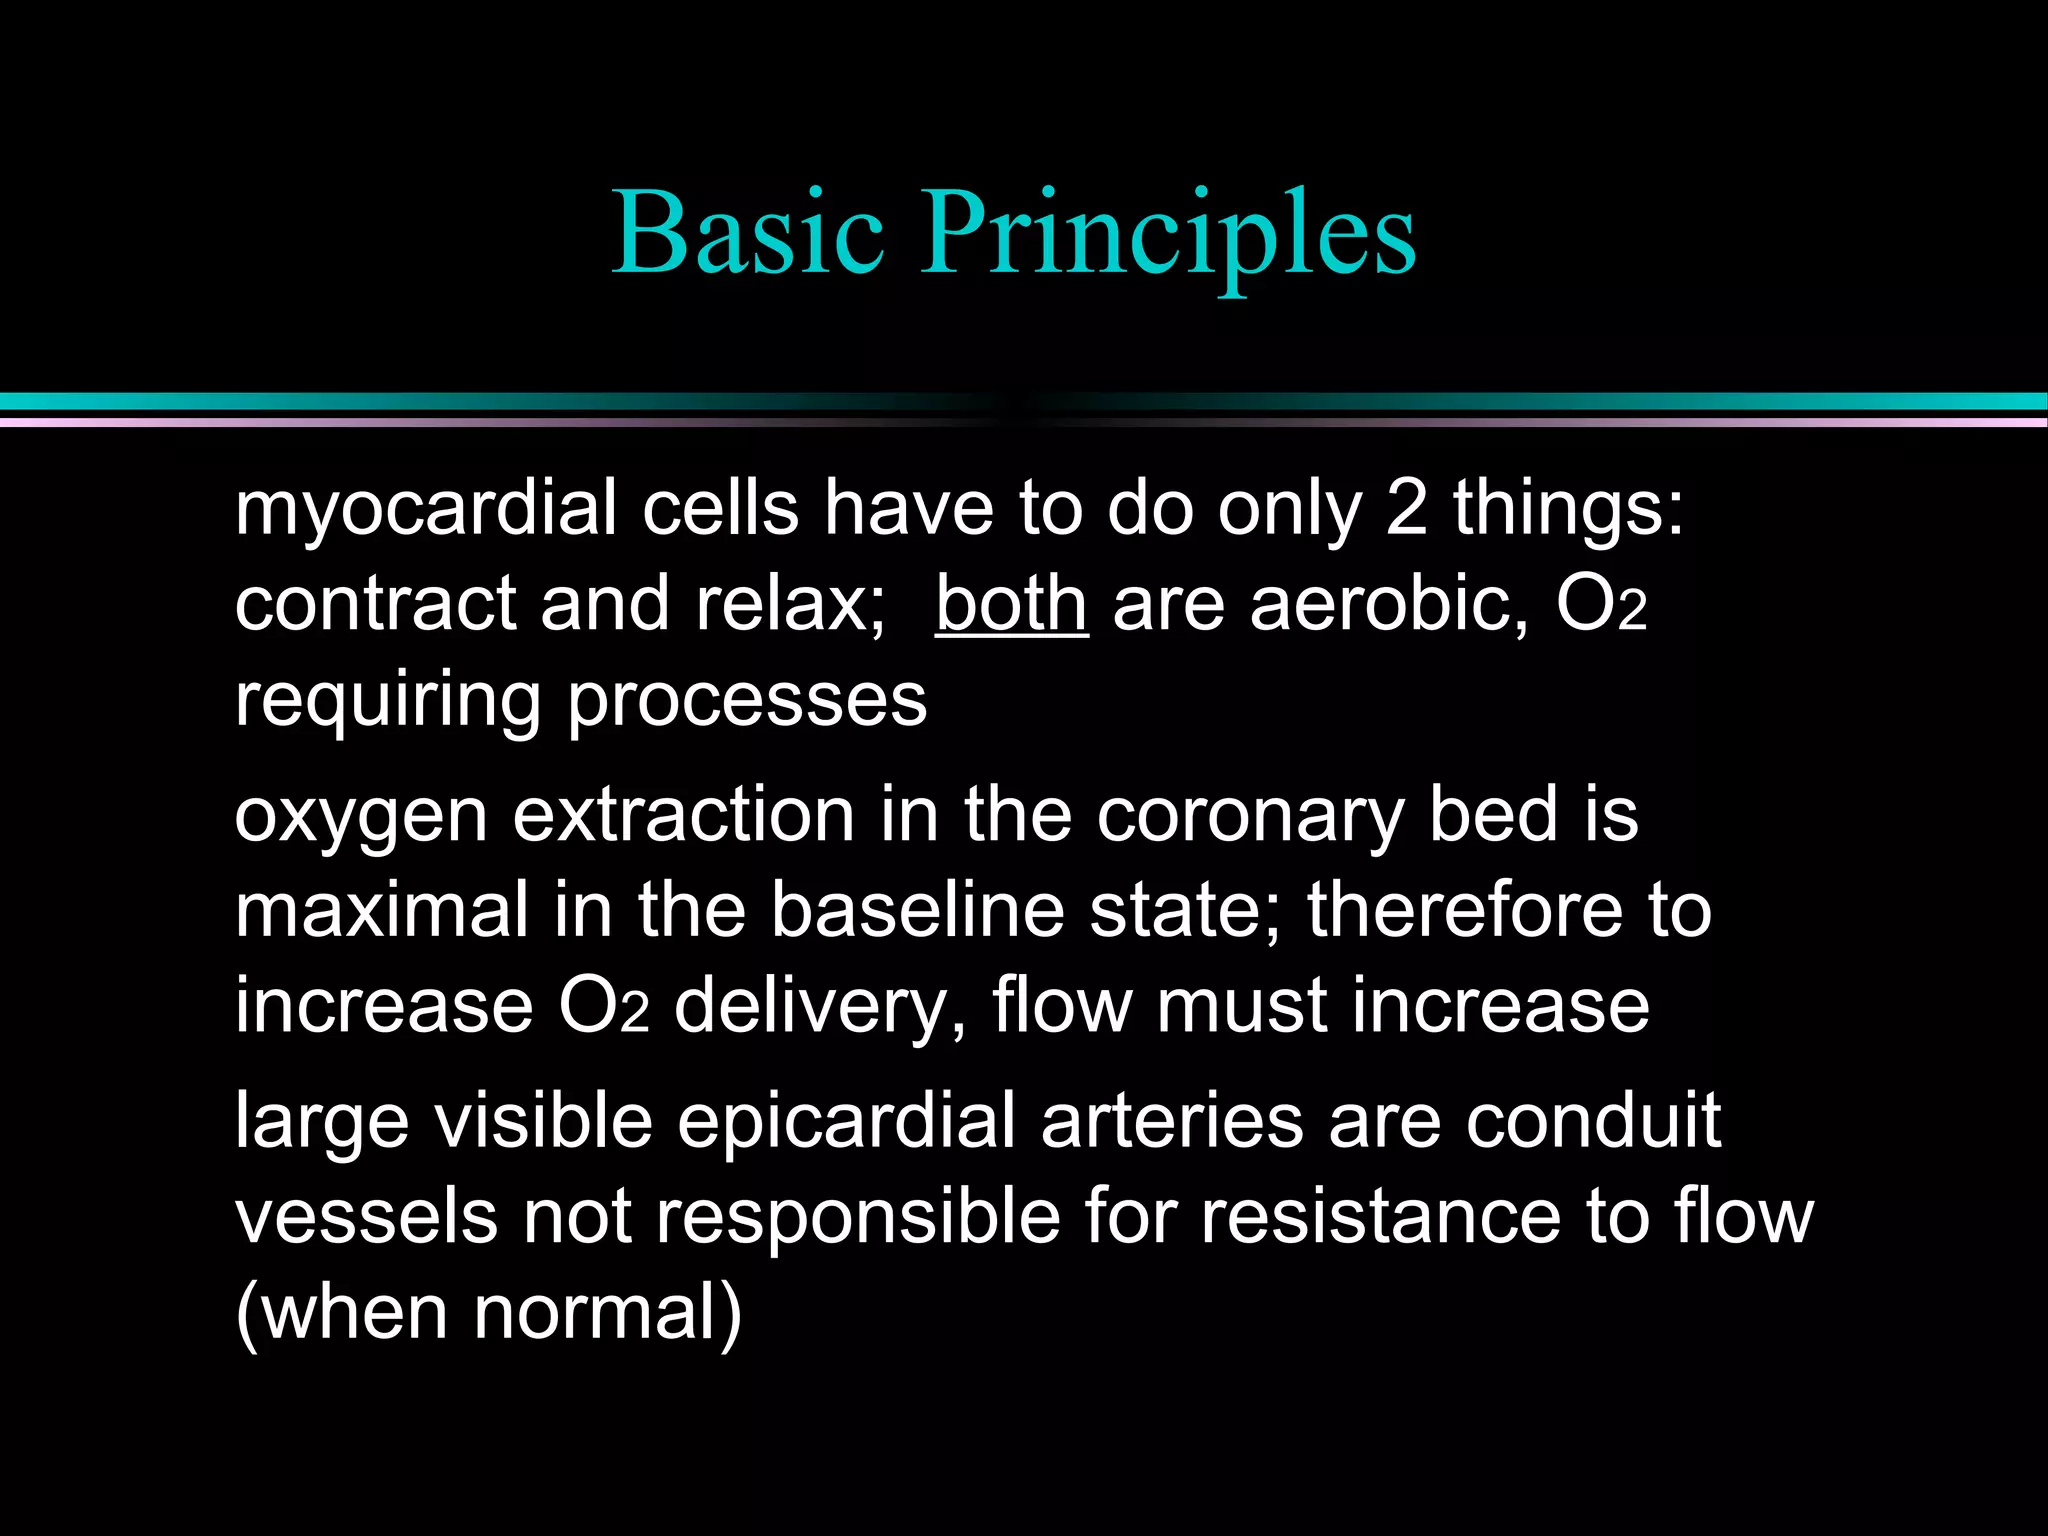
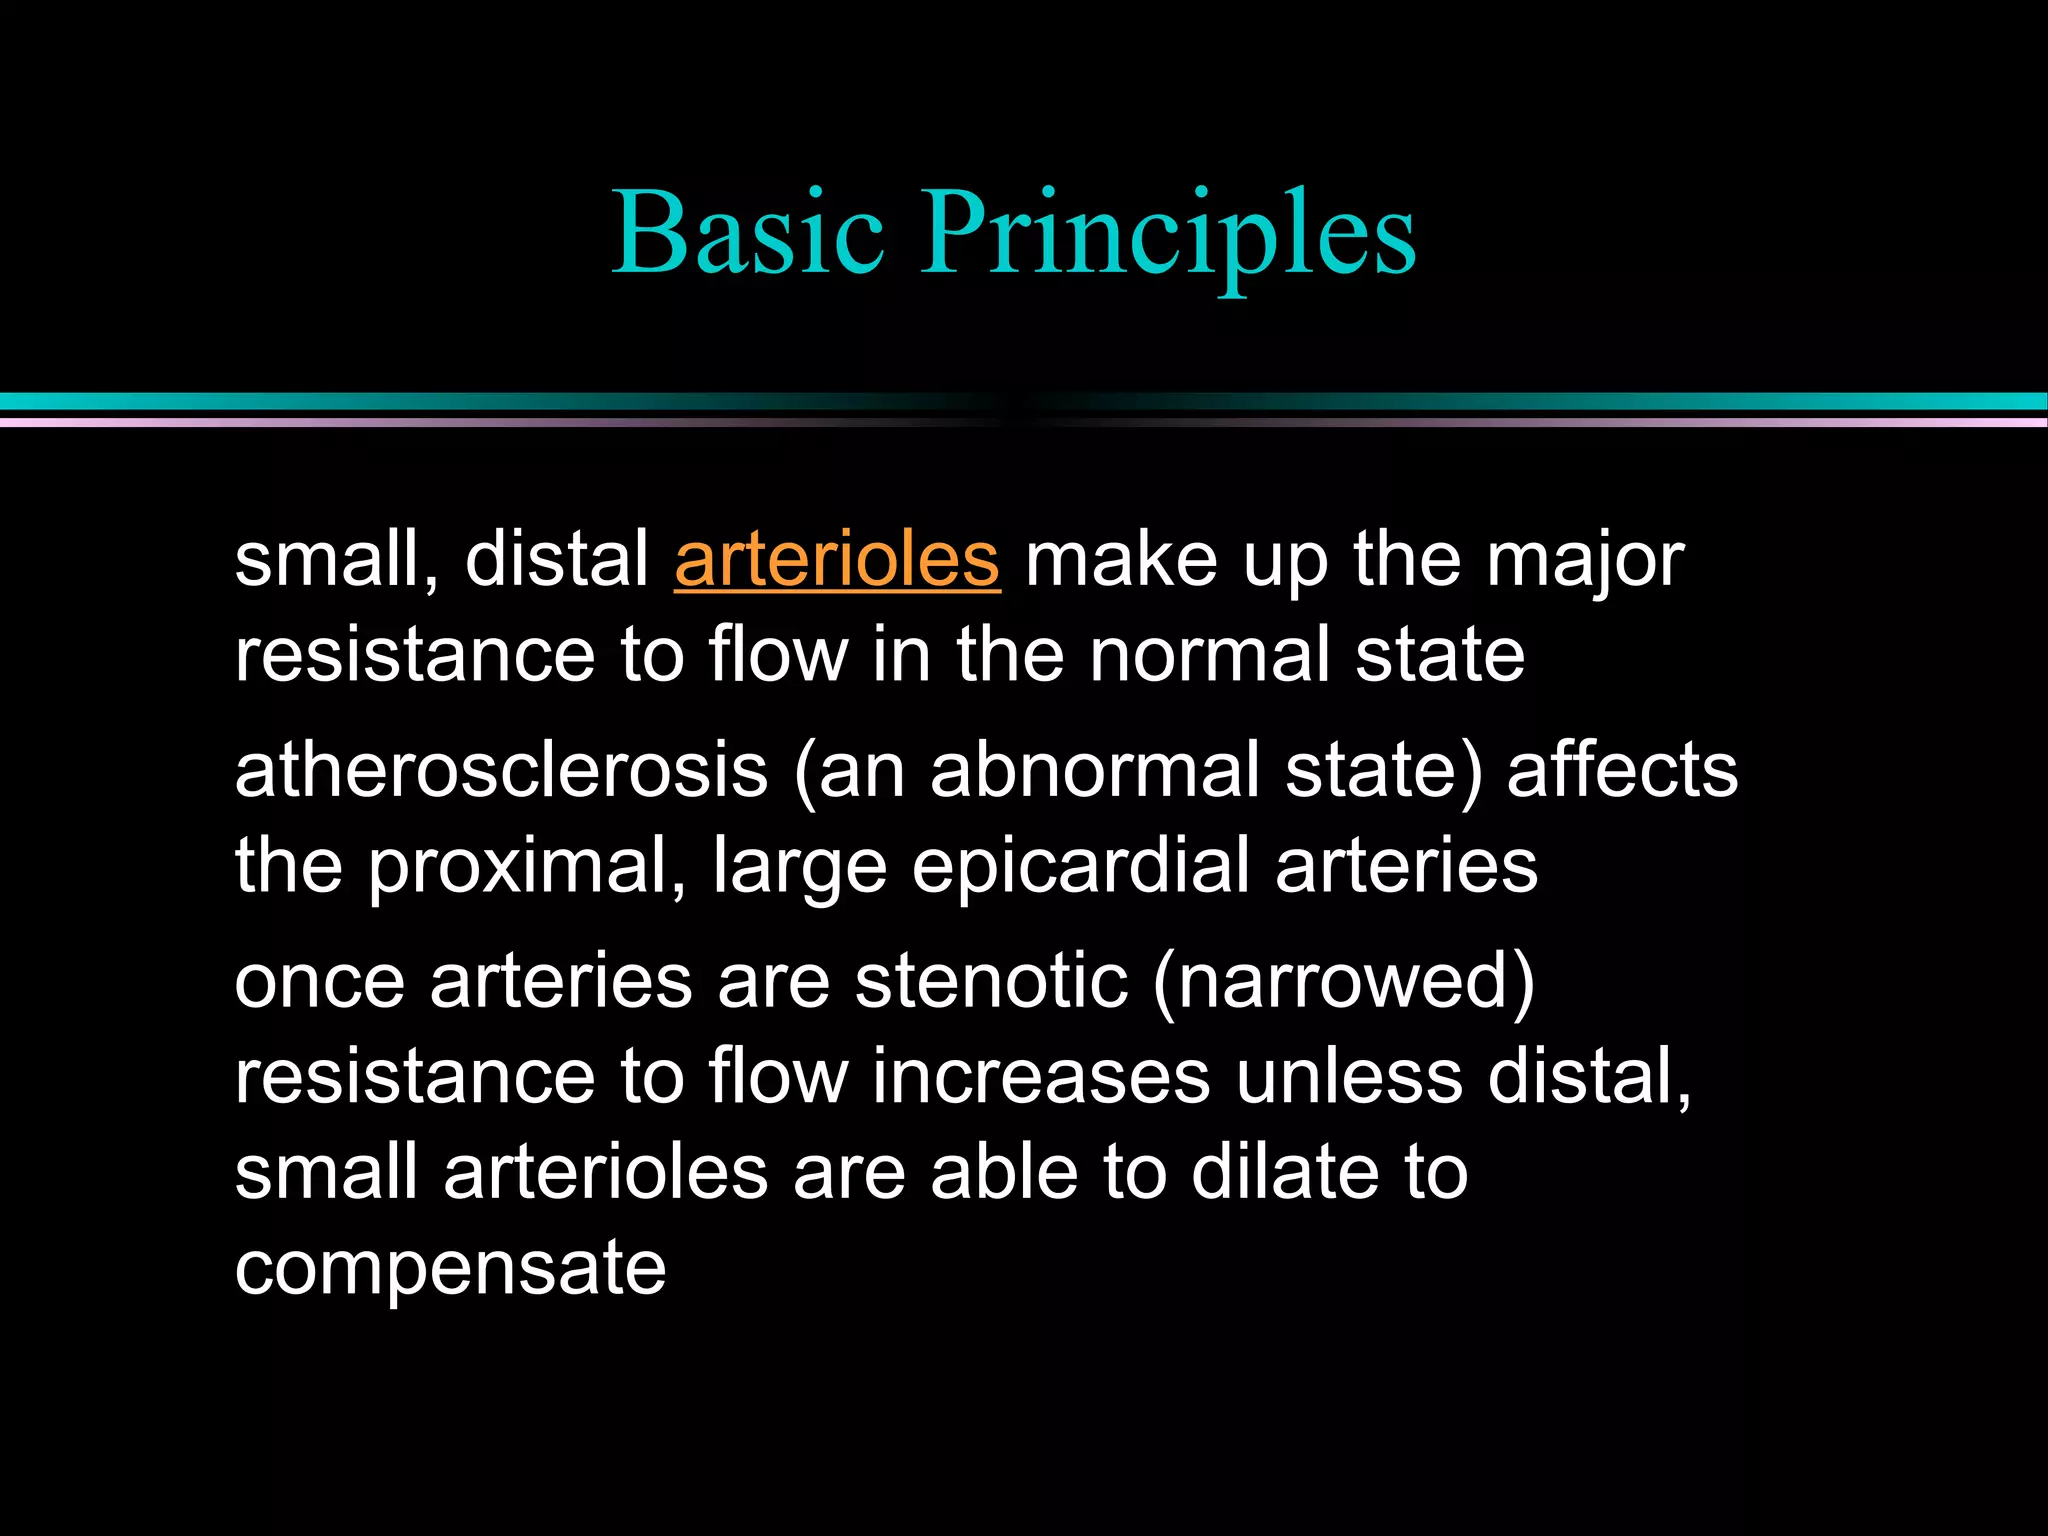
Explanation of coronary arteries' normal anatomy, physiological principles, and the impact of atherosclerosis on blood flow.
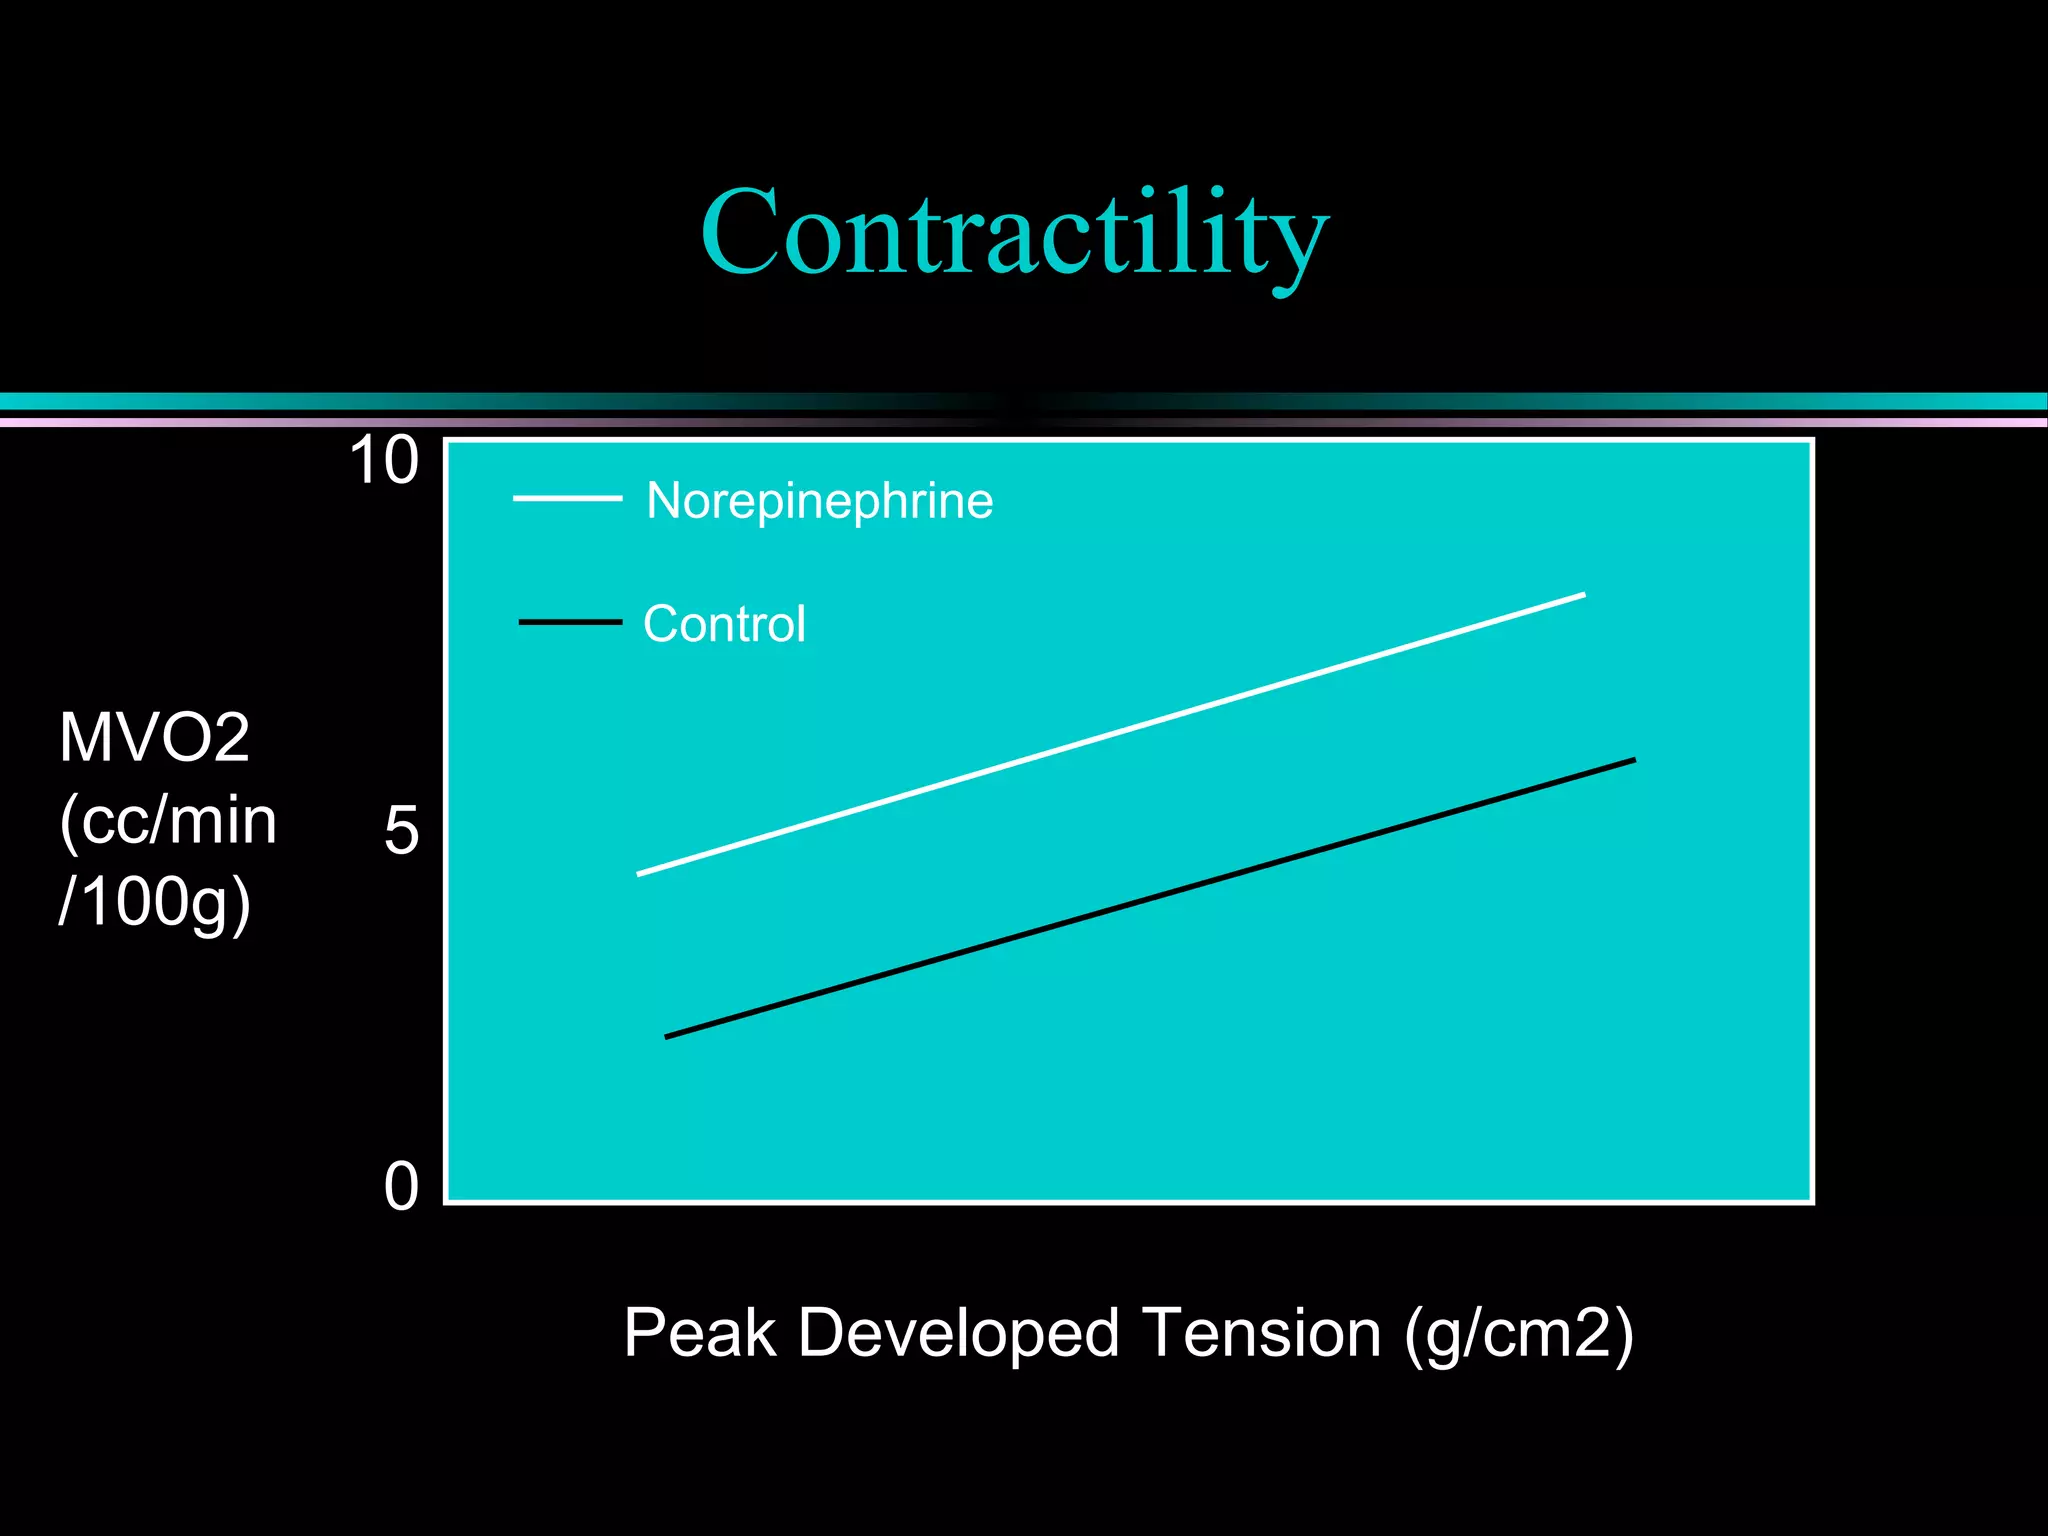
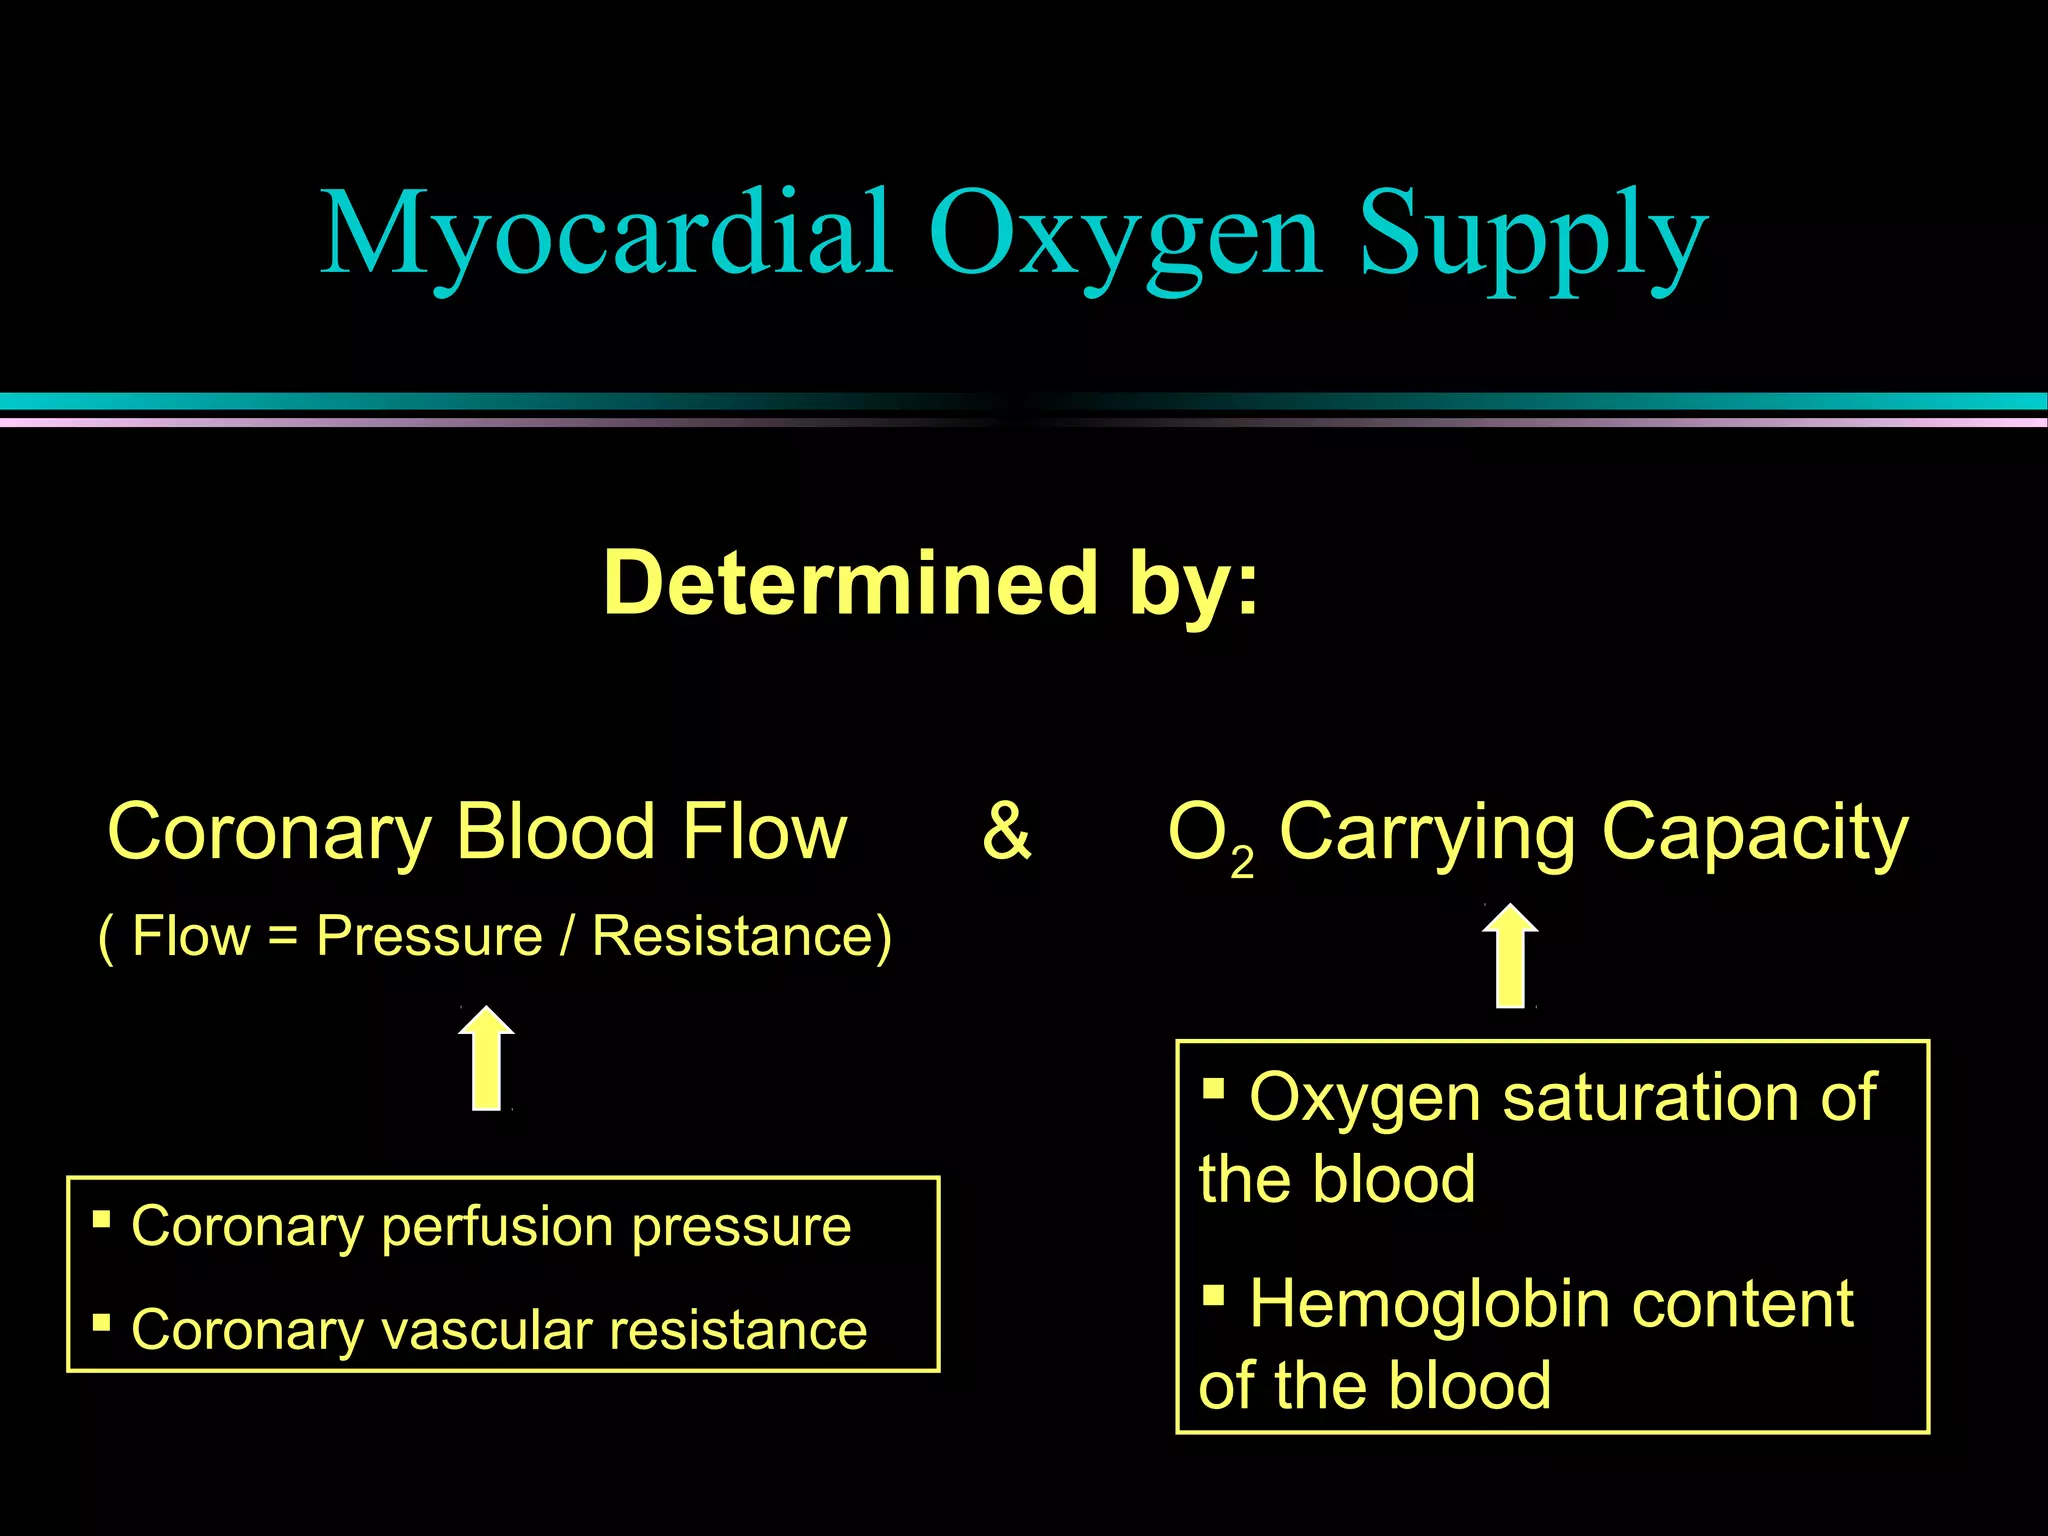
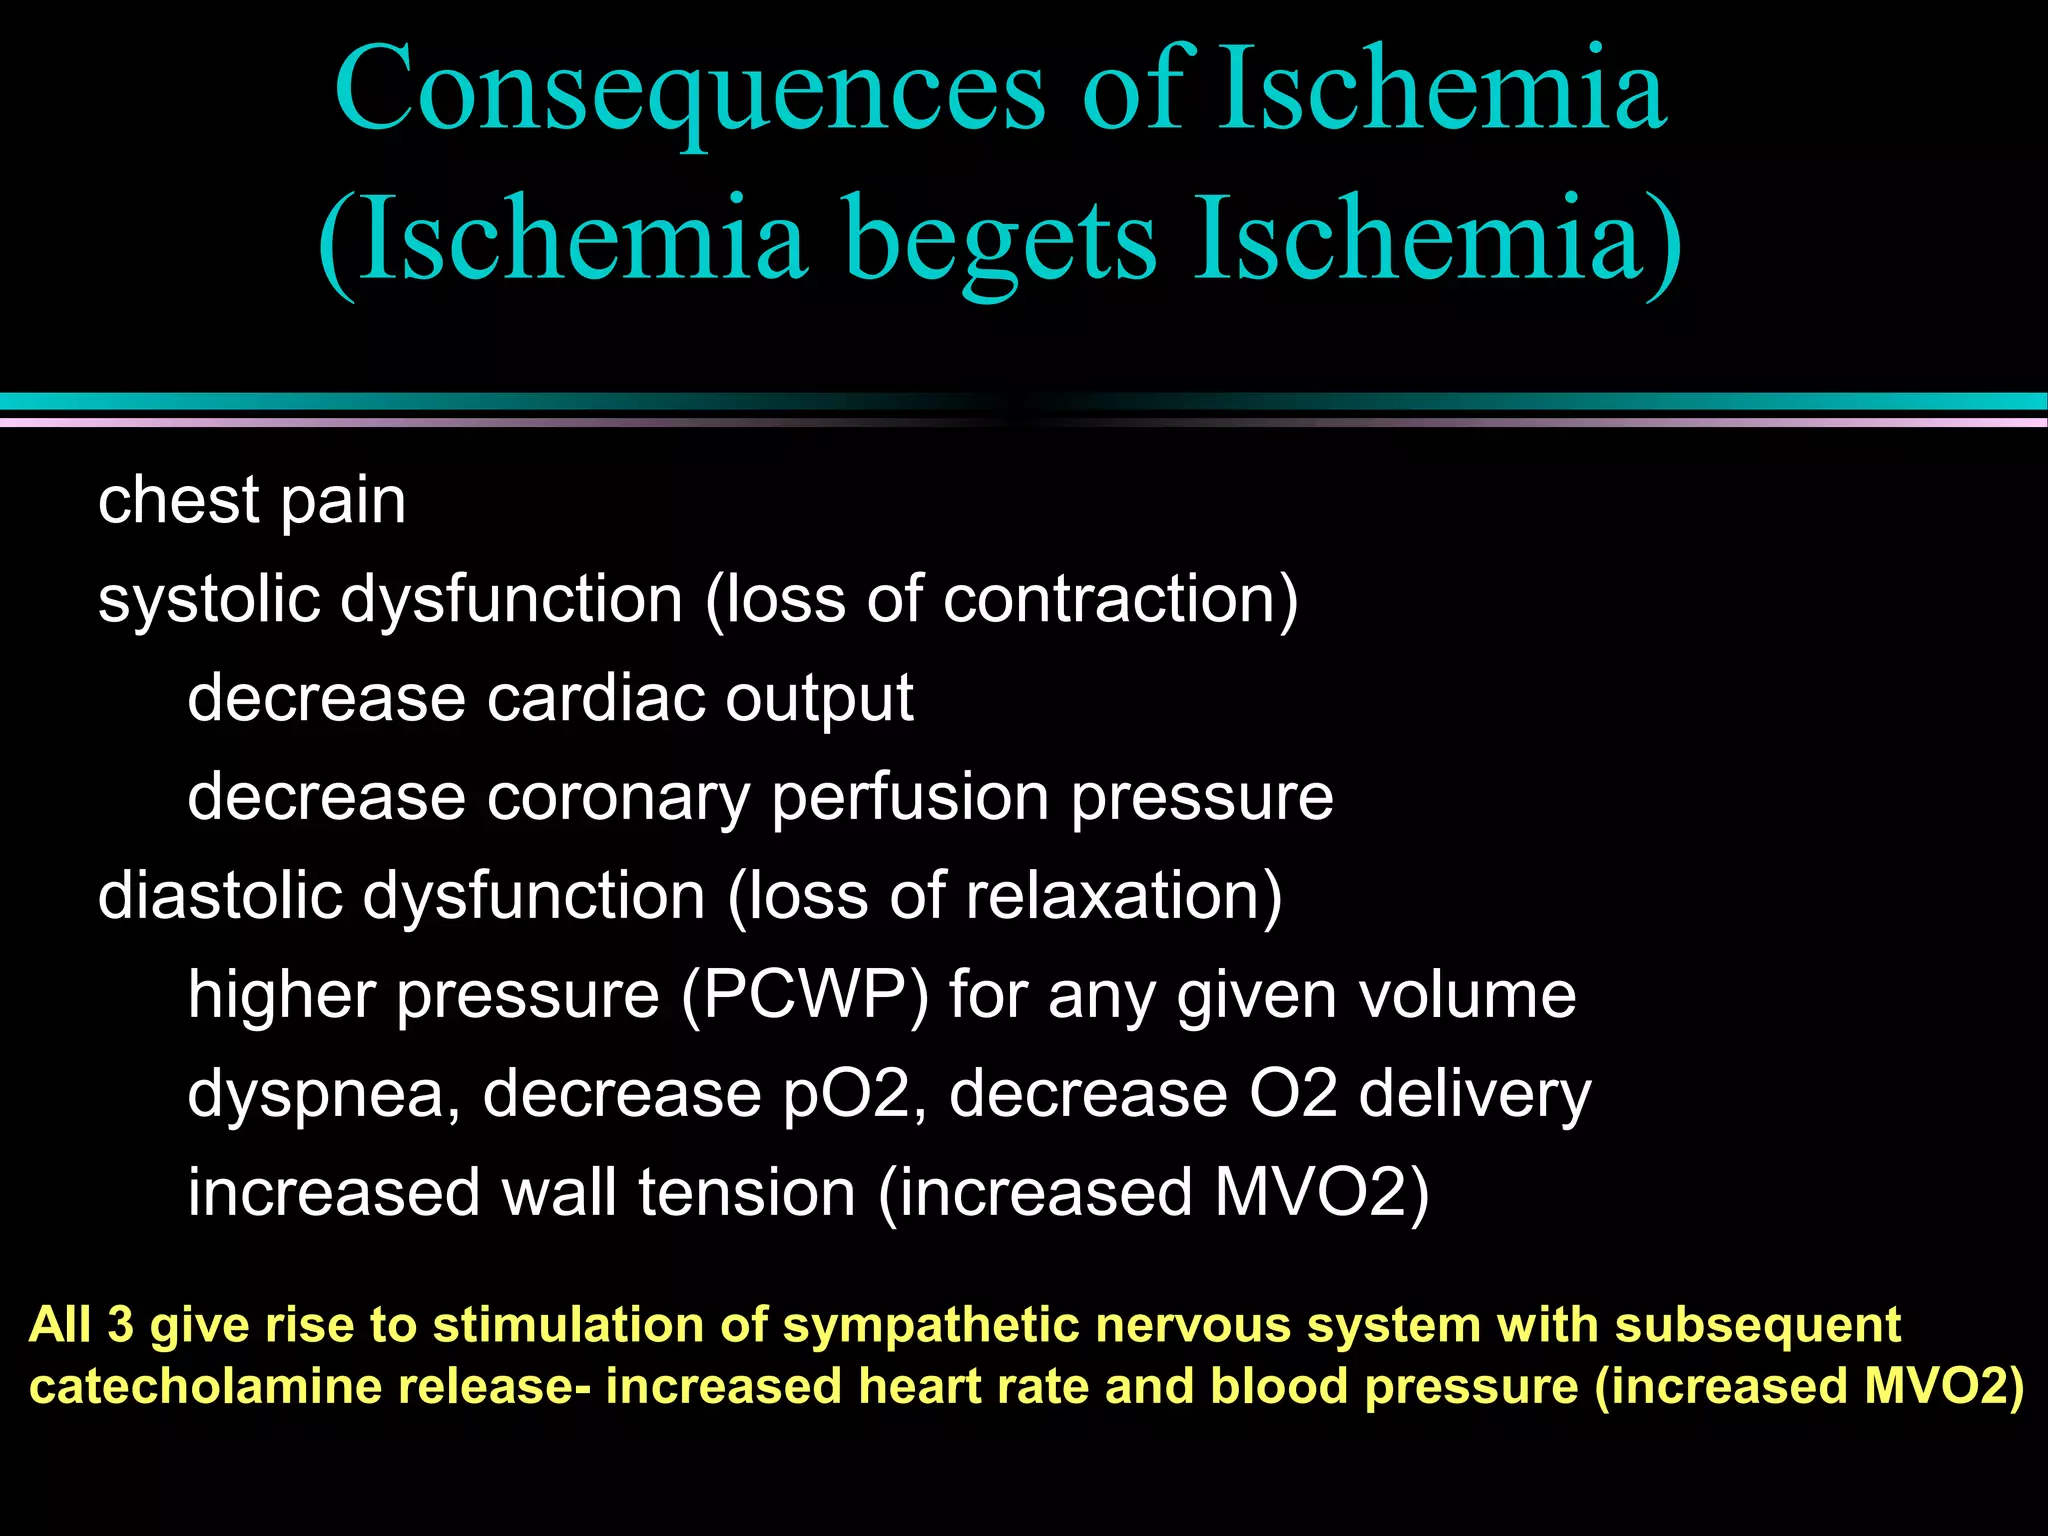
Myocardial ischemia occurs when oxygen demand exceeds supply; defined by MVO2 which depends on heart rate, contractility, and wall tension.
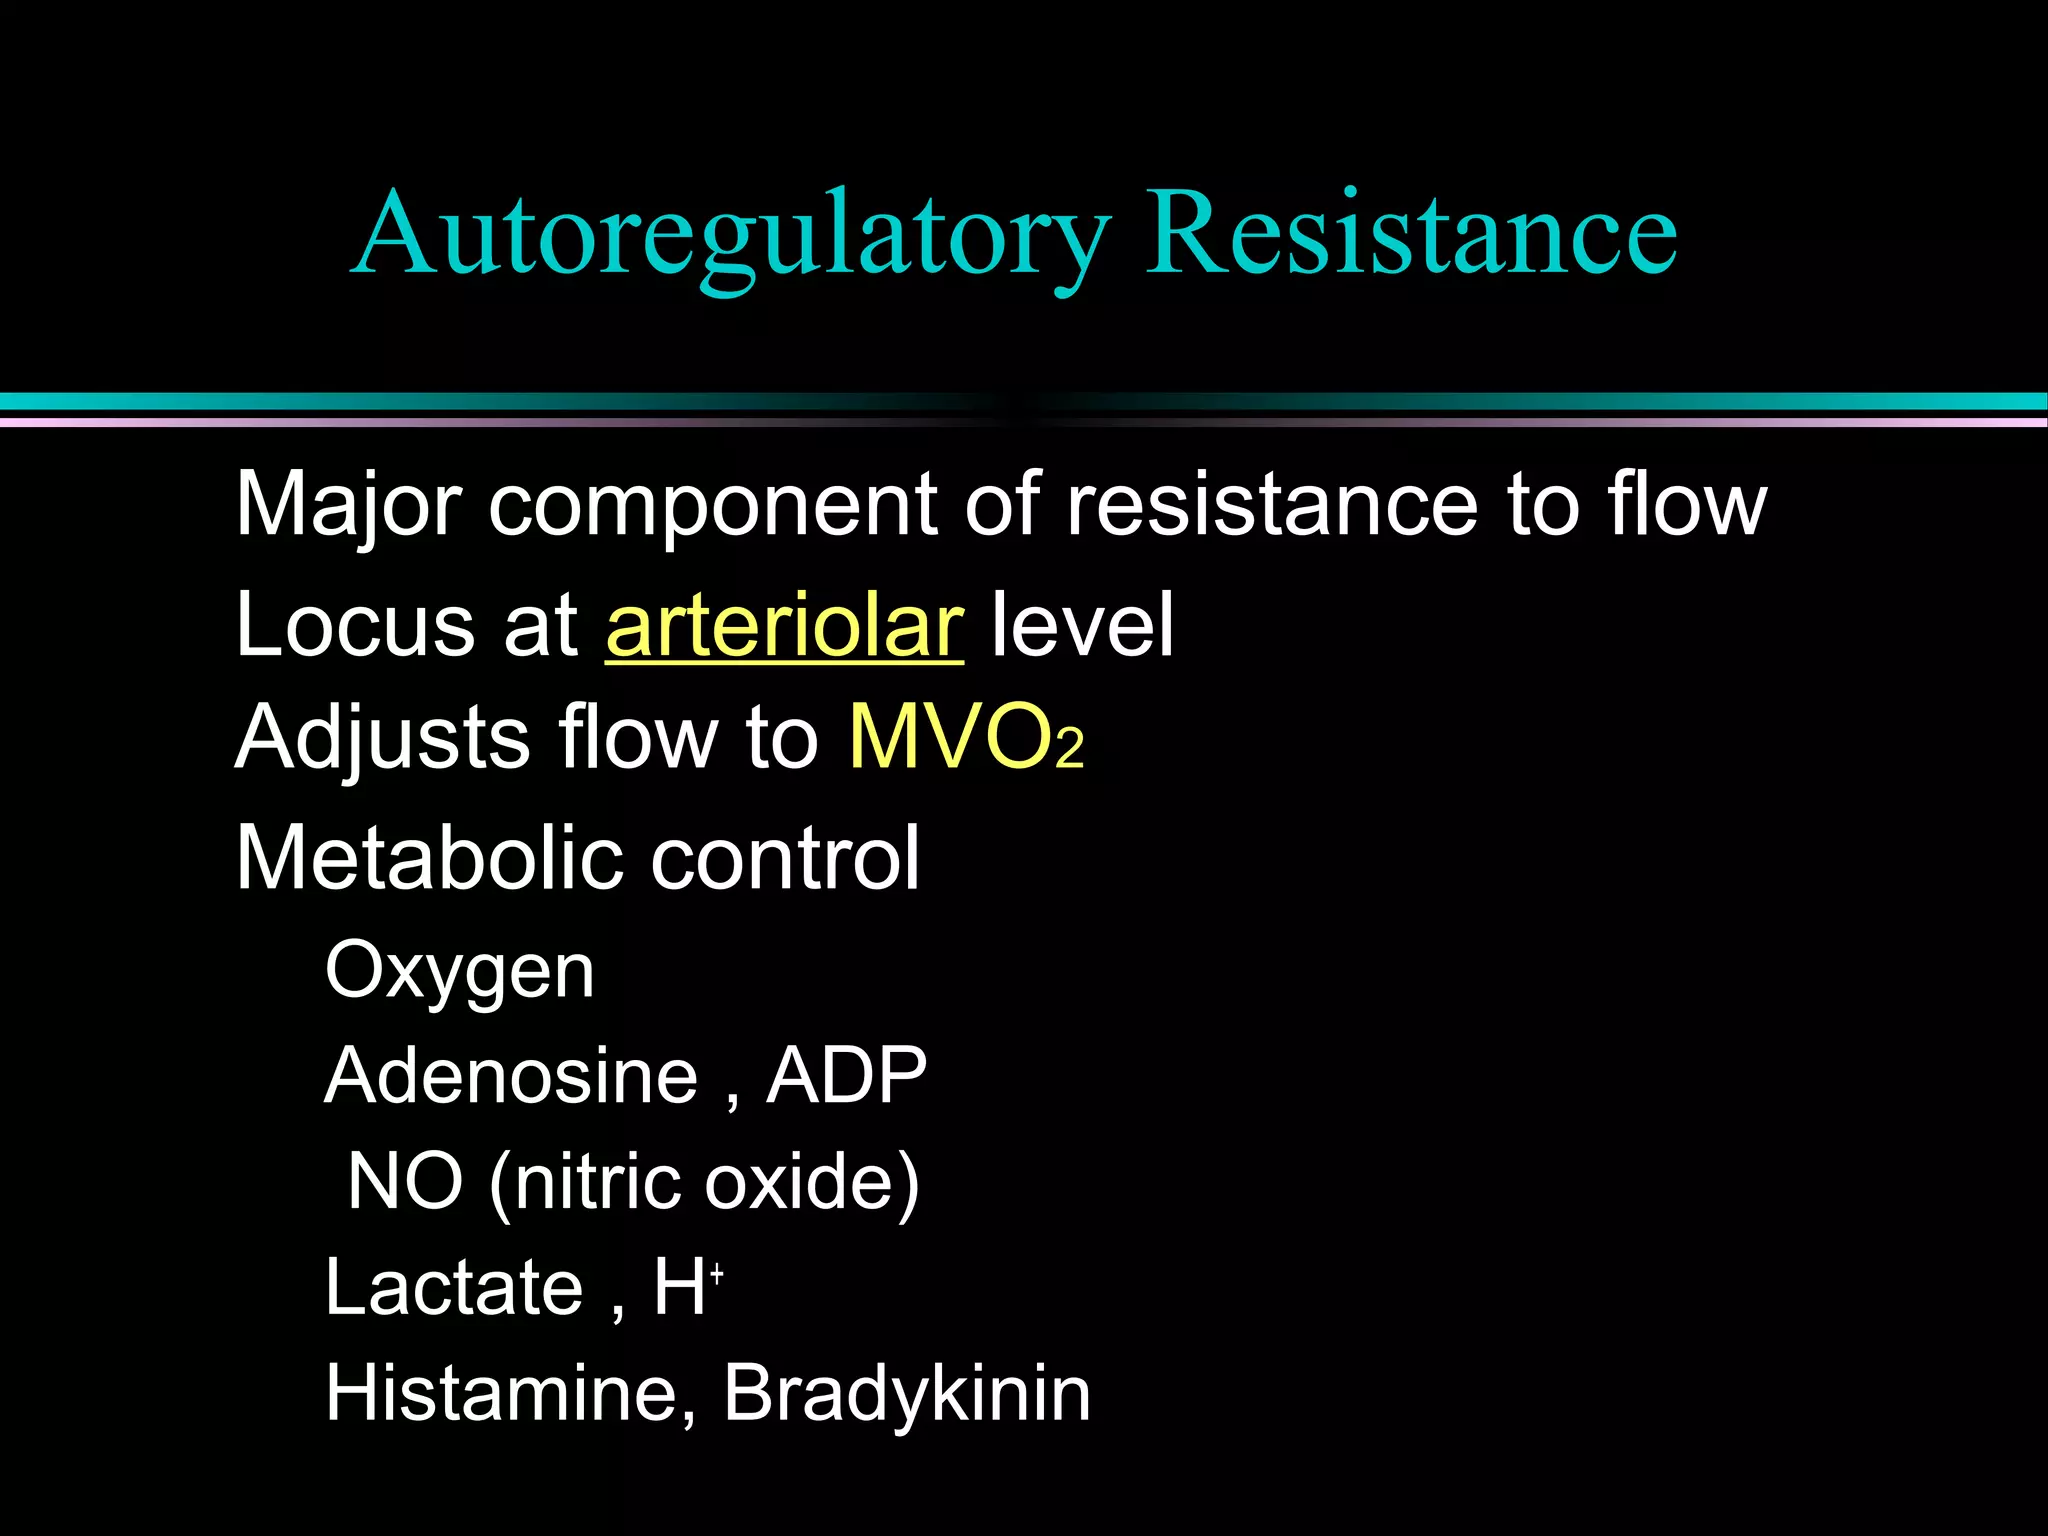
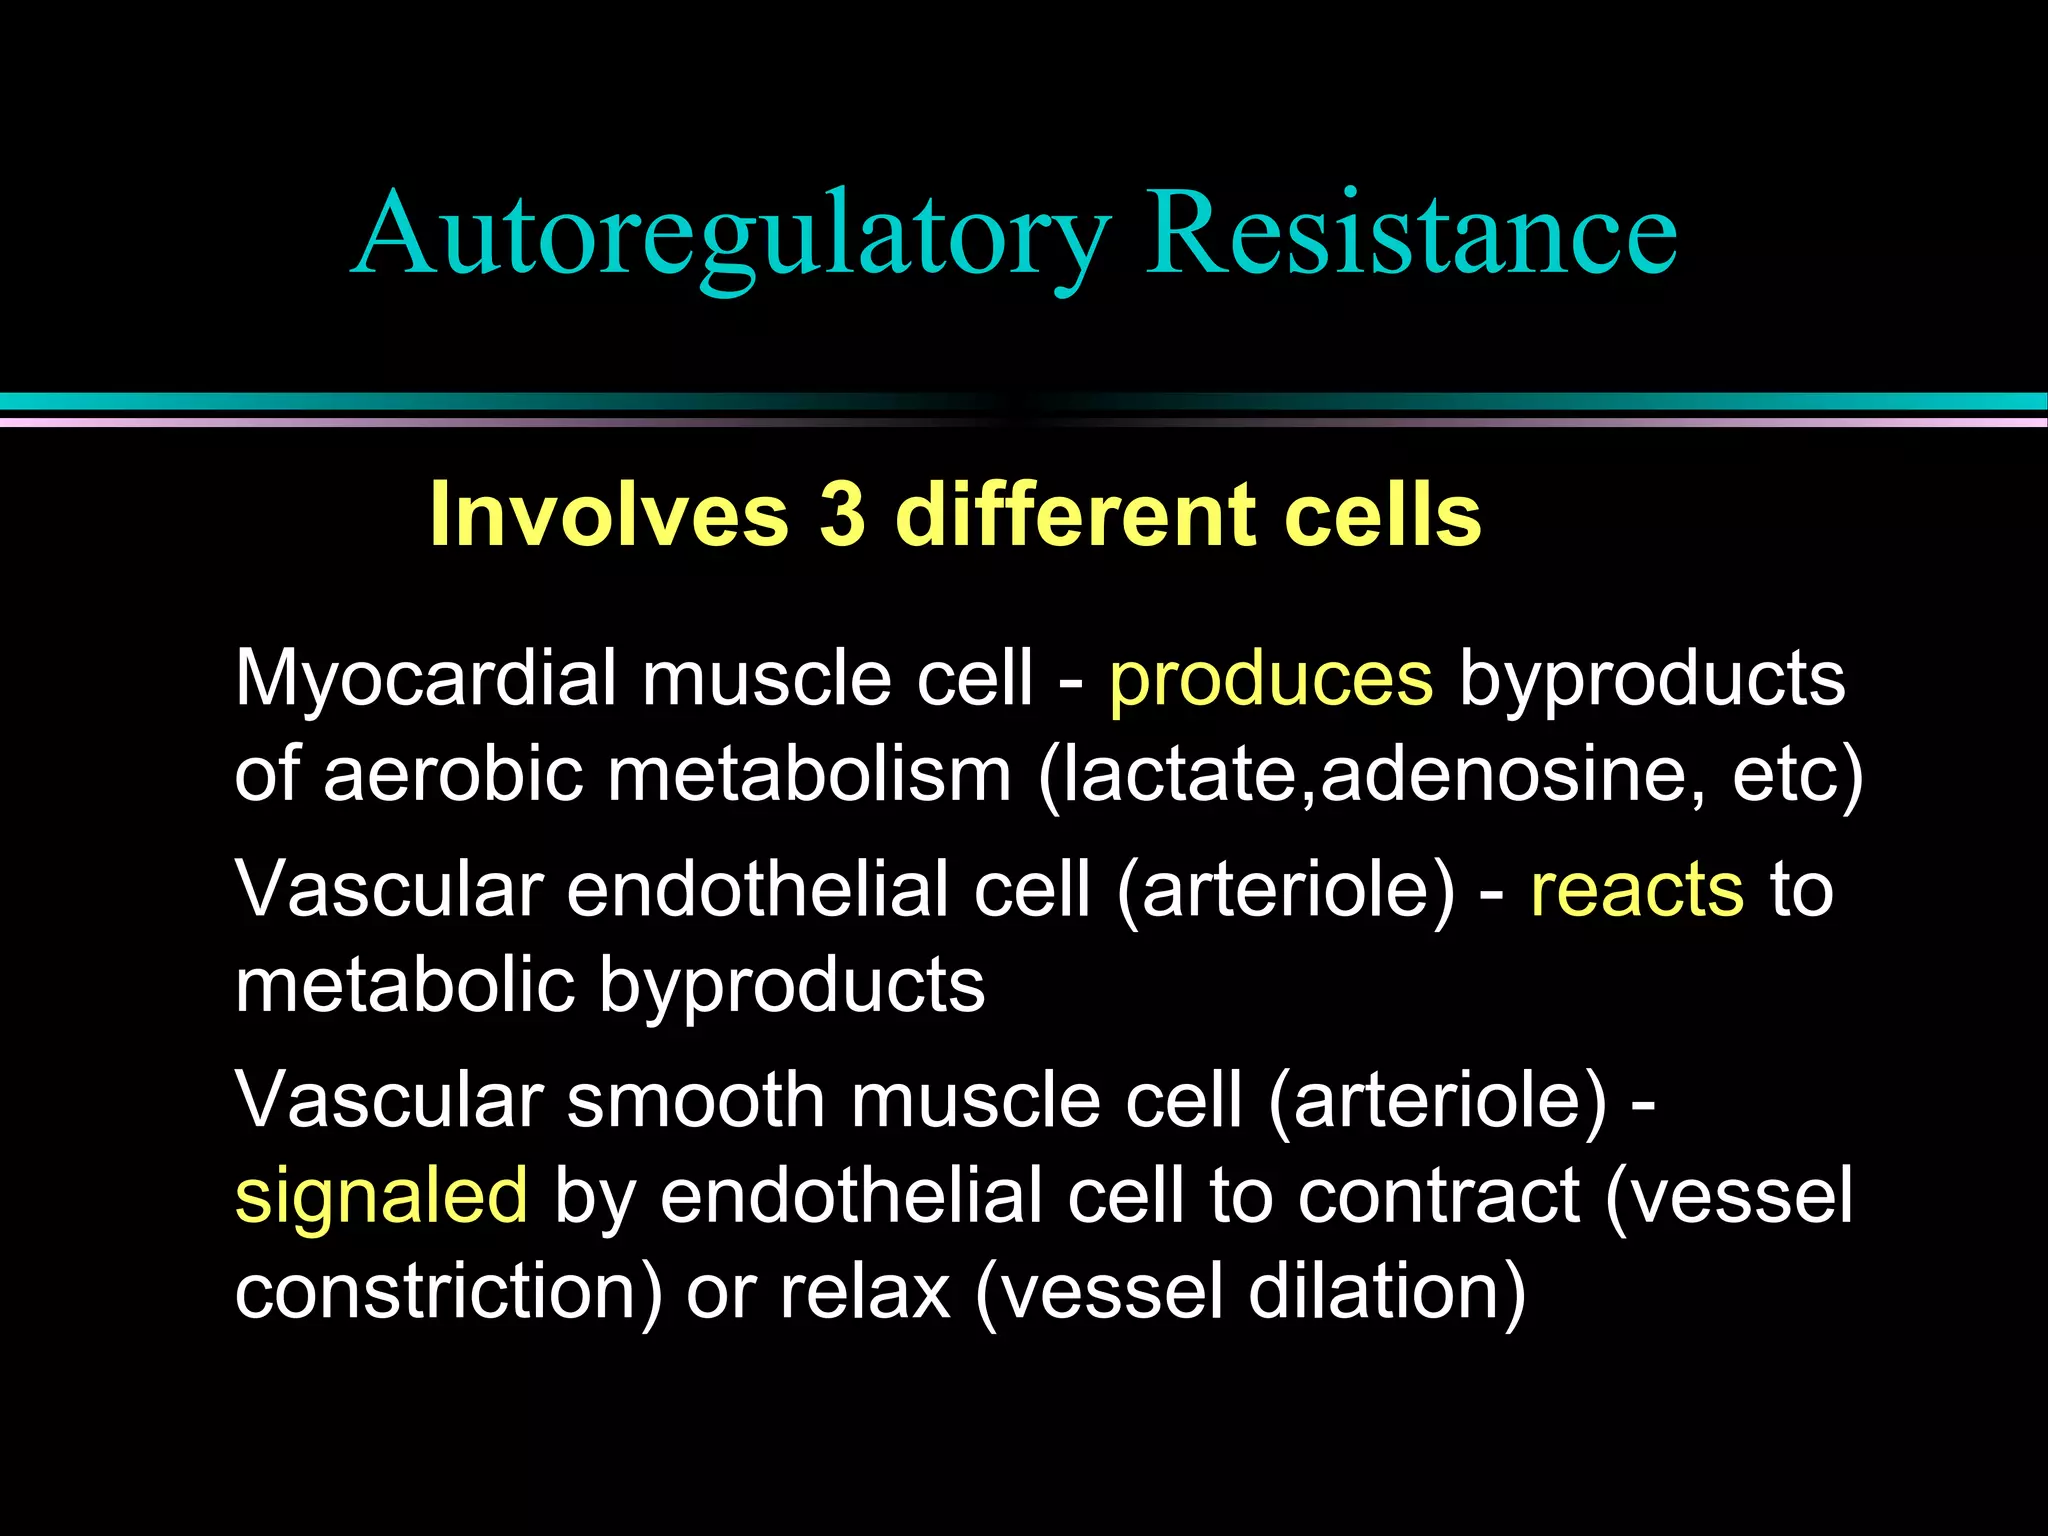
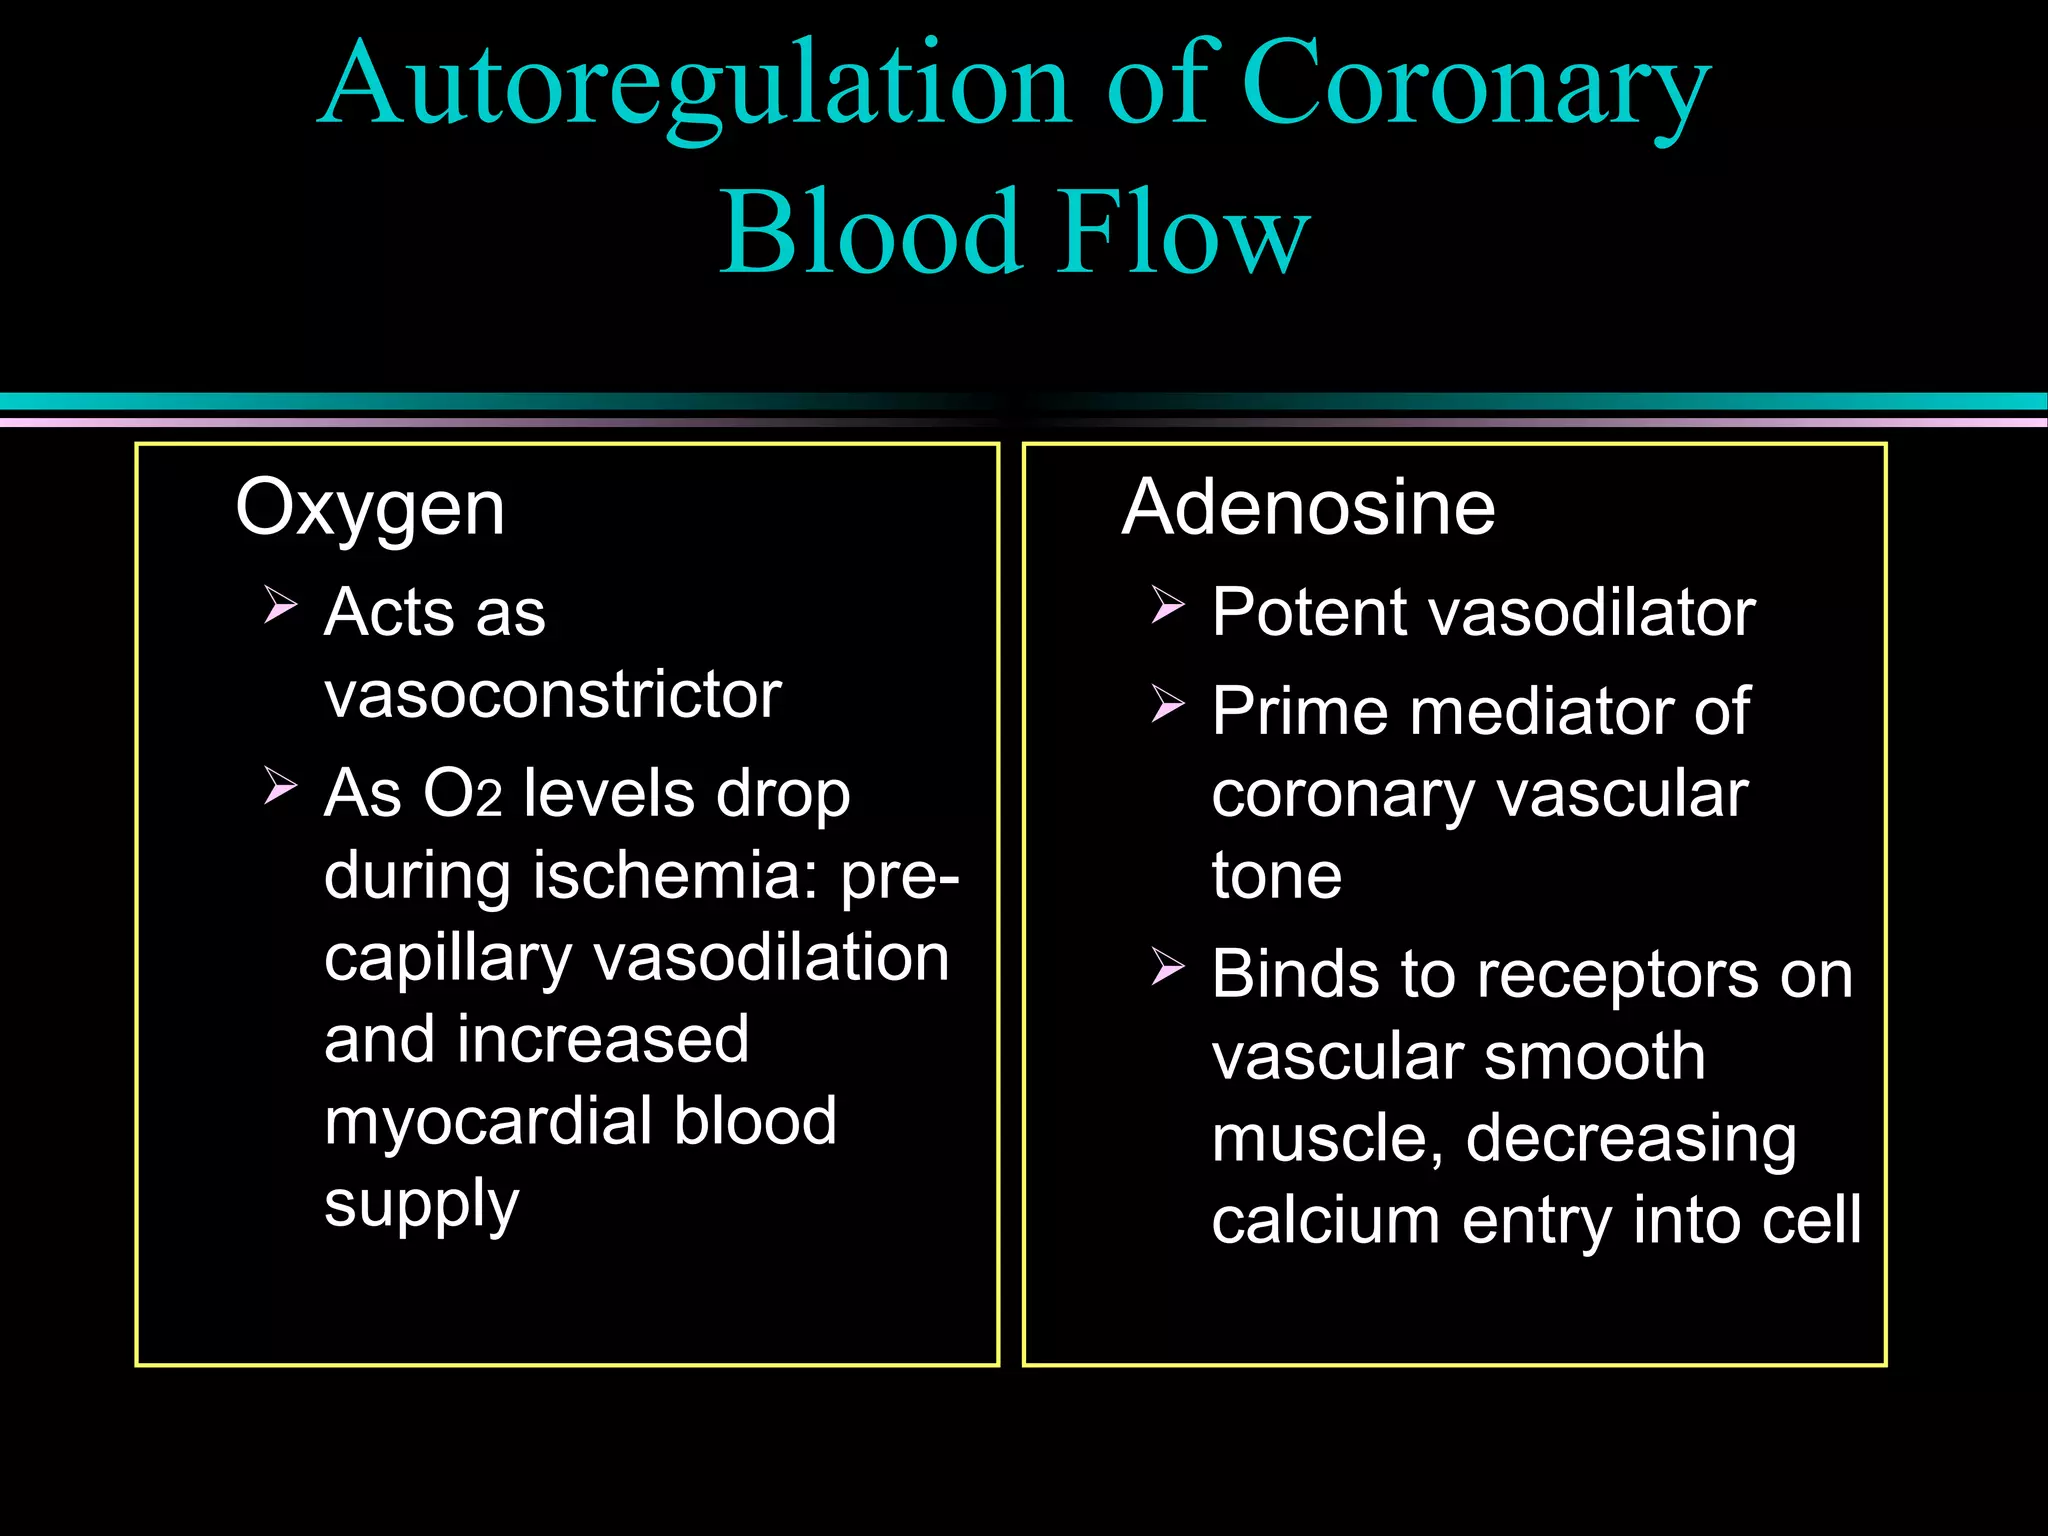
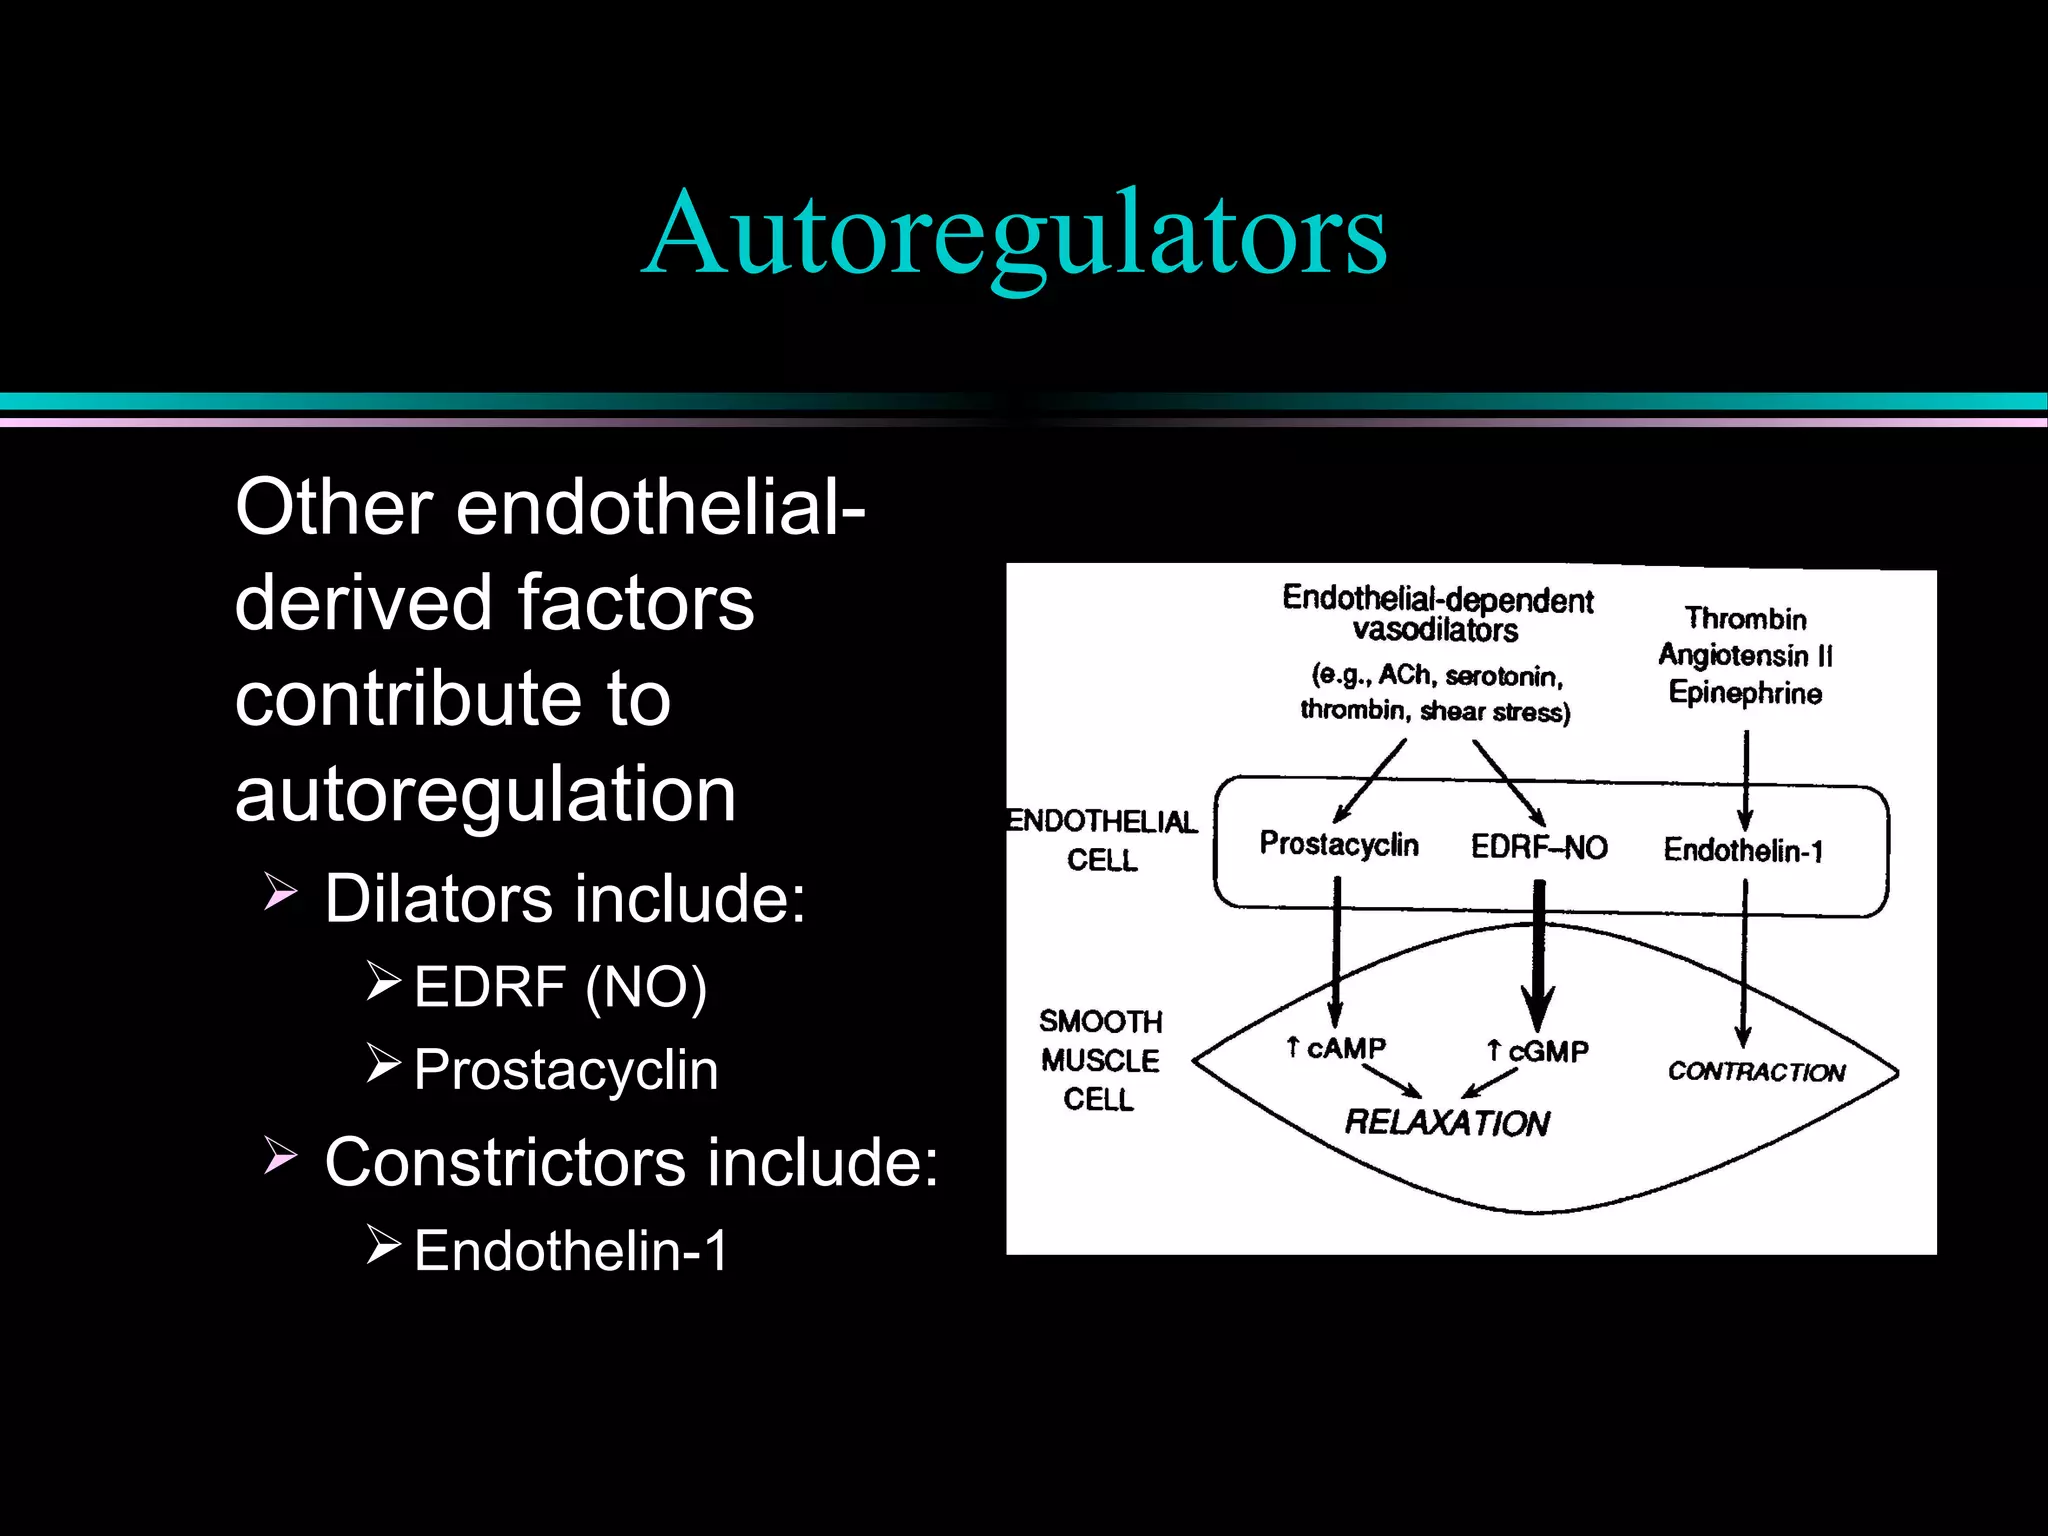
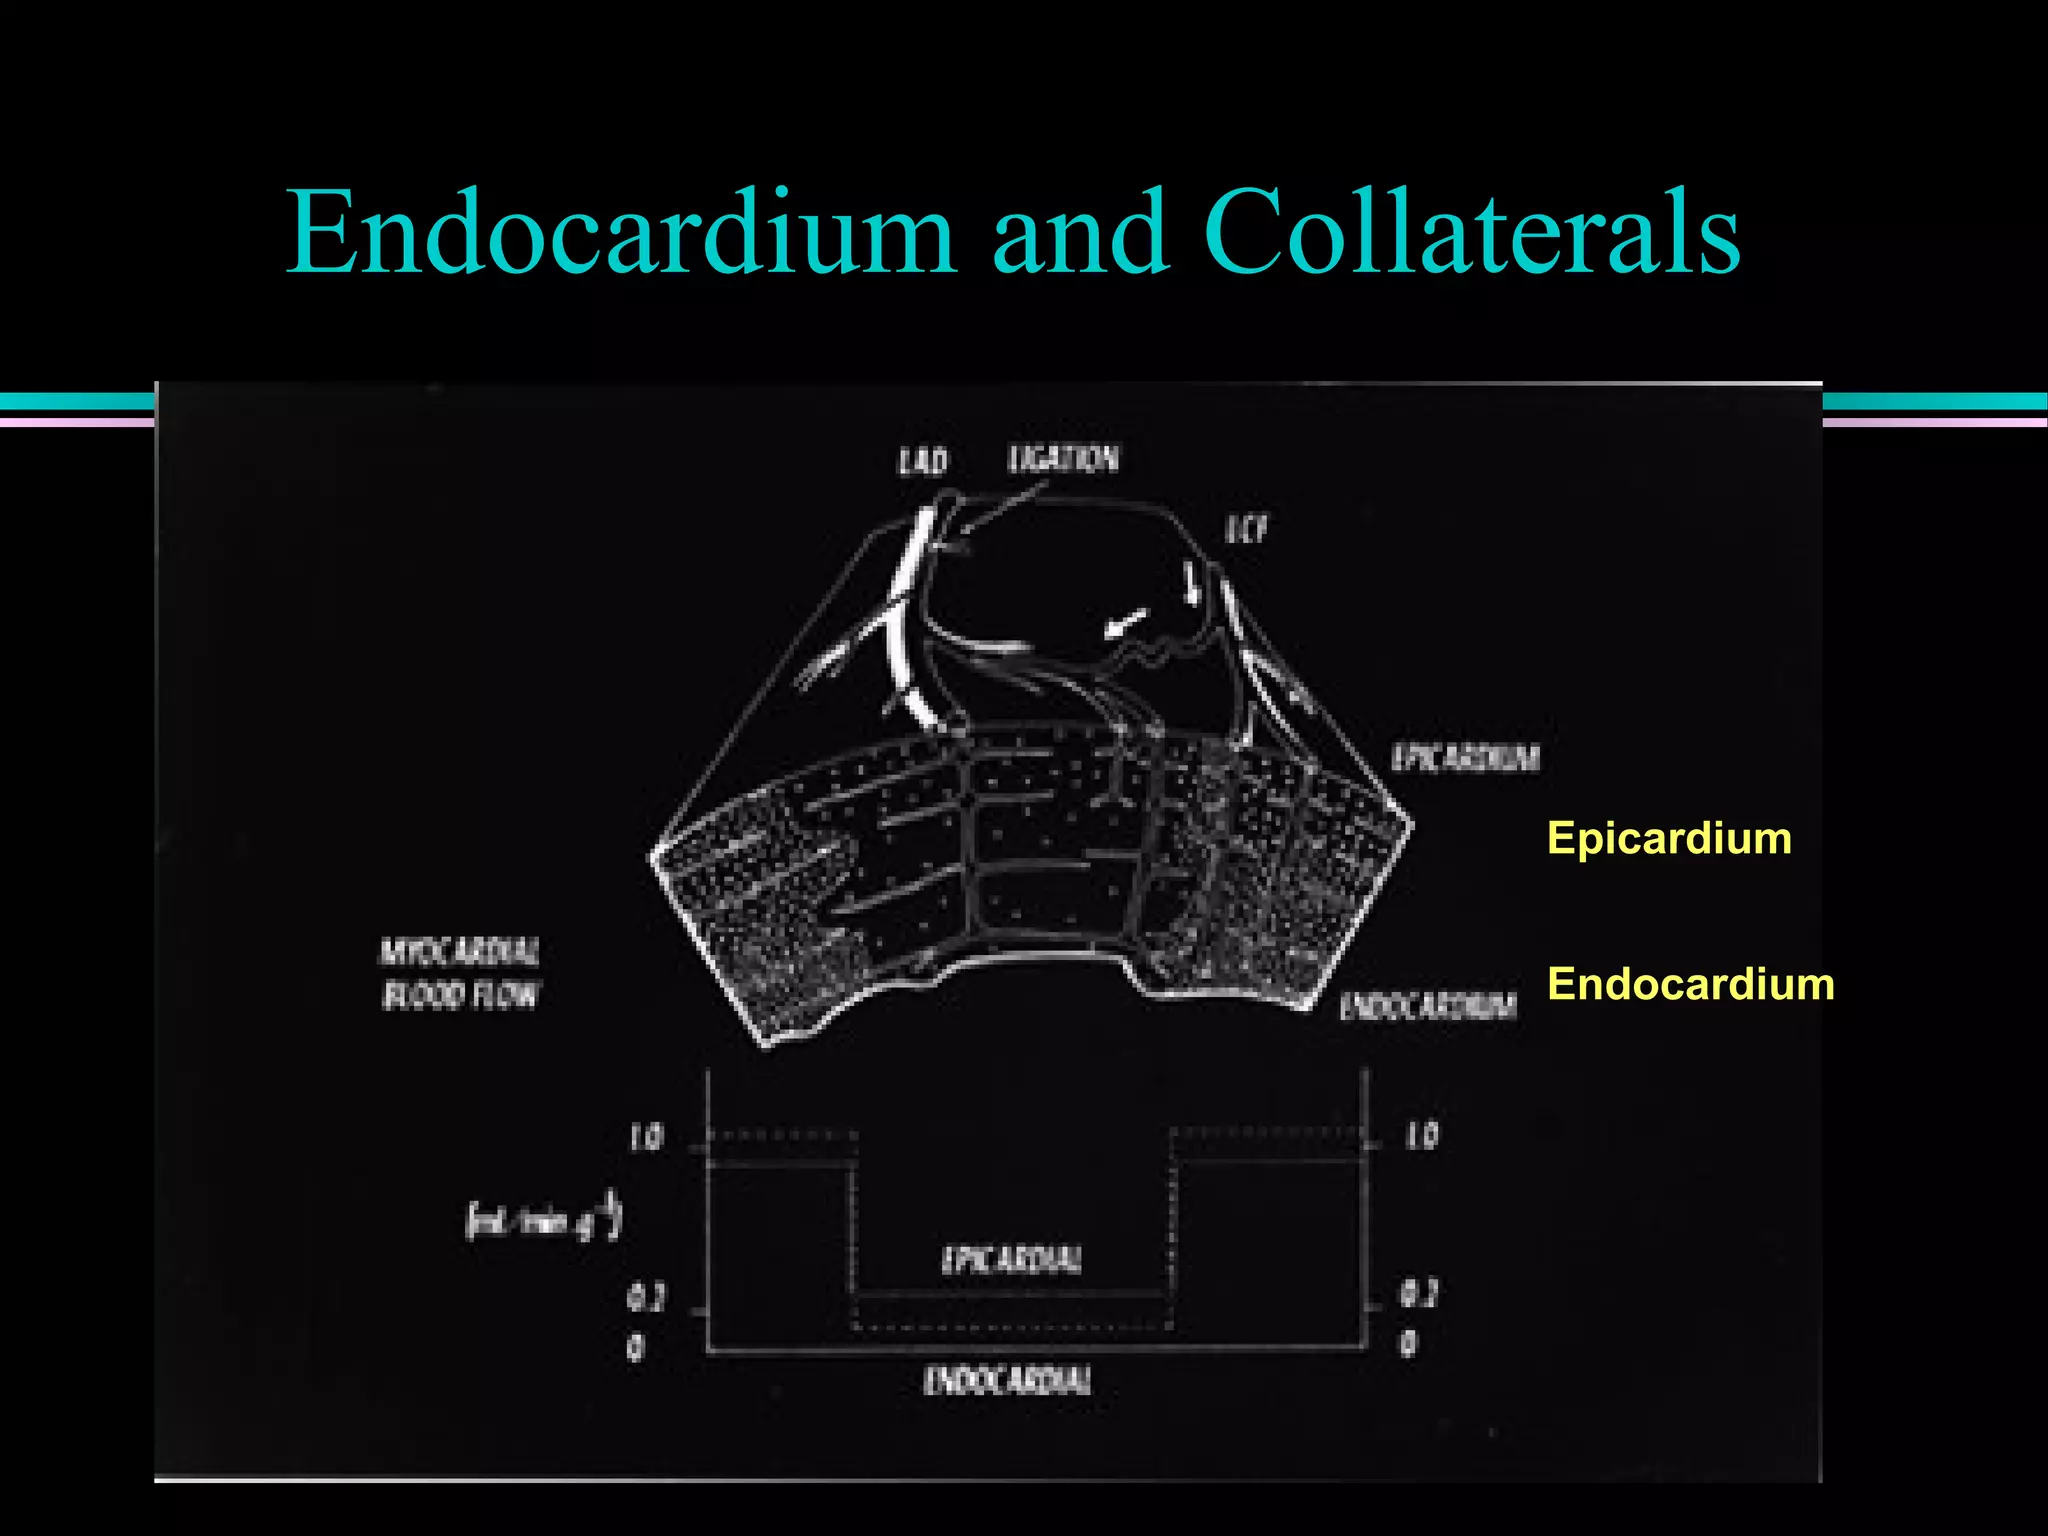
Factors determining myocardial oxygen supply, including coronary blood flow and autoregulation mechanisms involving metabolites like adenosine.
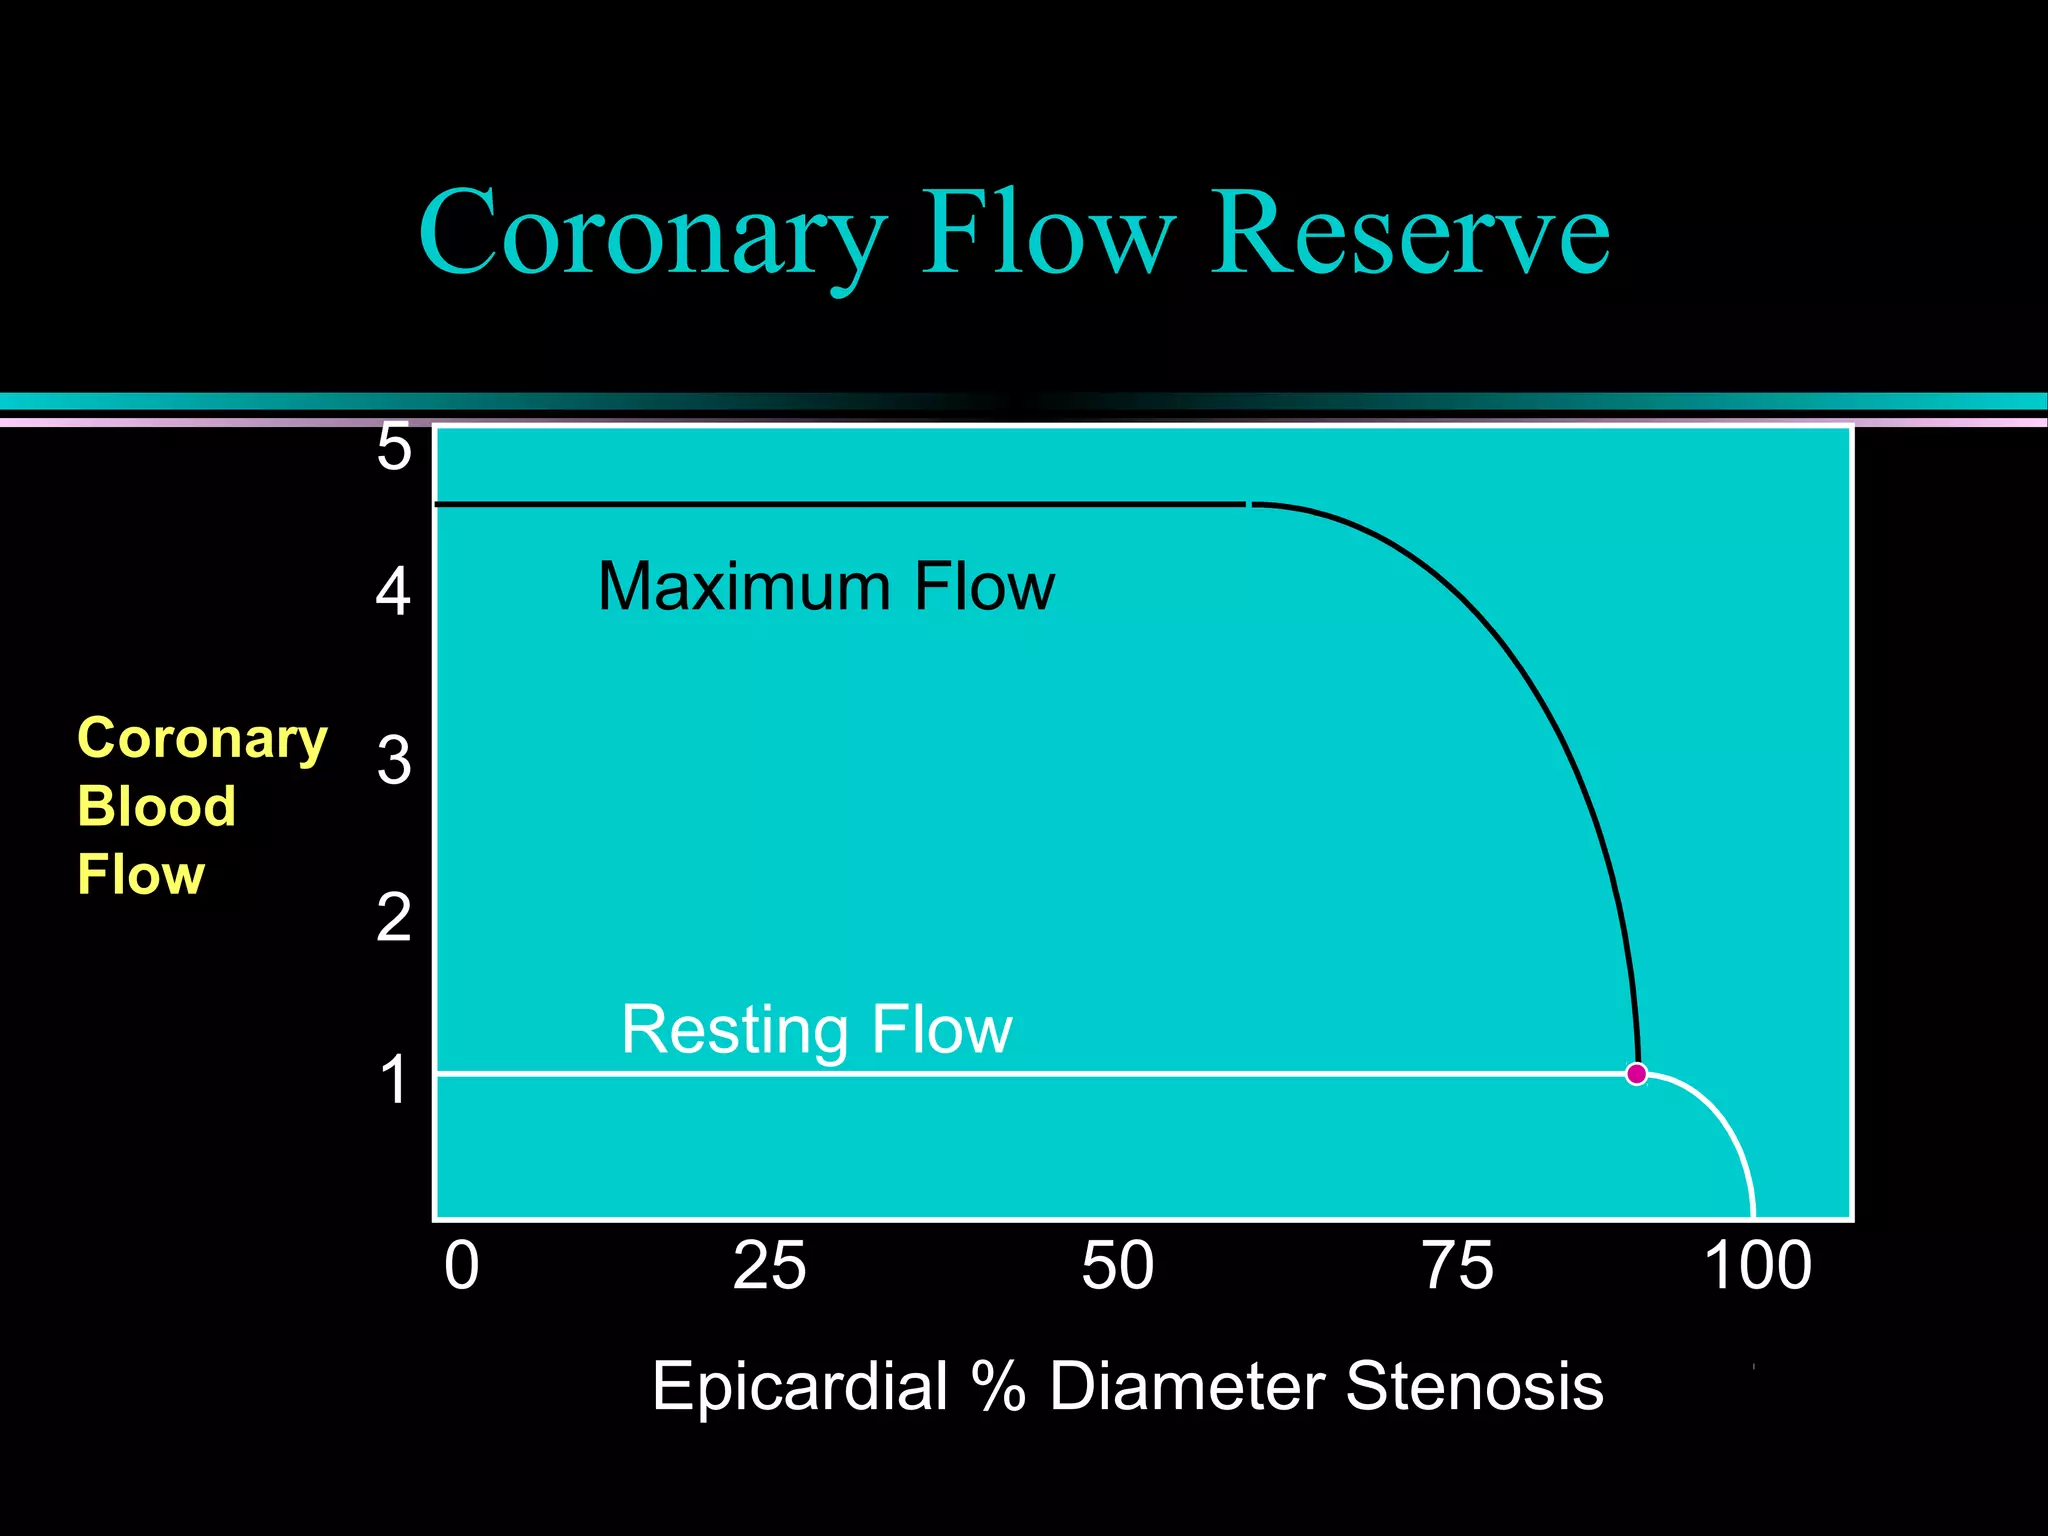
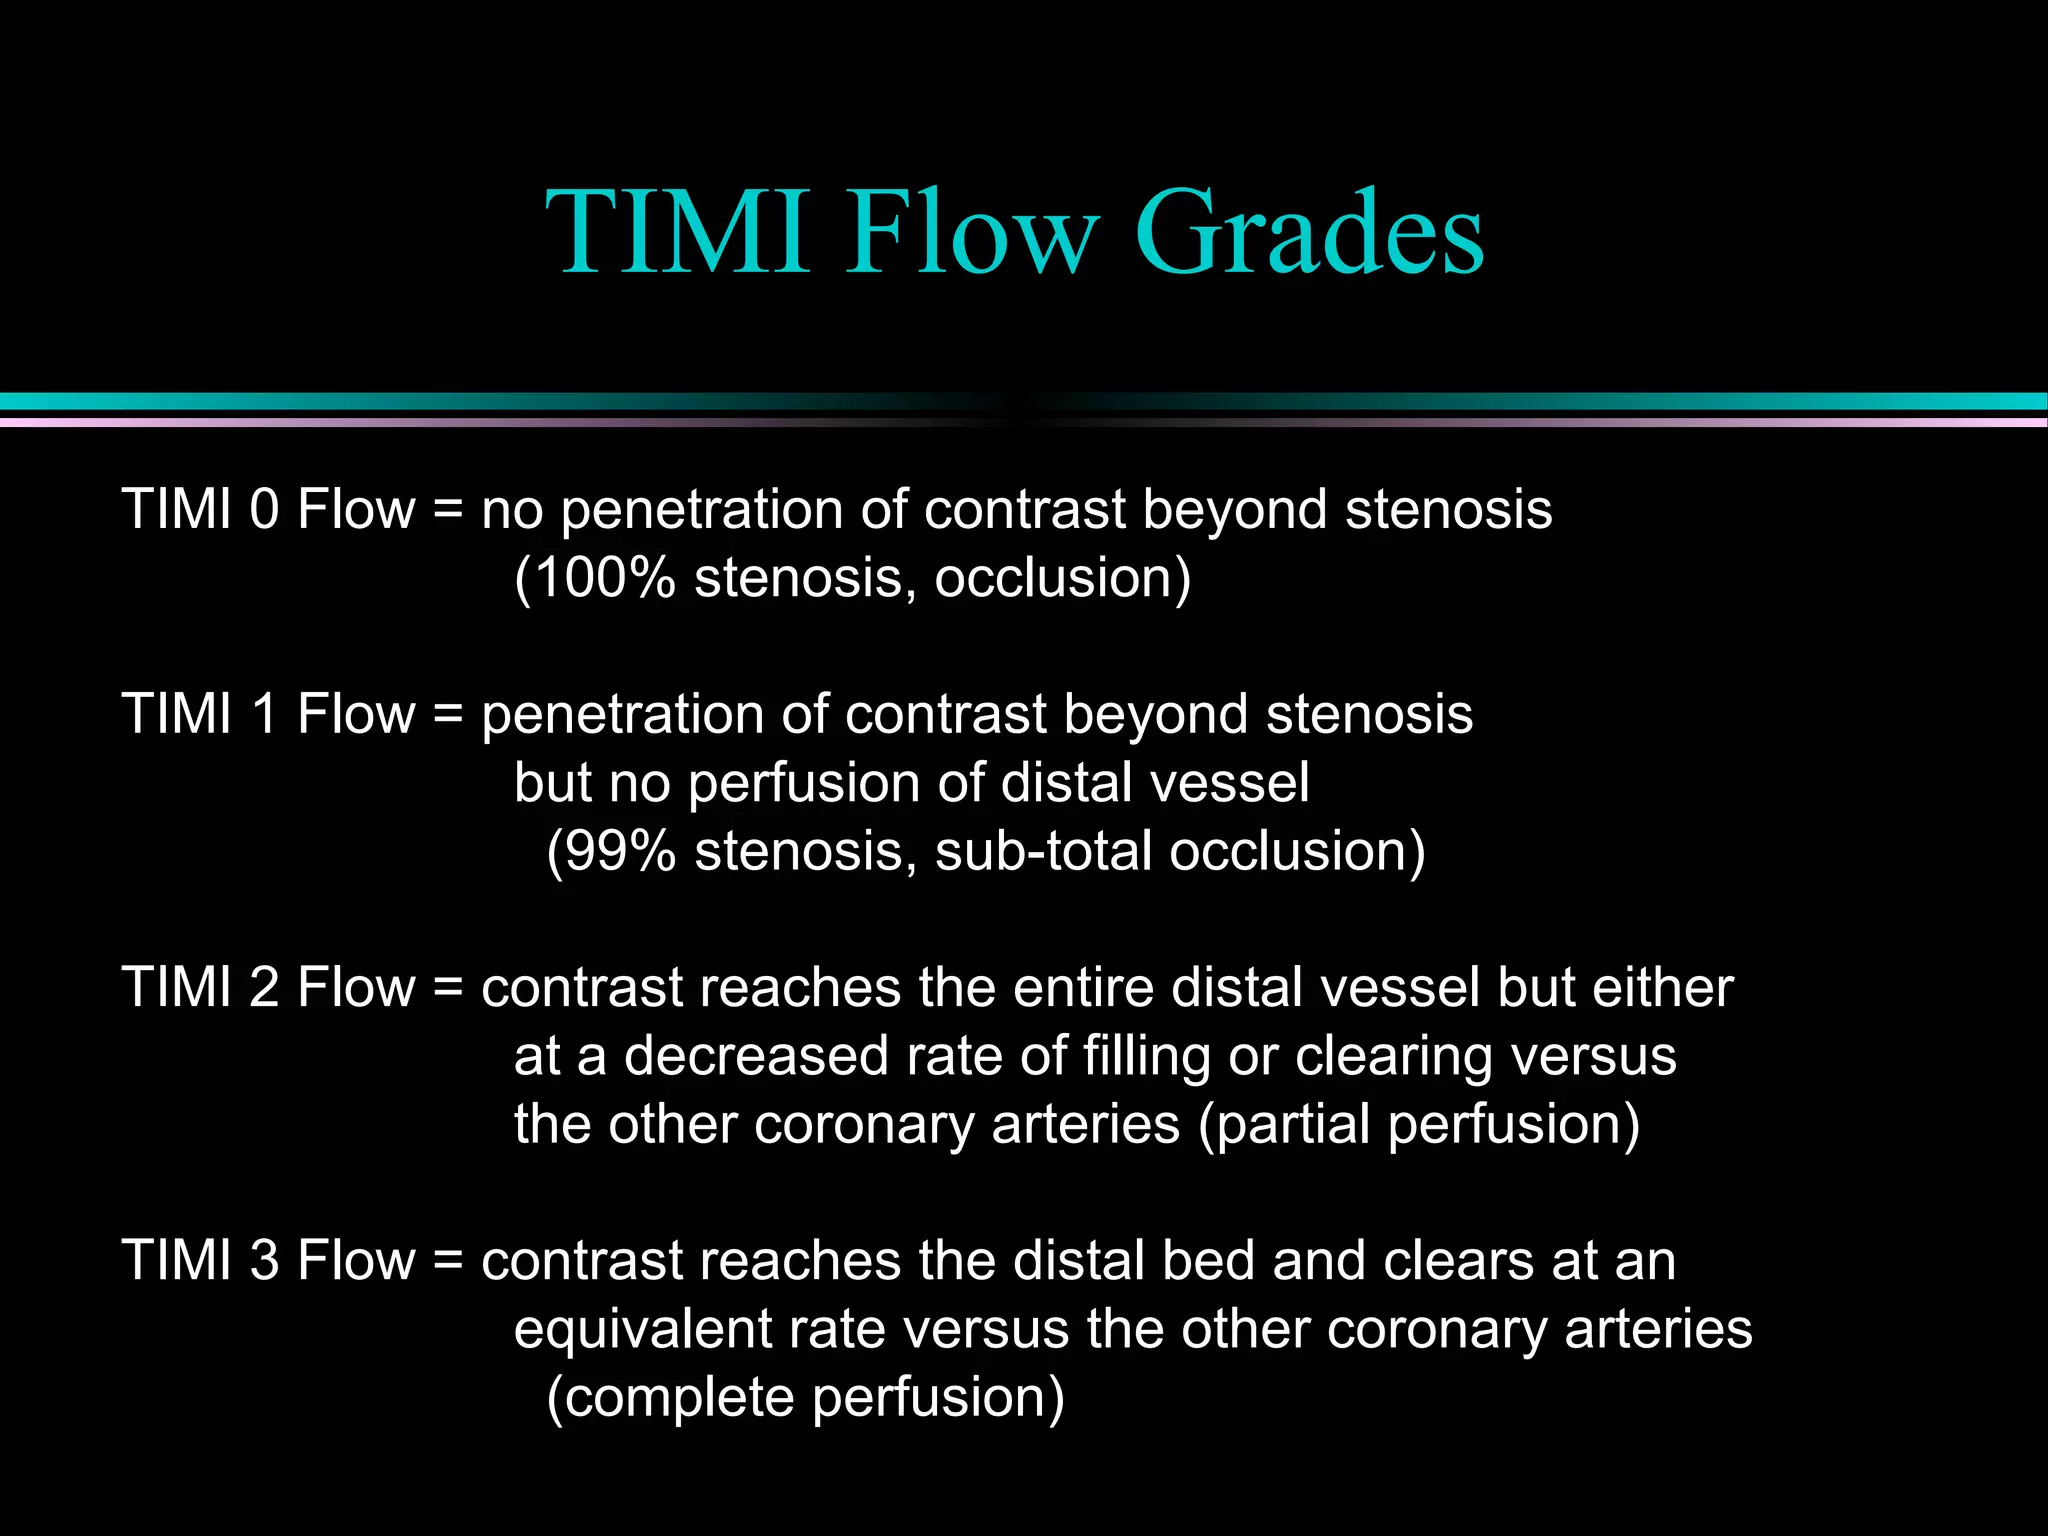
Coronary flow reserve (CFR) and its correlation with ischemia, detailing autoregulatory responses and the impact of stenosis on perfusion.
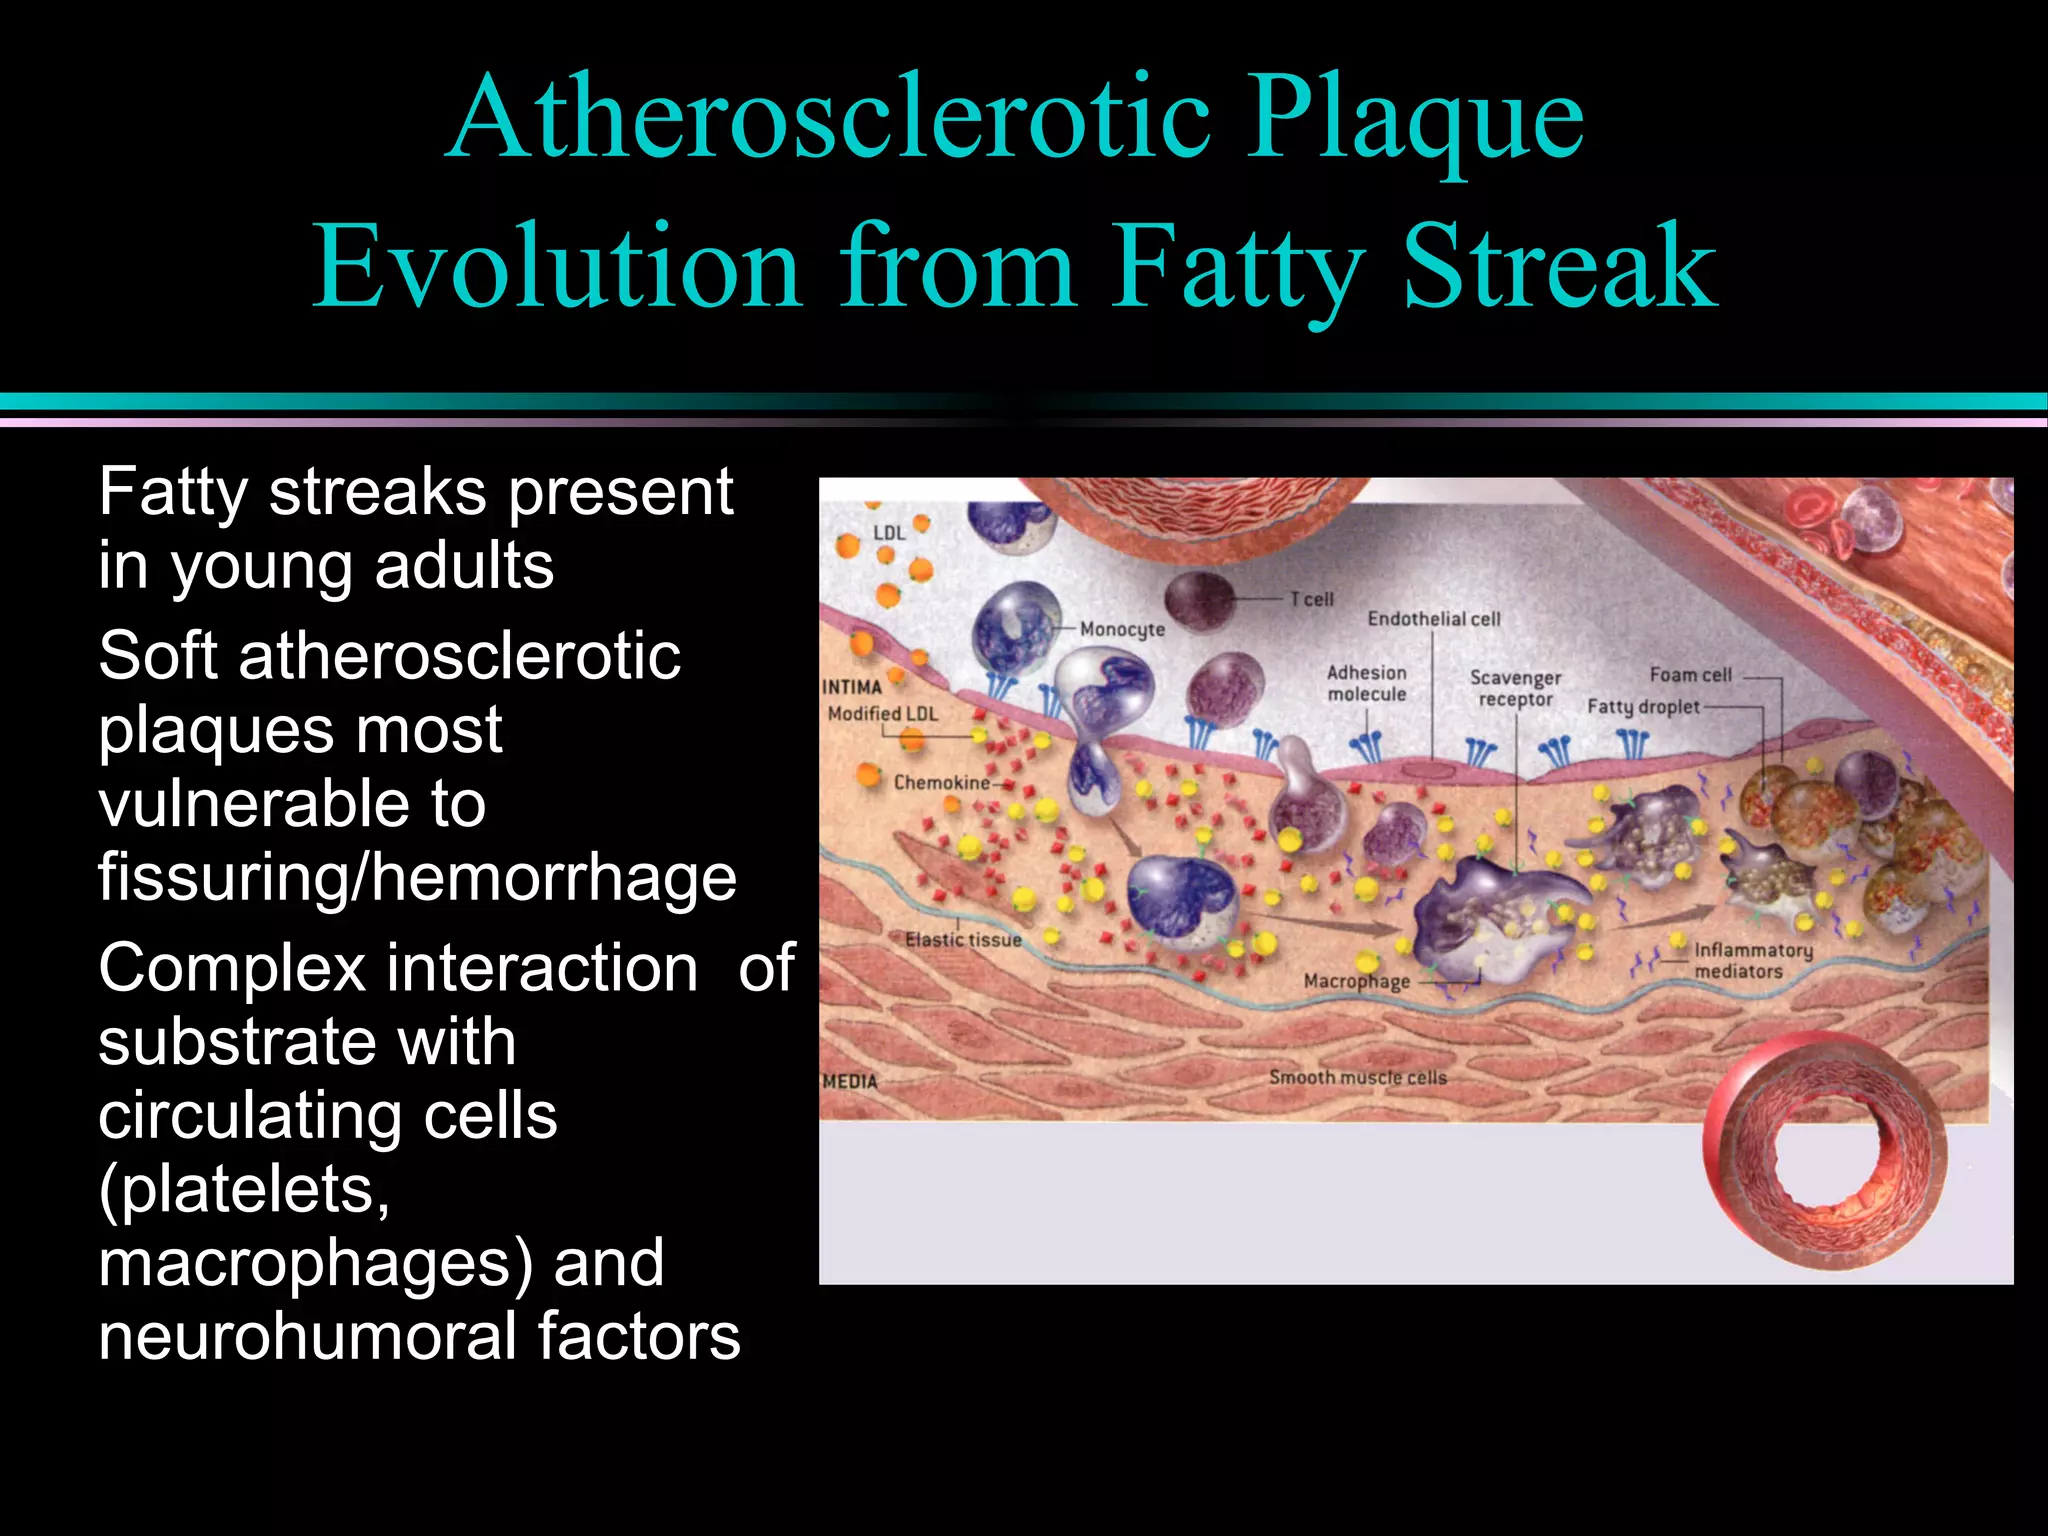
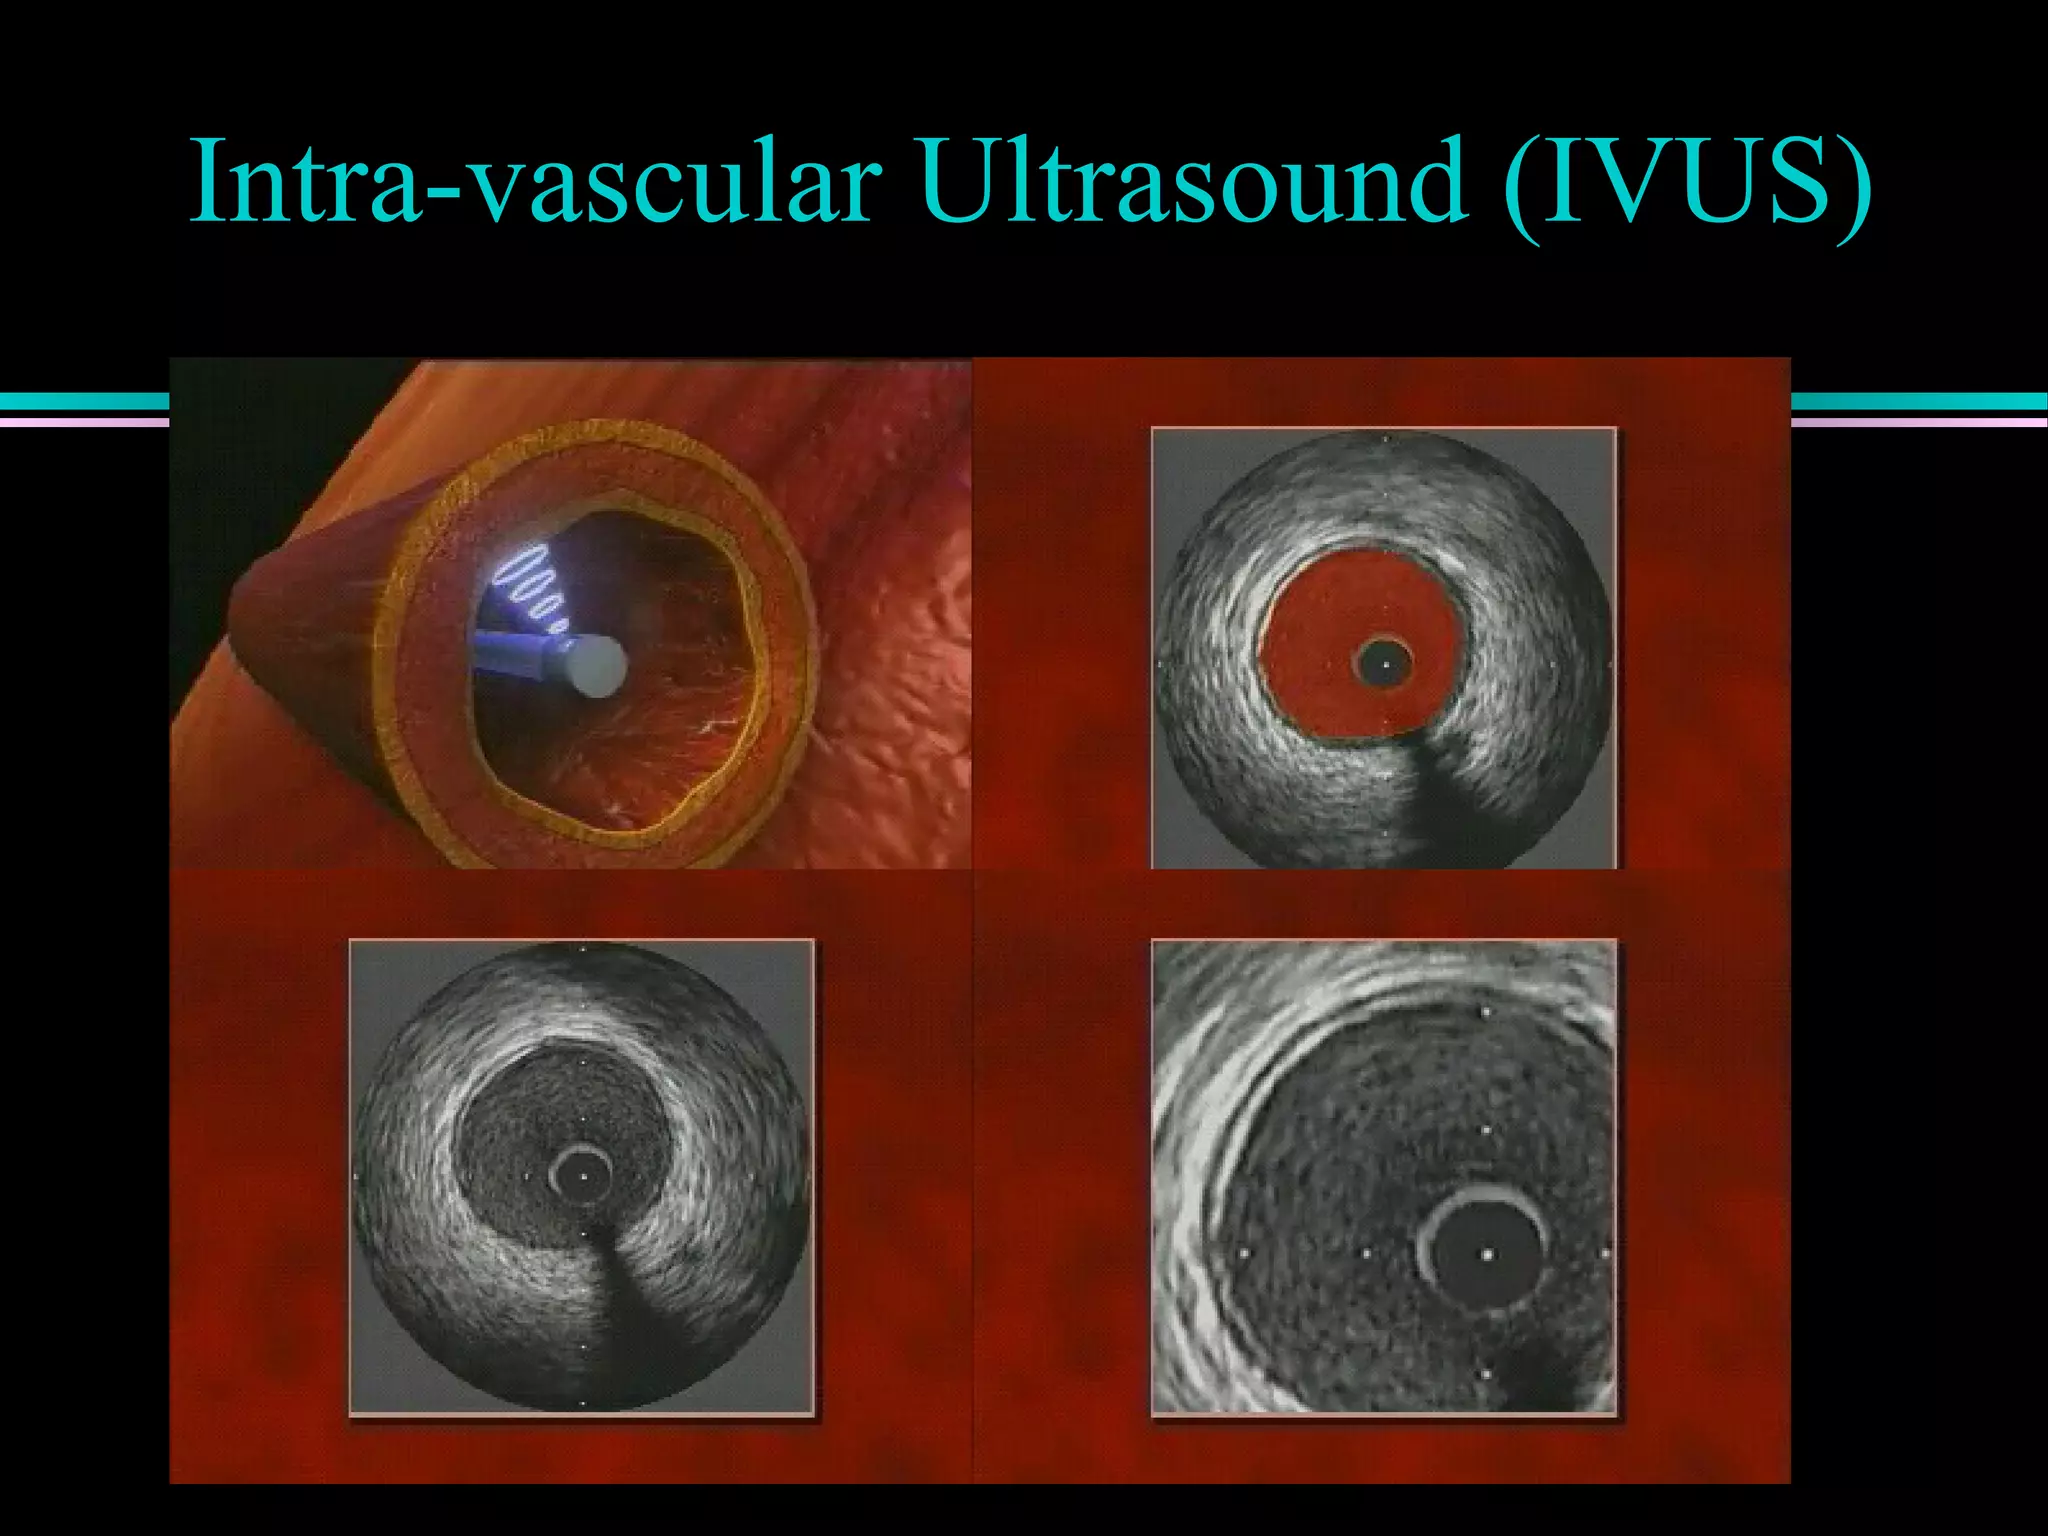
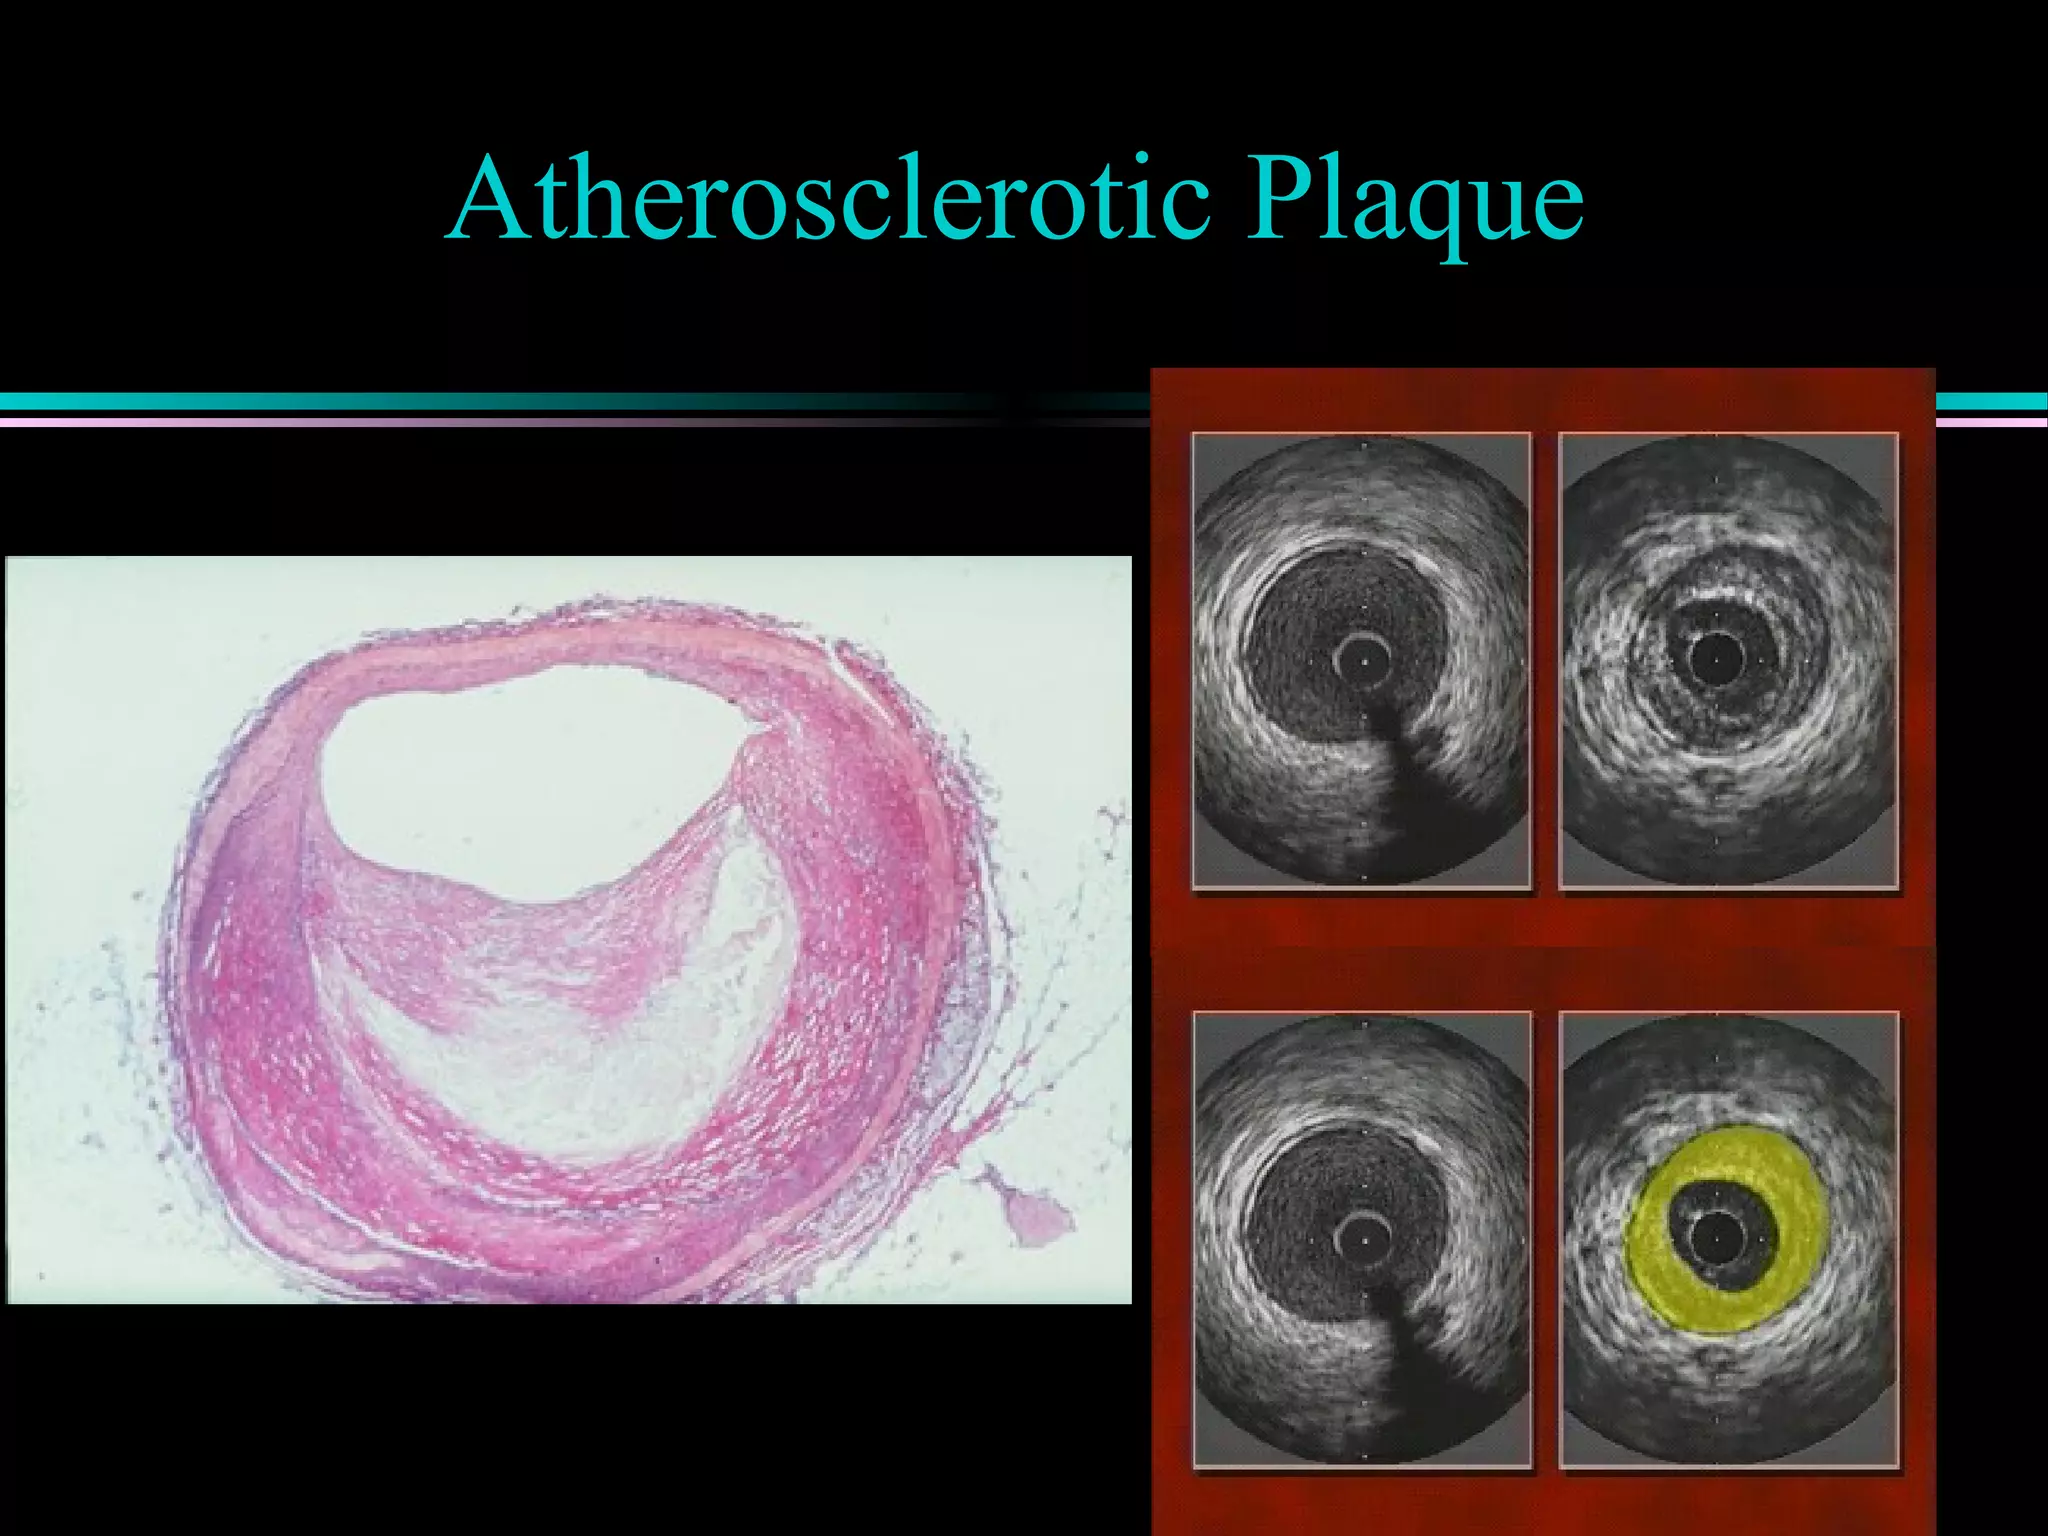
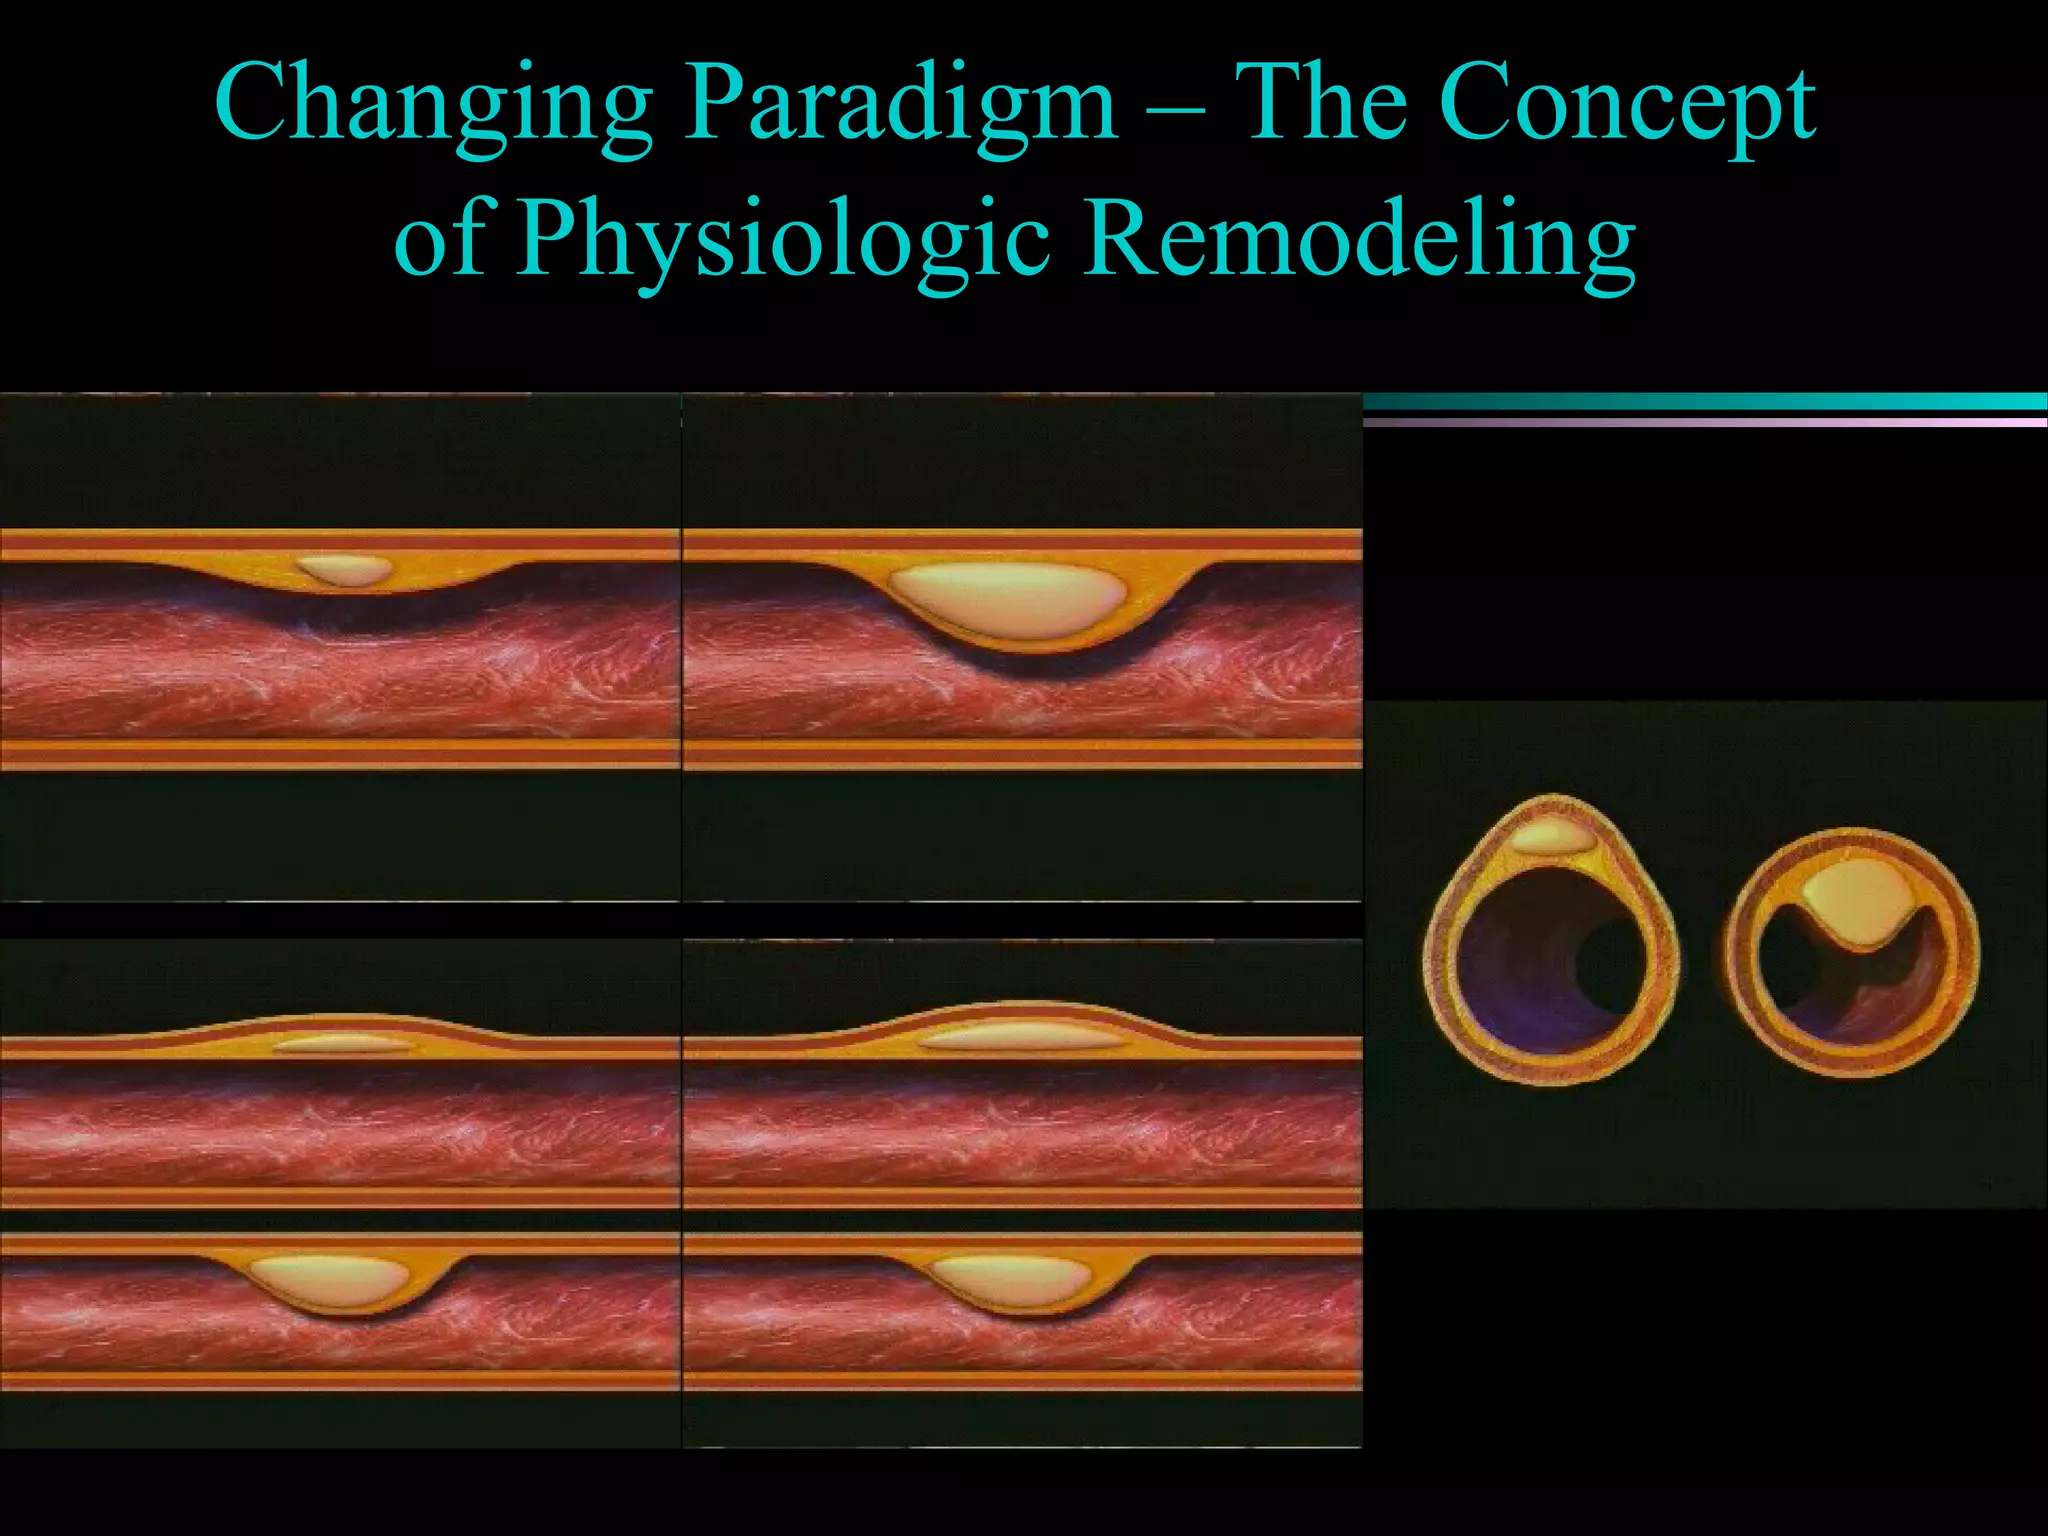
Discussion of atherosclerotic plaque evolution, its complications, and the role of intra-vascular ultrasound in coronary assessment.
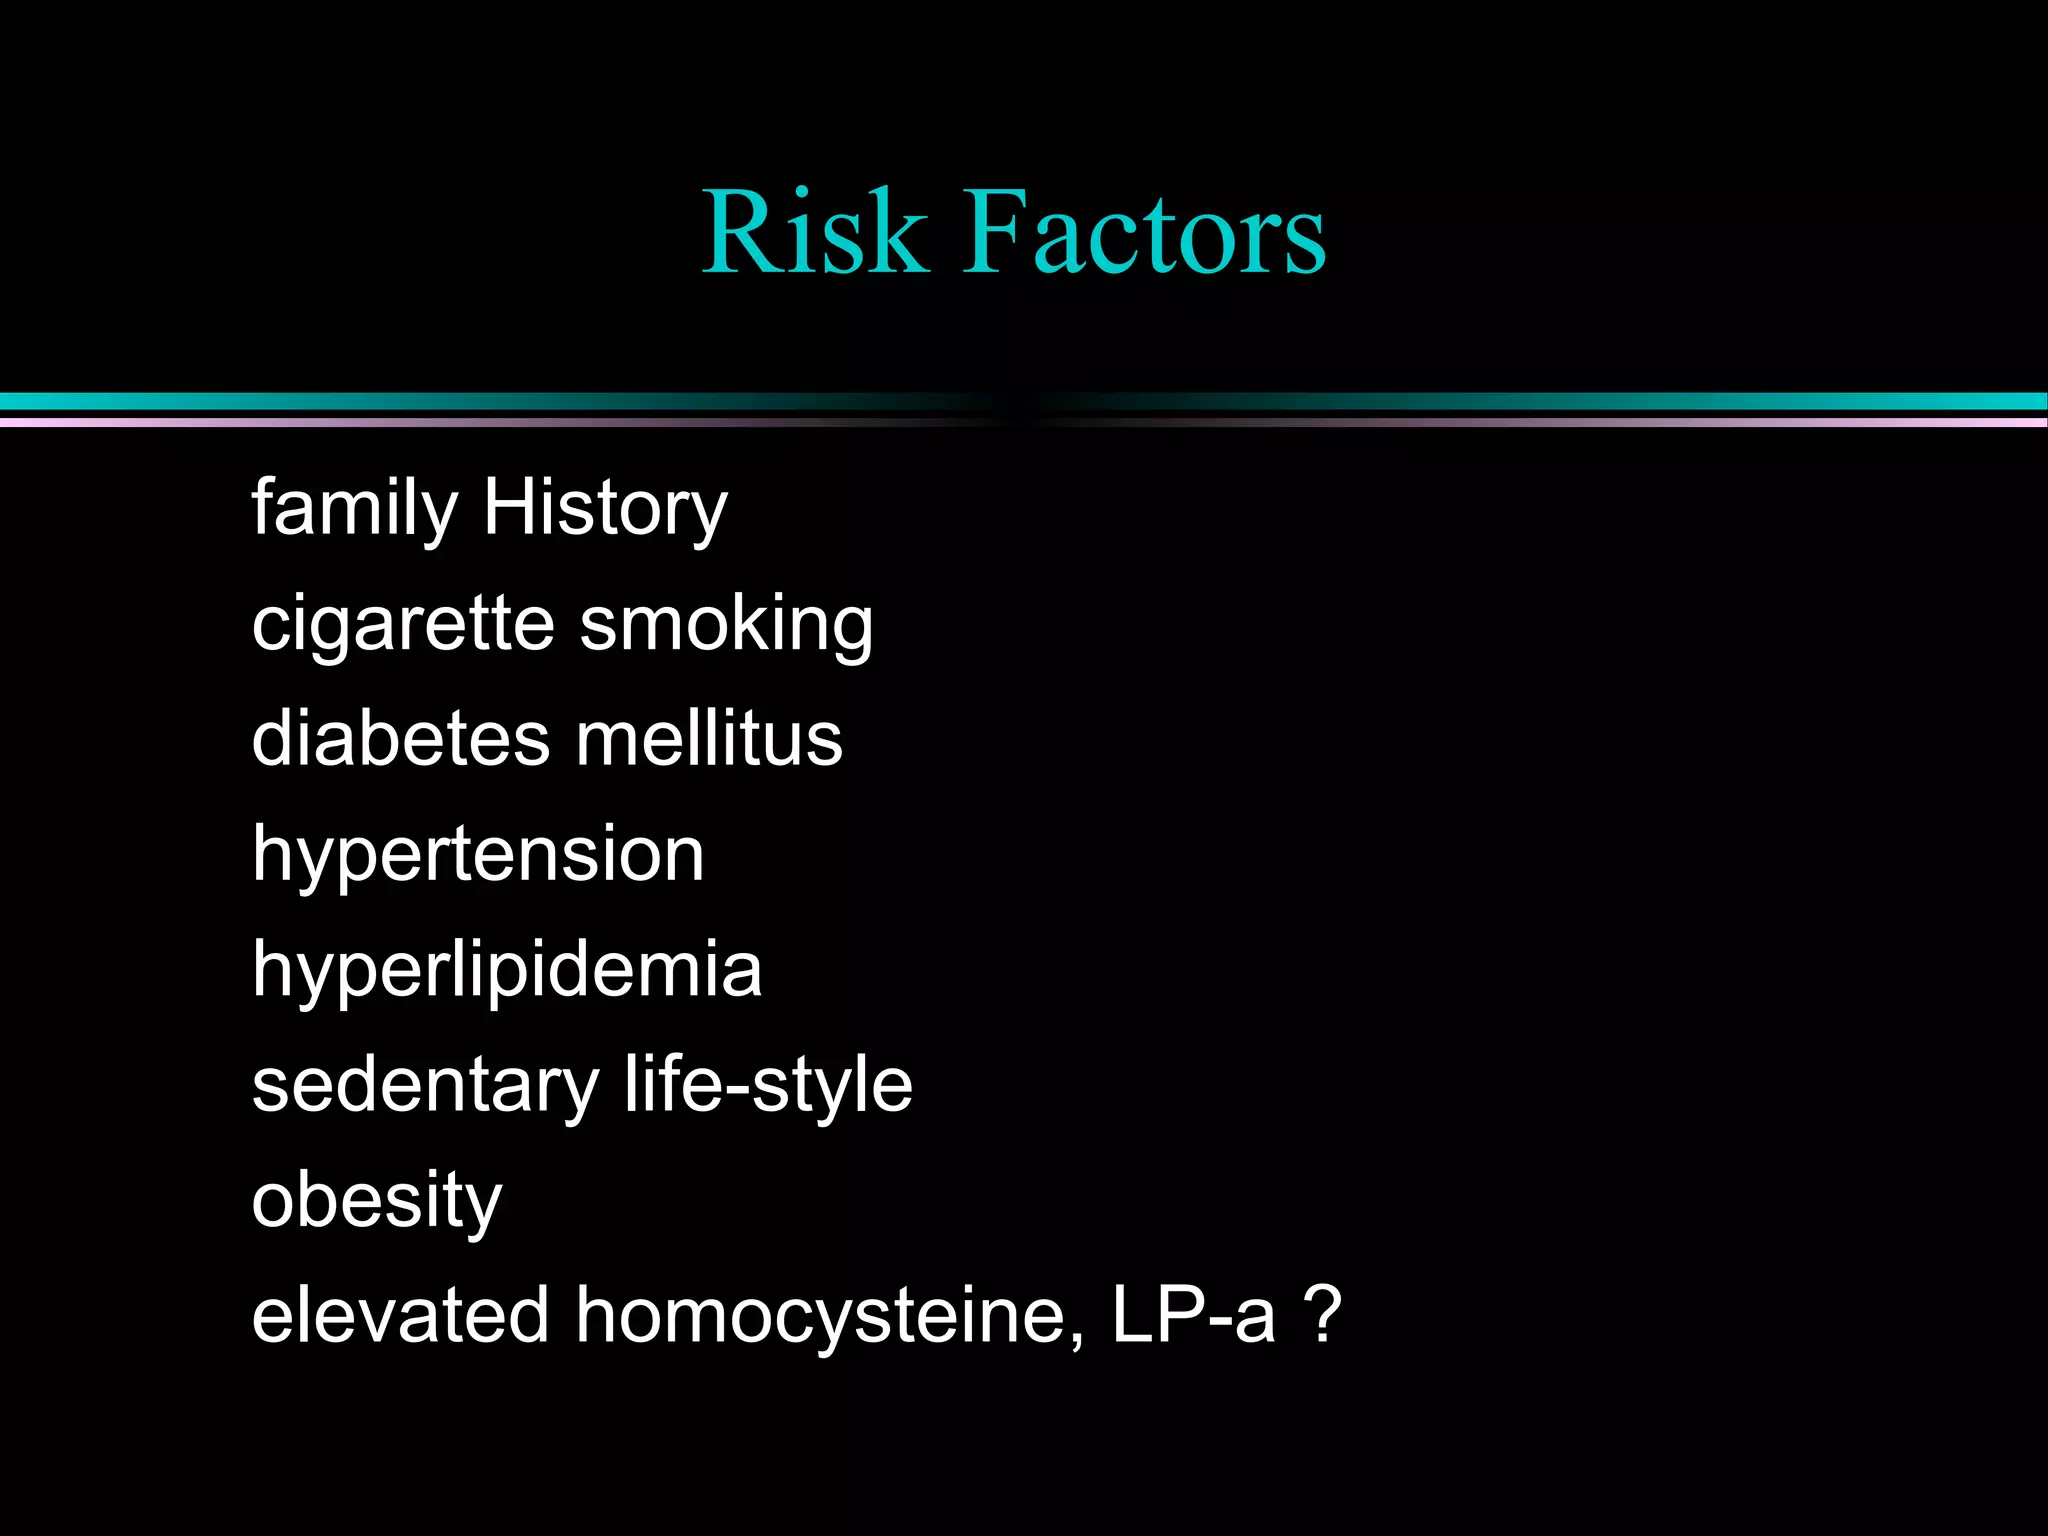
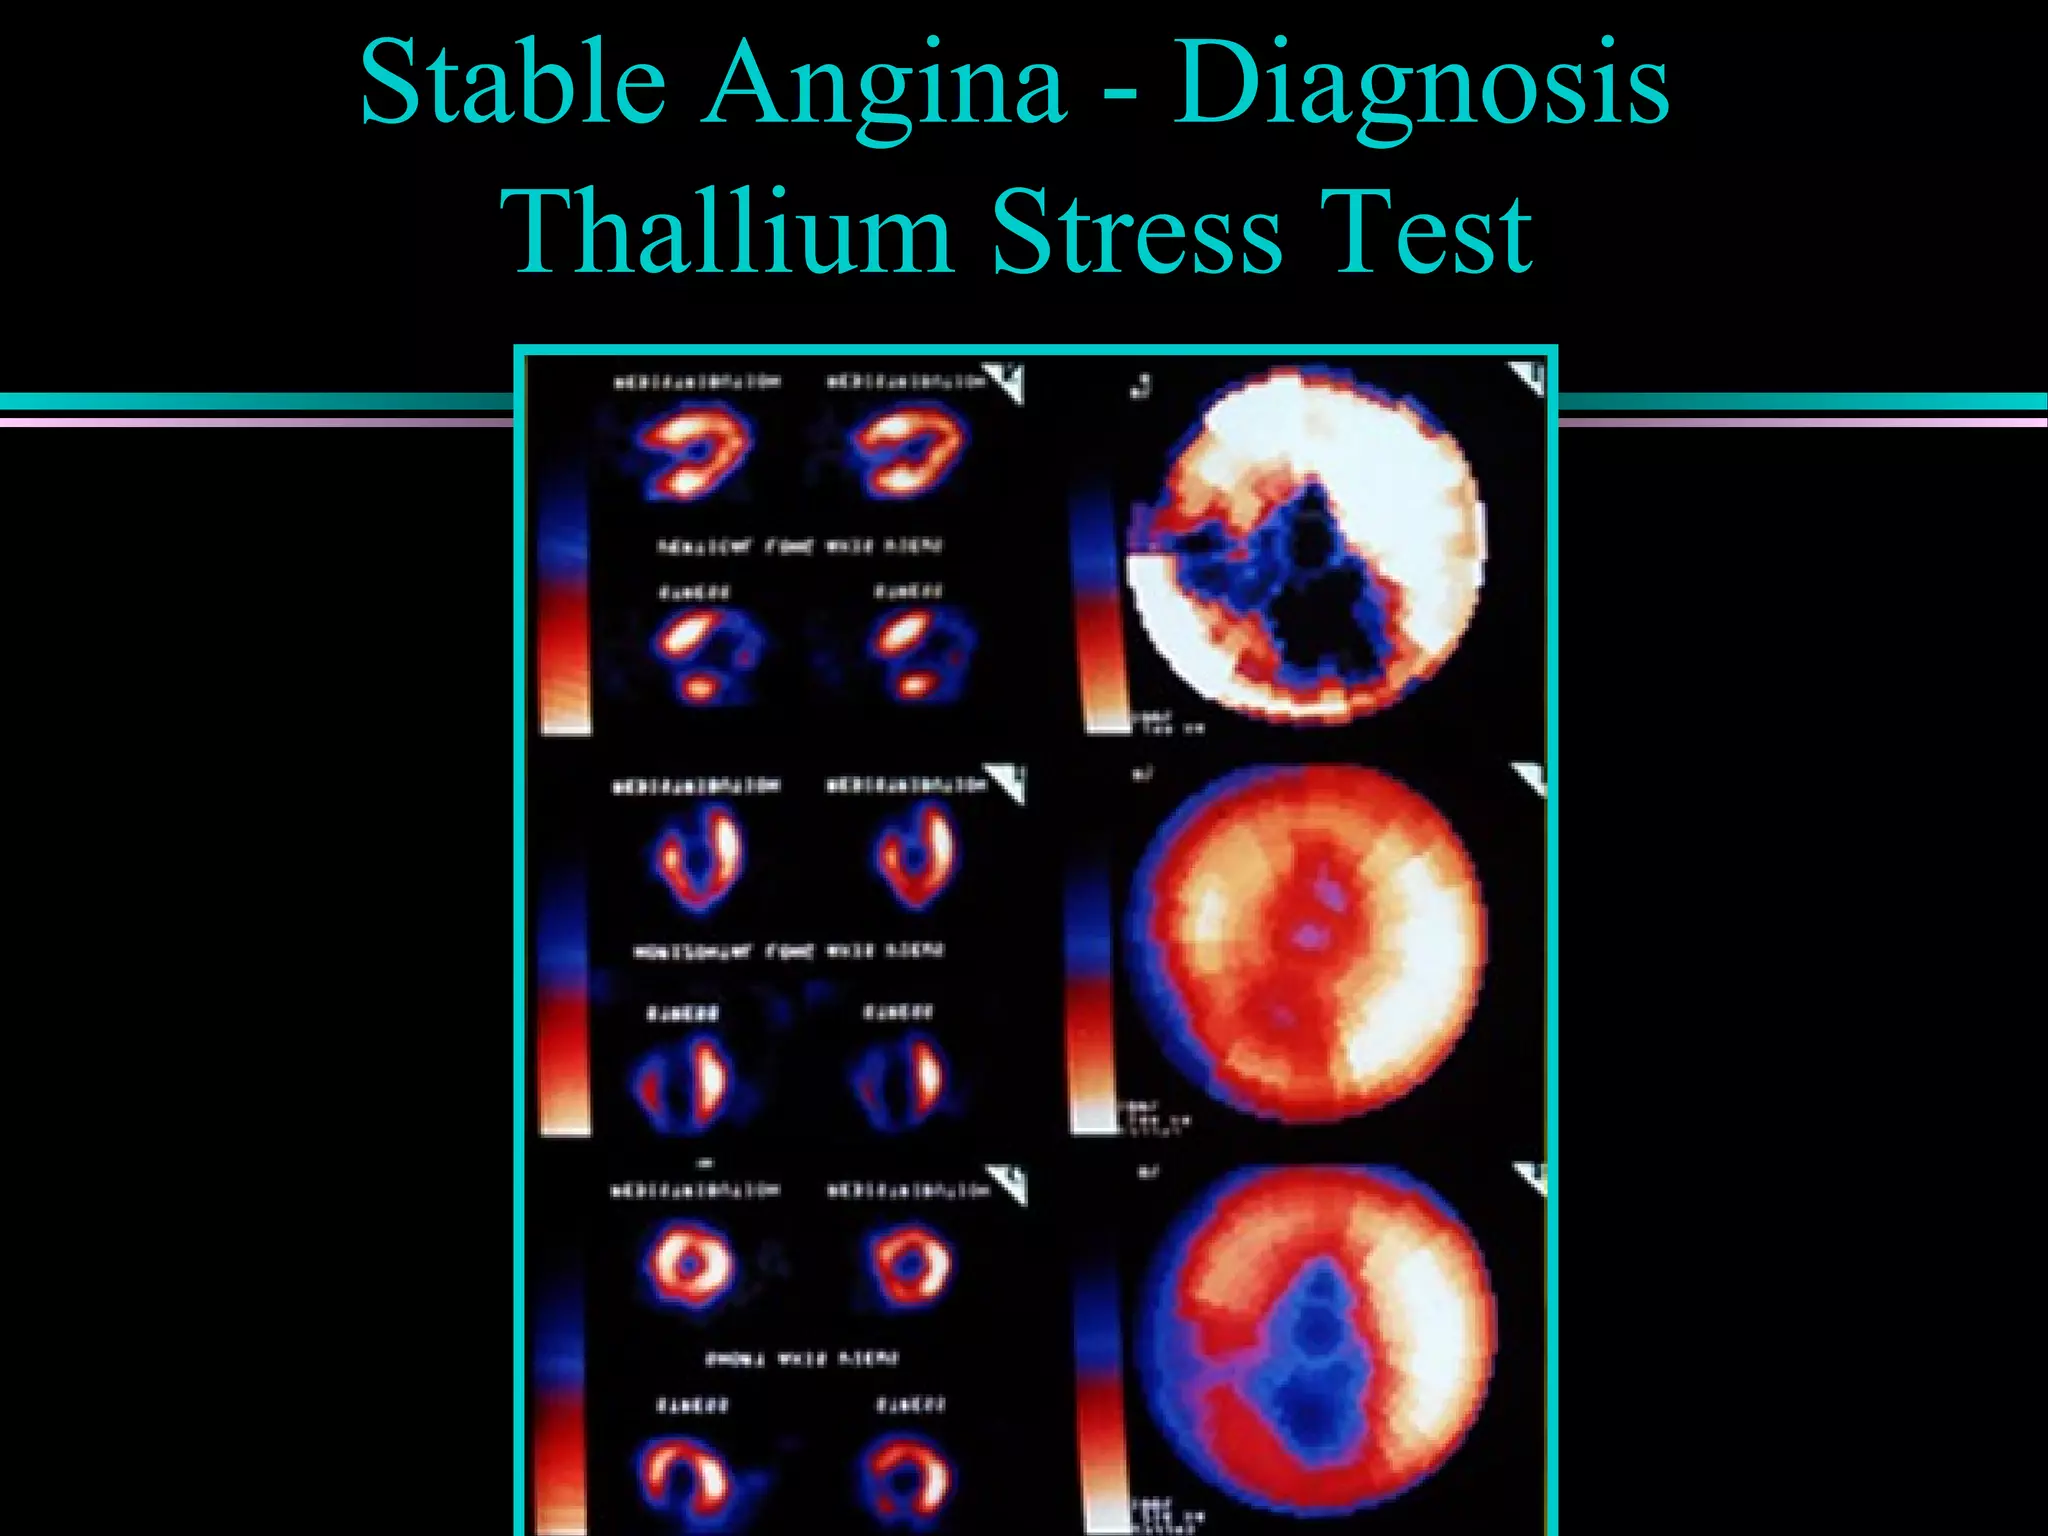
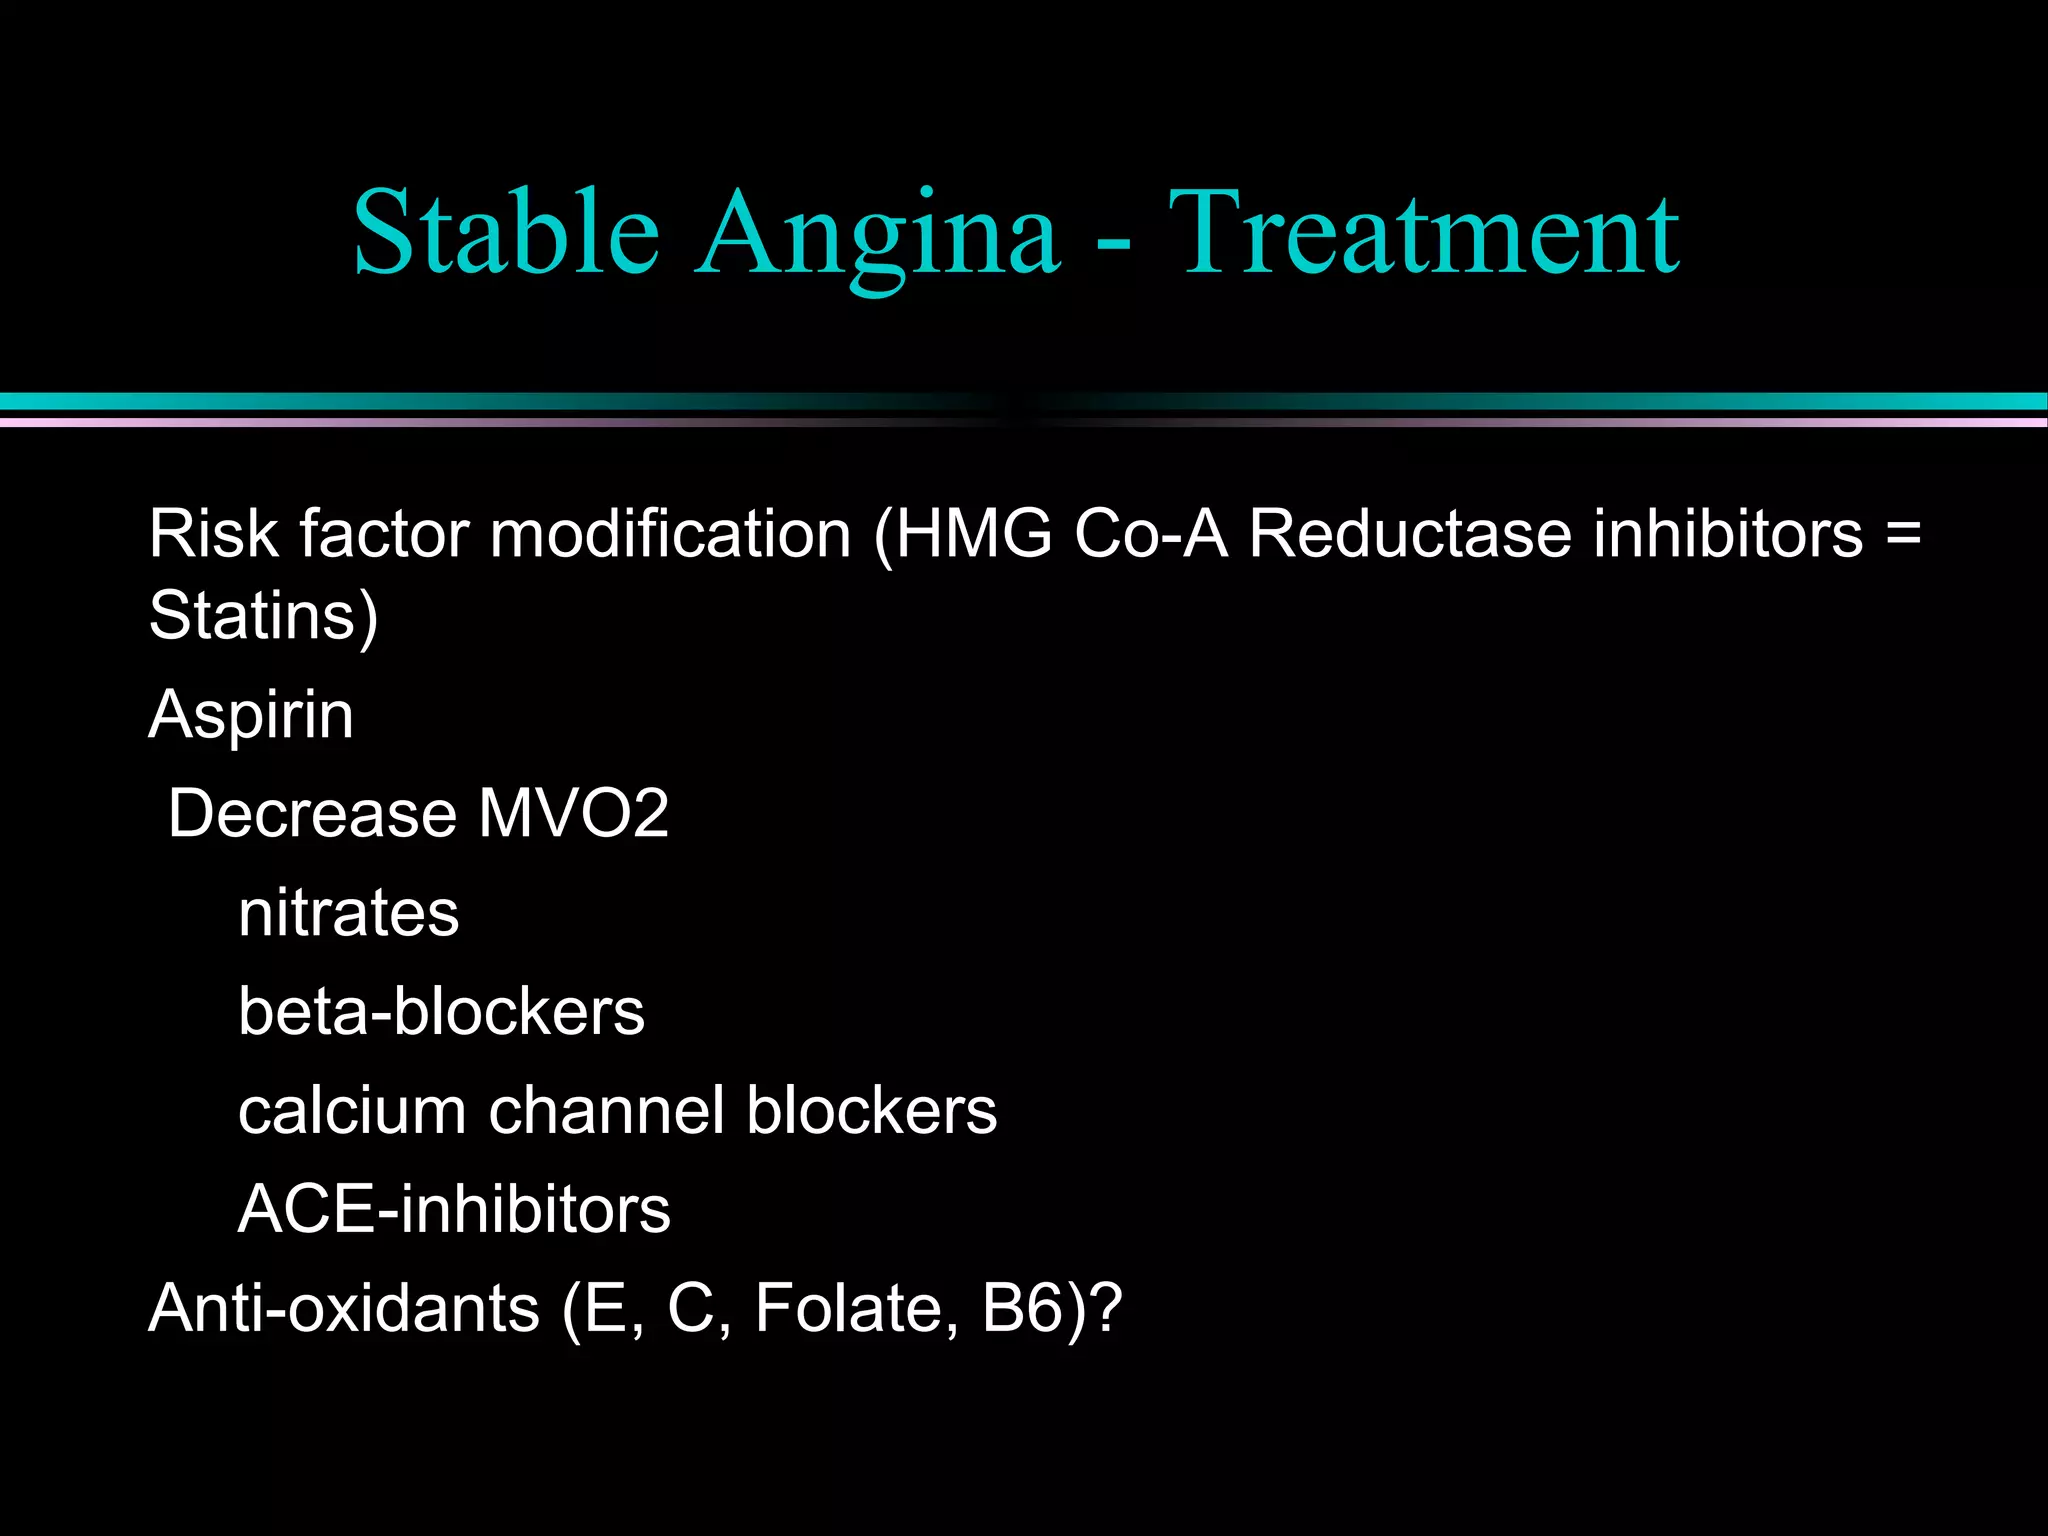
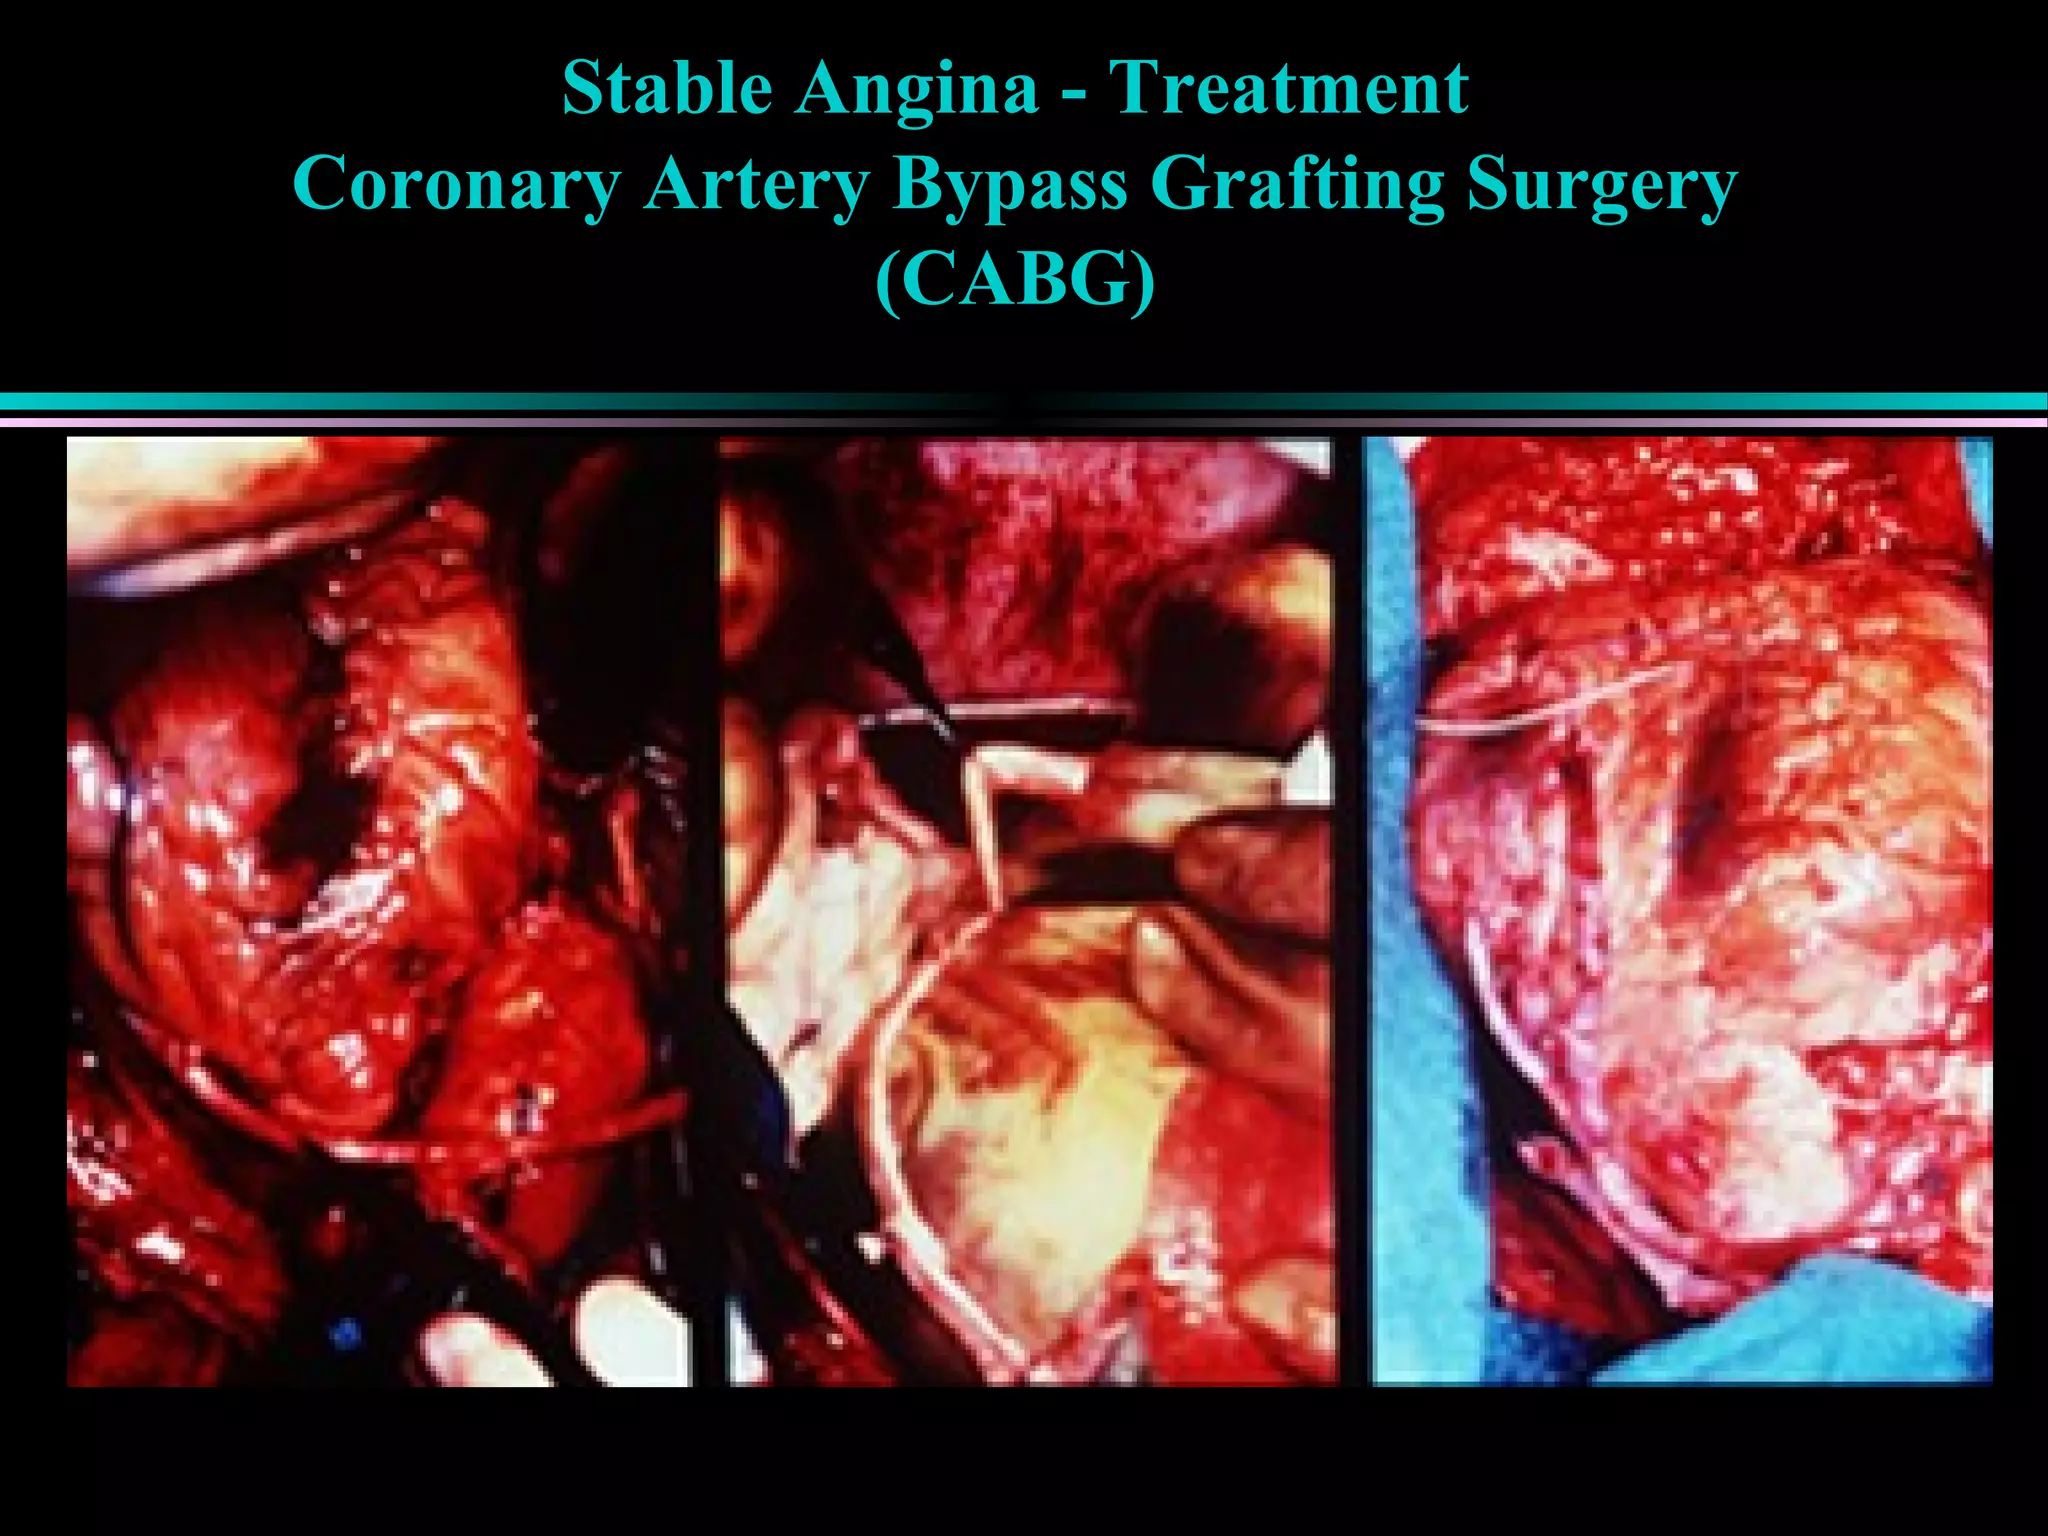
Symptoms of stable angina, diagnosis using stress tests, and treatments focusing on risk factor modification and mechanical interventions.
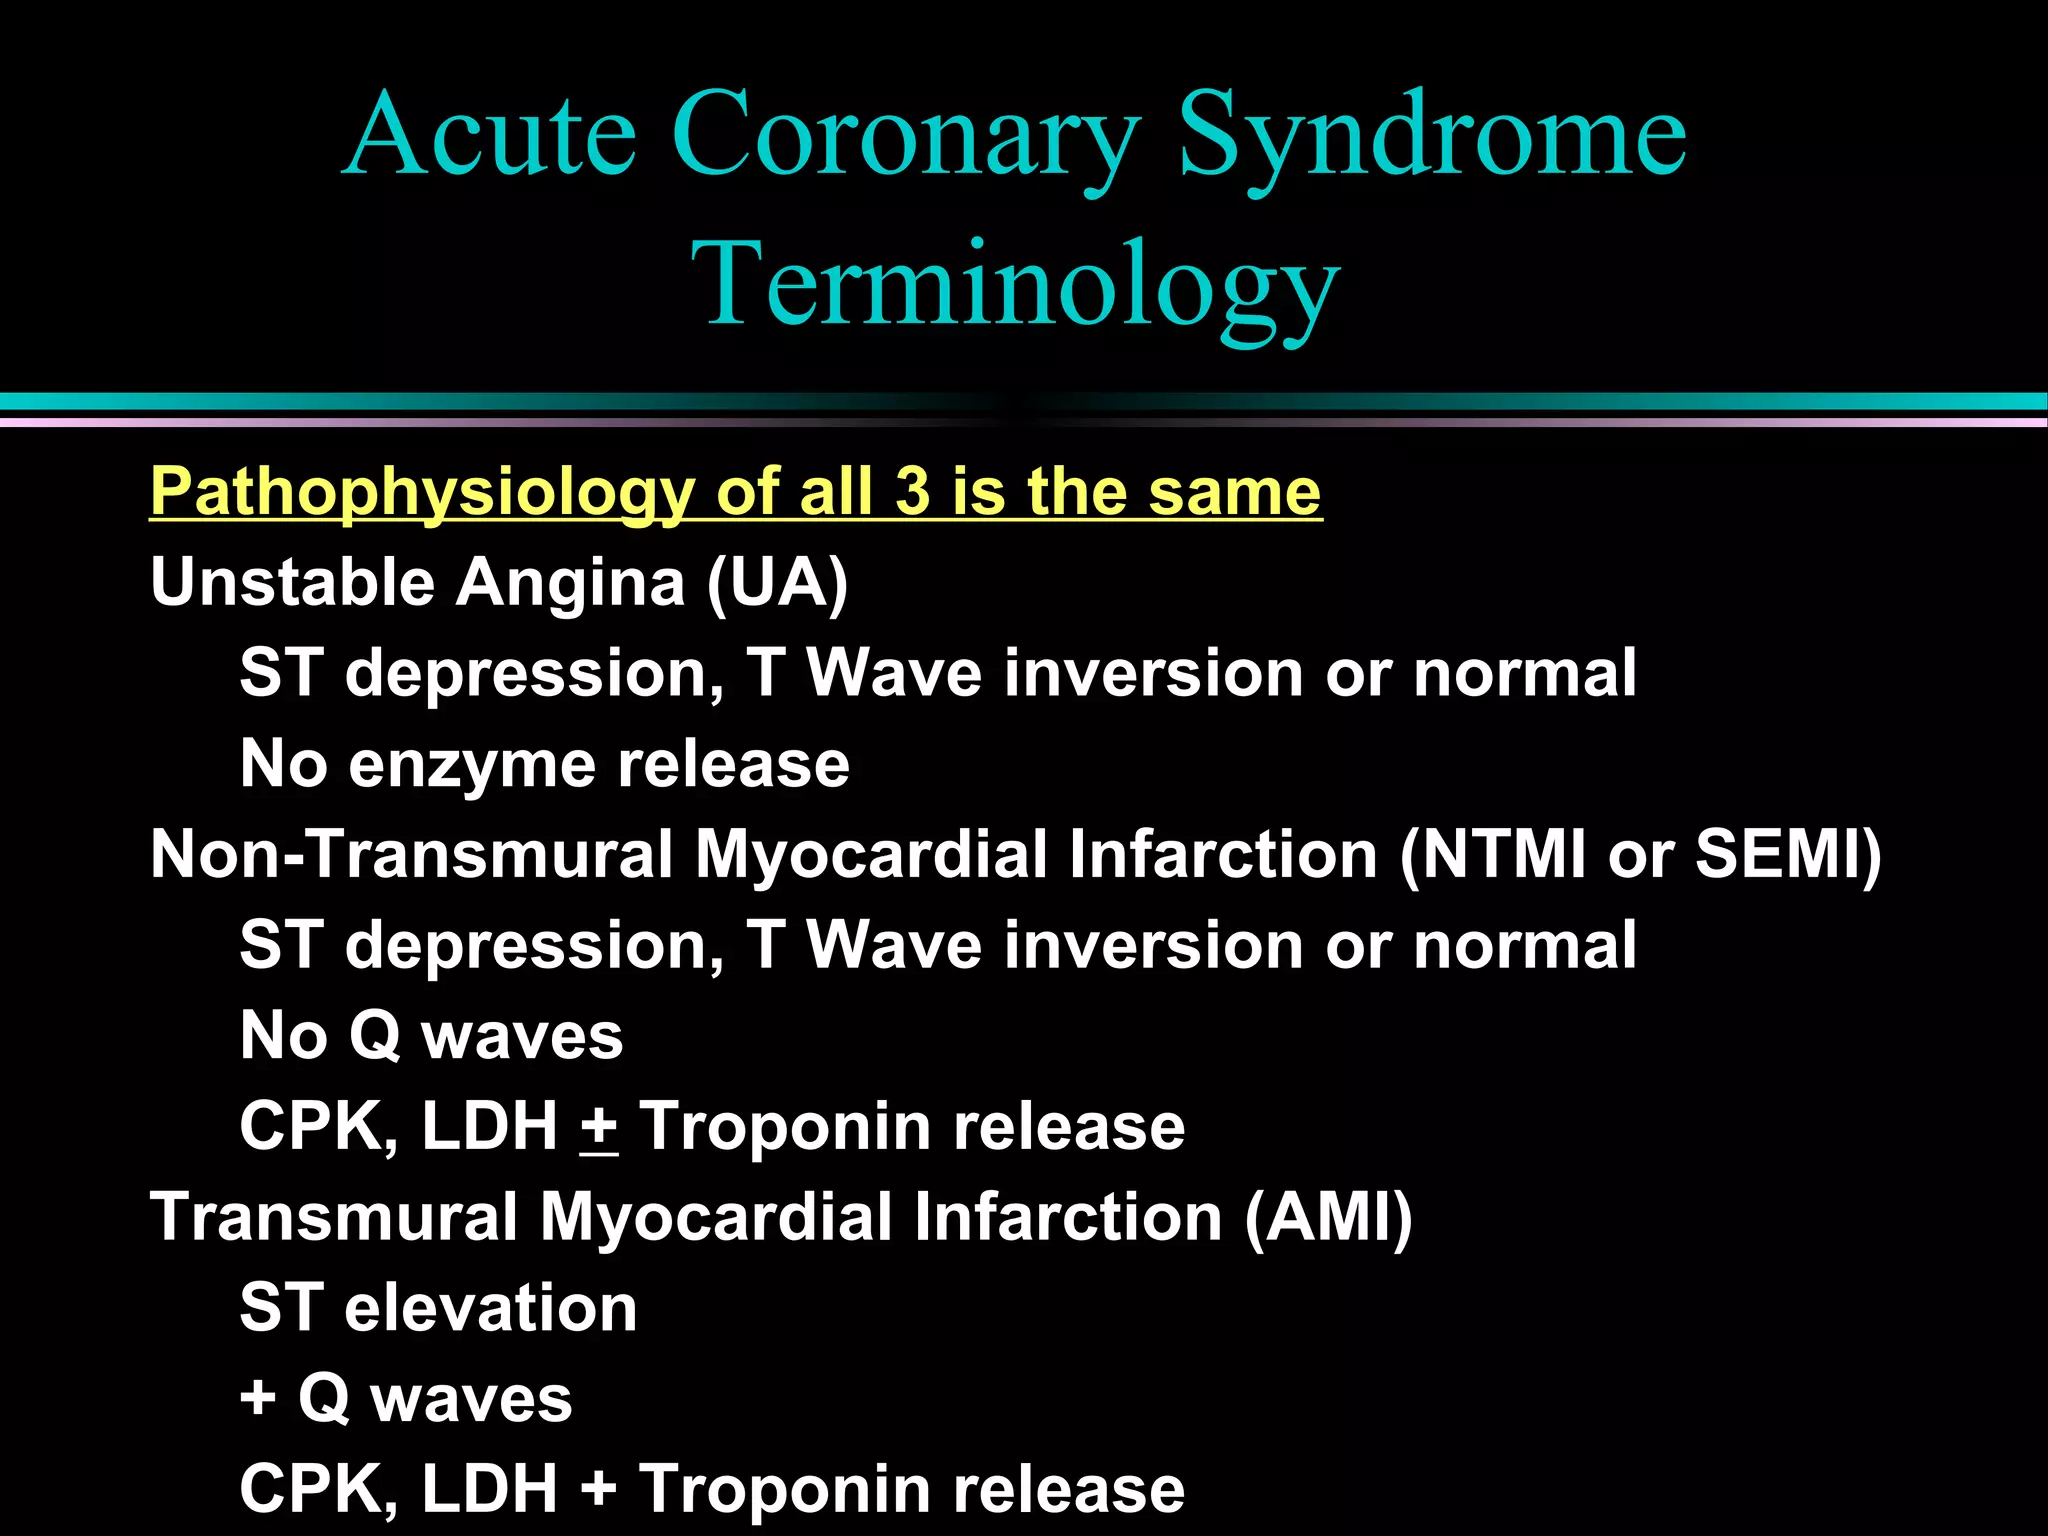
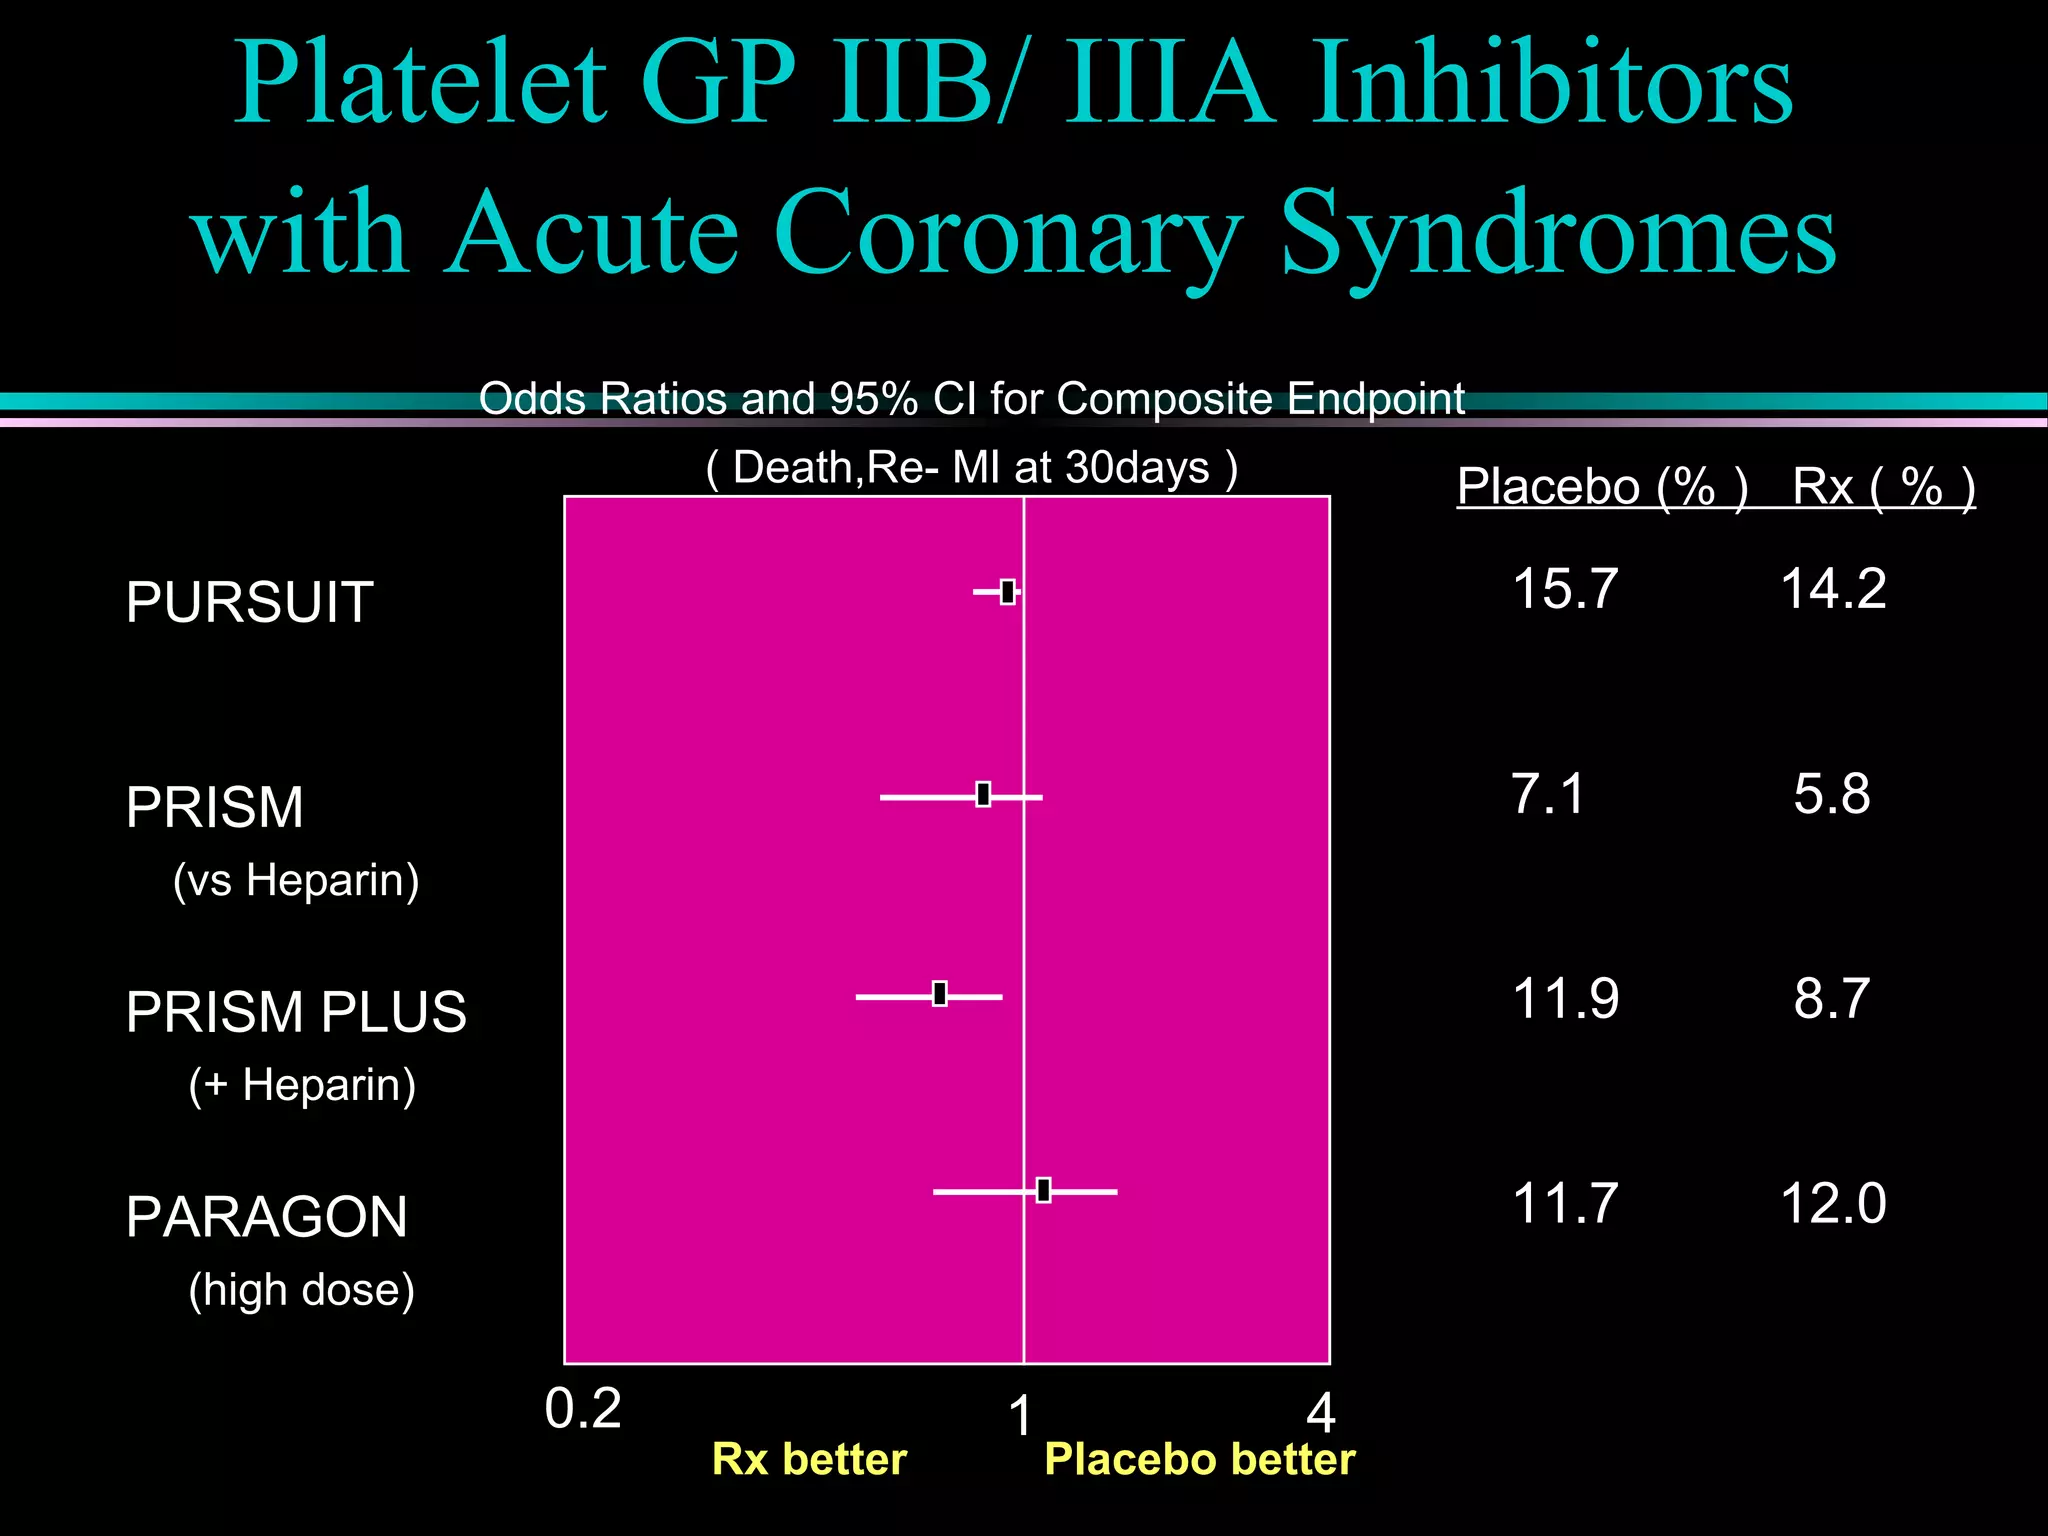
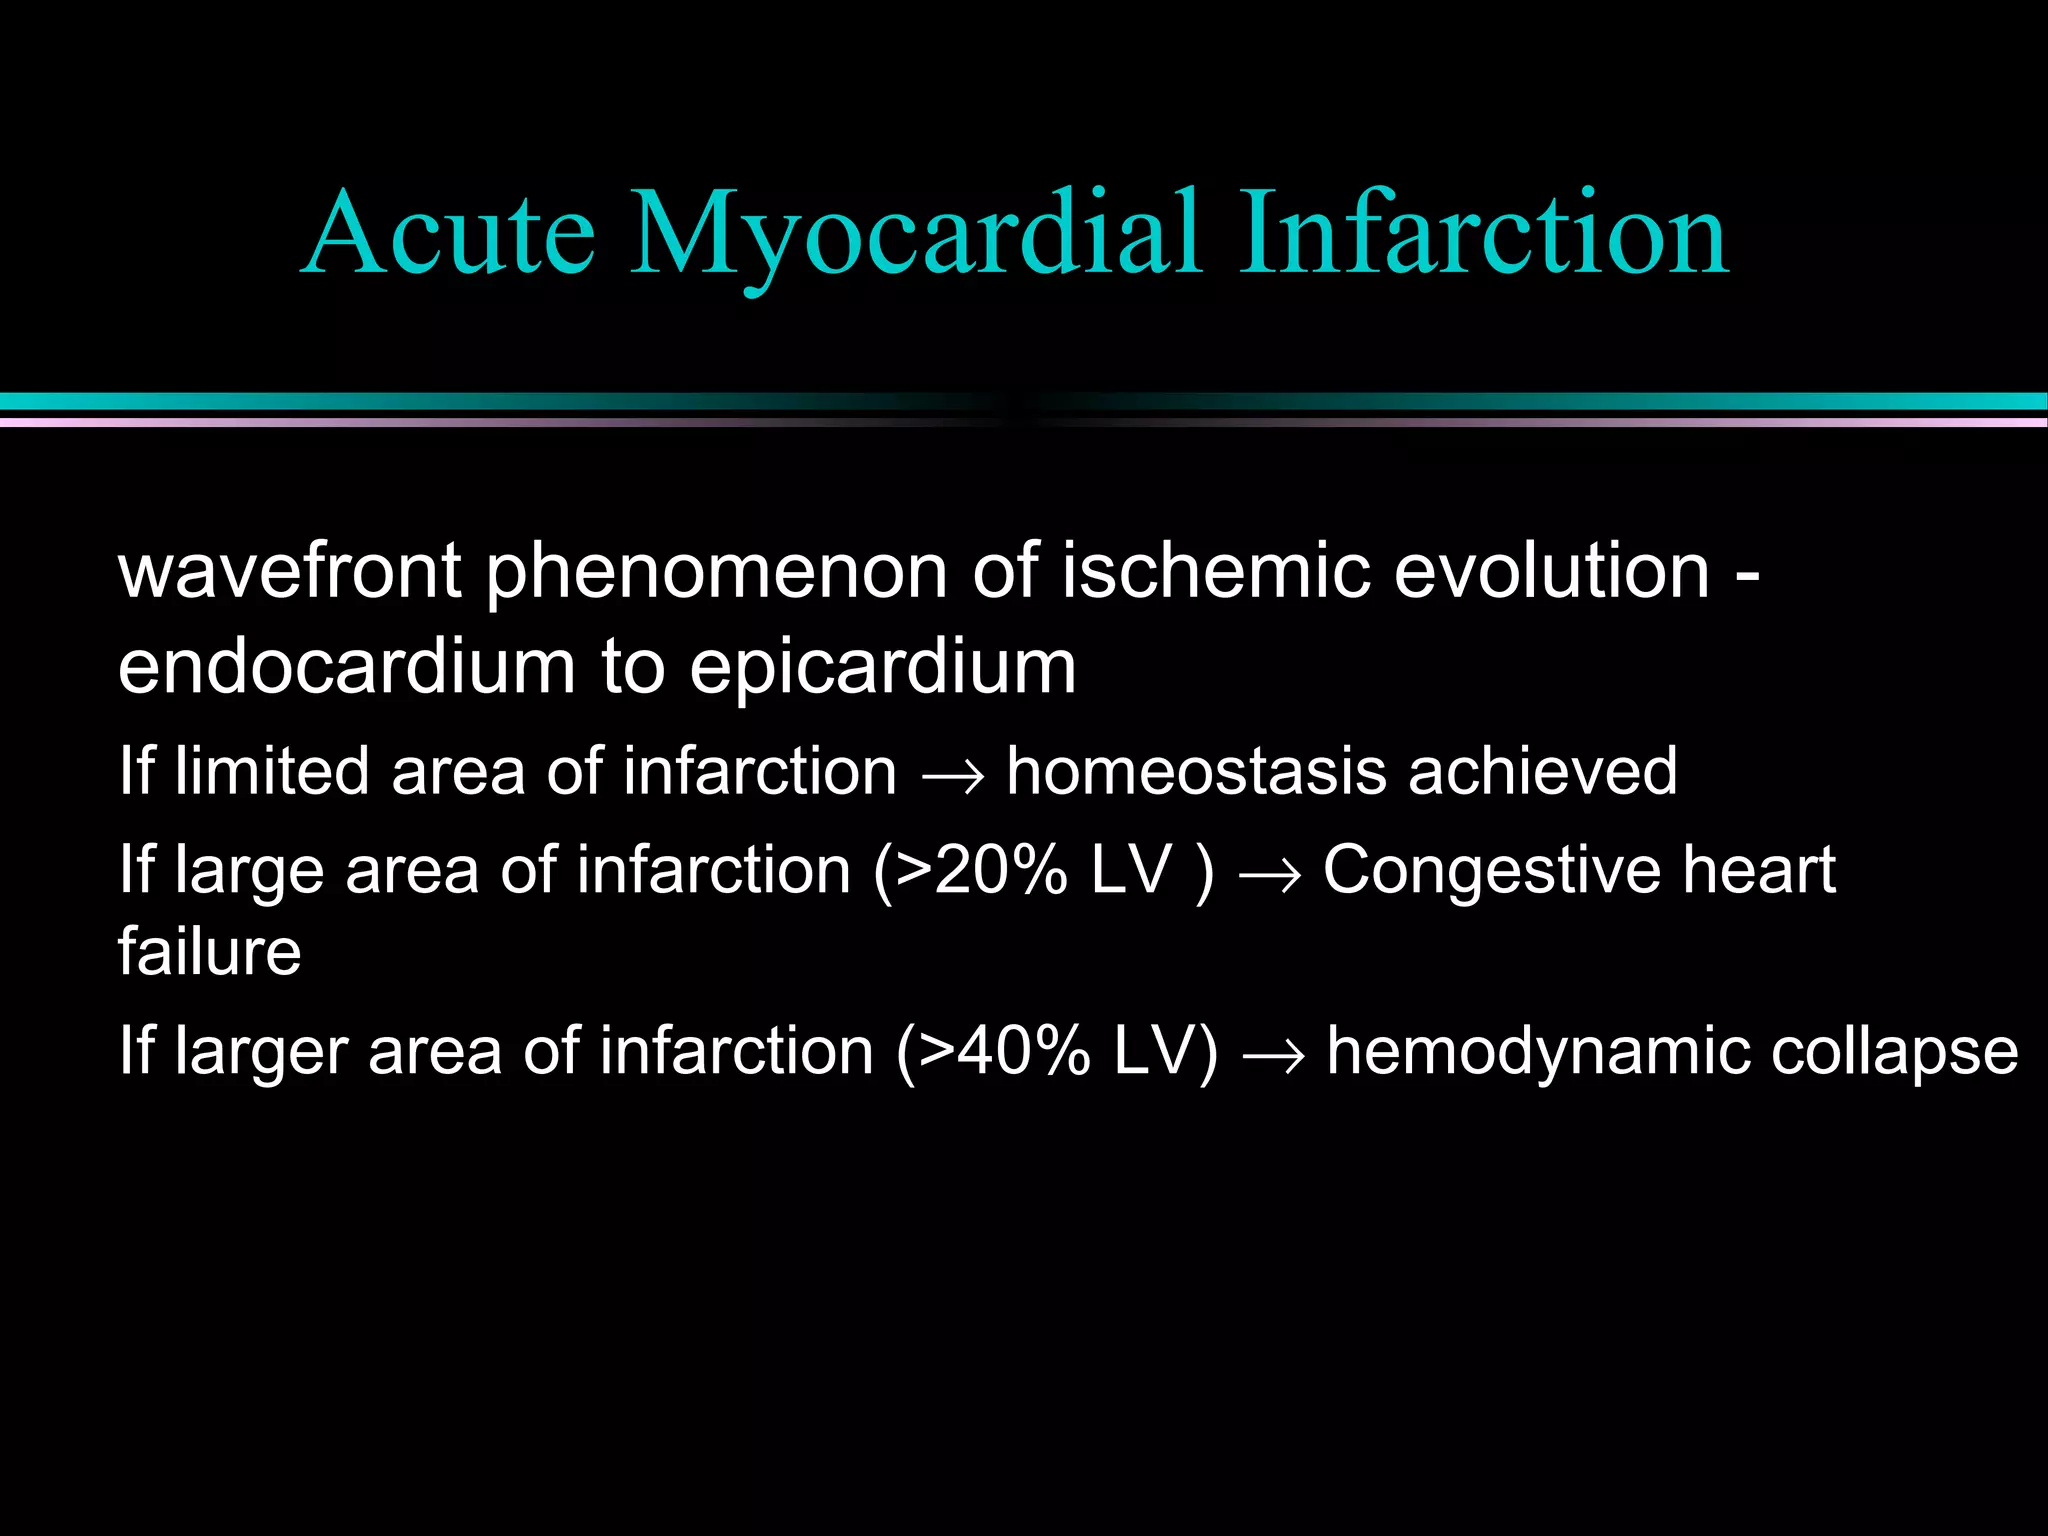
Pathophysiology of types of acute coronary syndrome like unstable angina and myocardial infarction, including treatment approaches.
Overview of cardiac enzymes and troponin as key biomarkers in diagnosing myocardial infarction and ischemia.
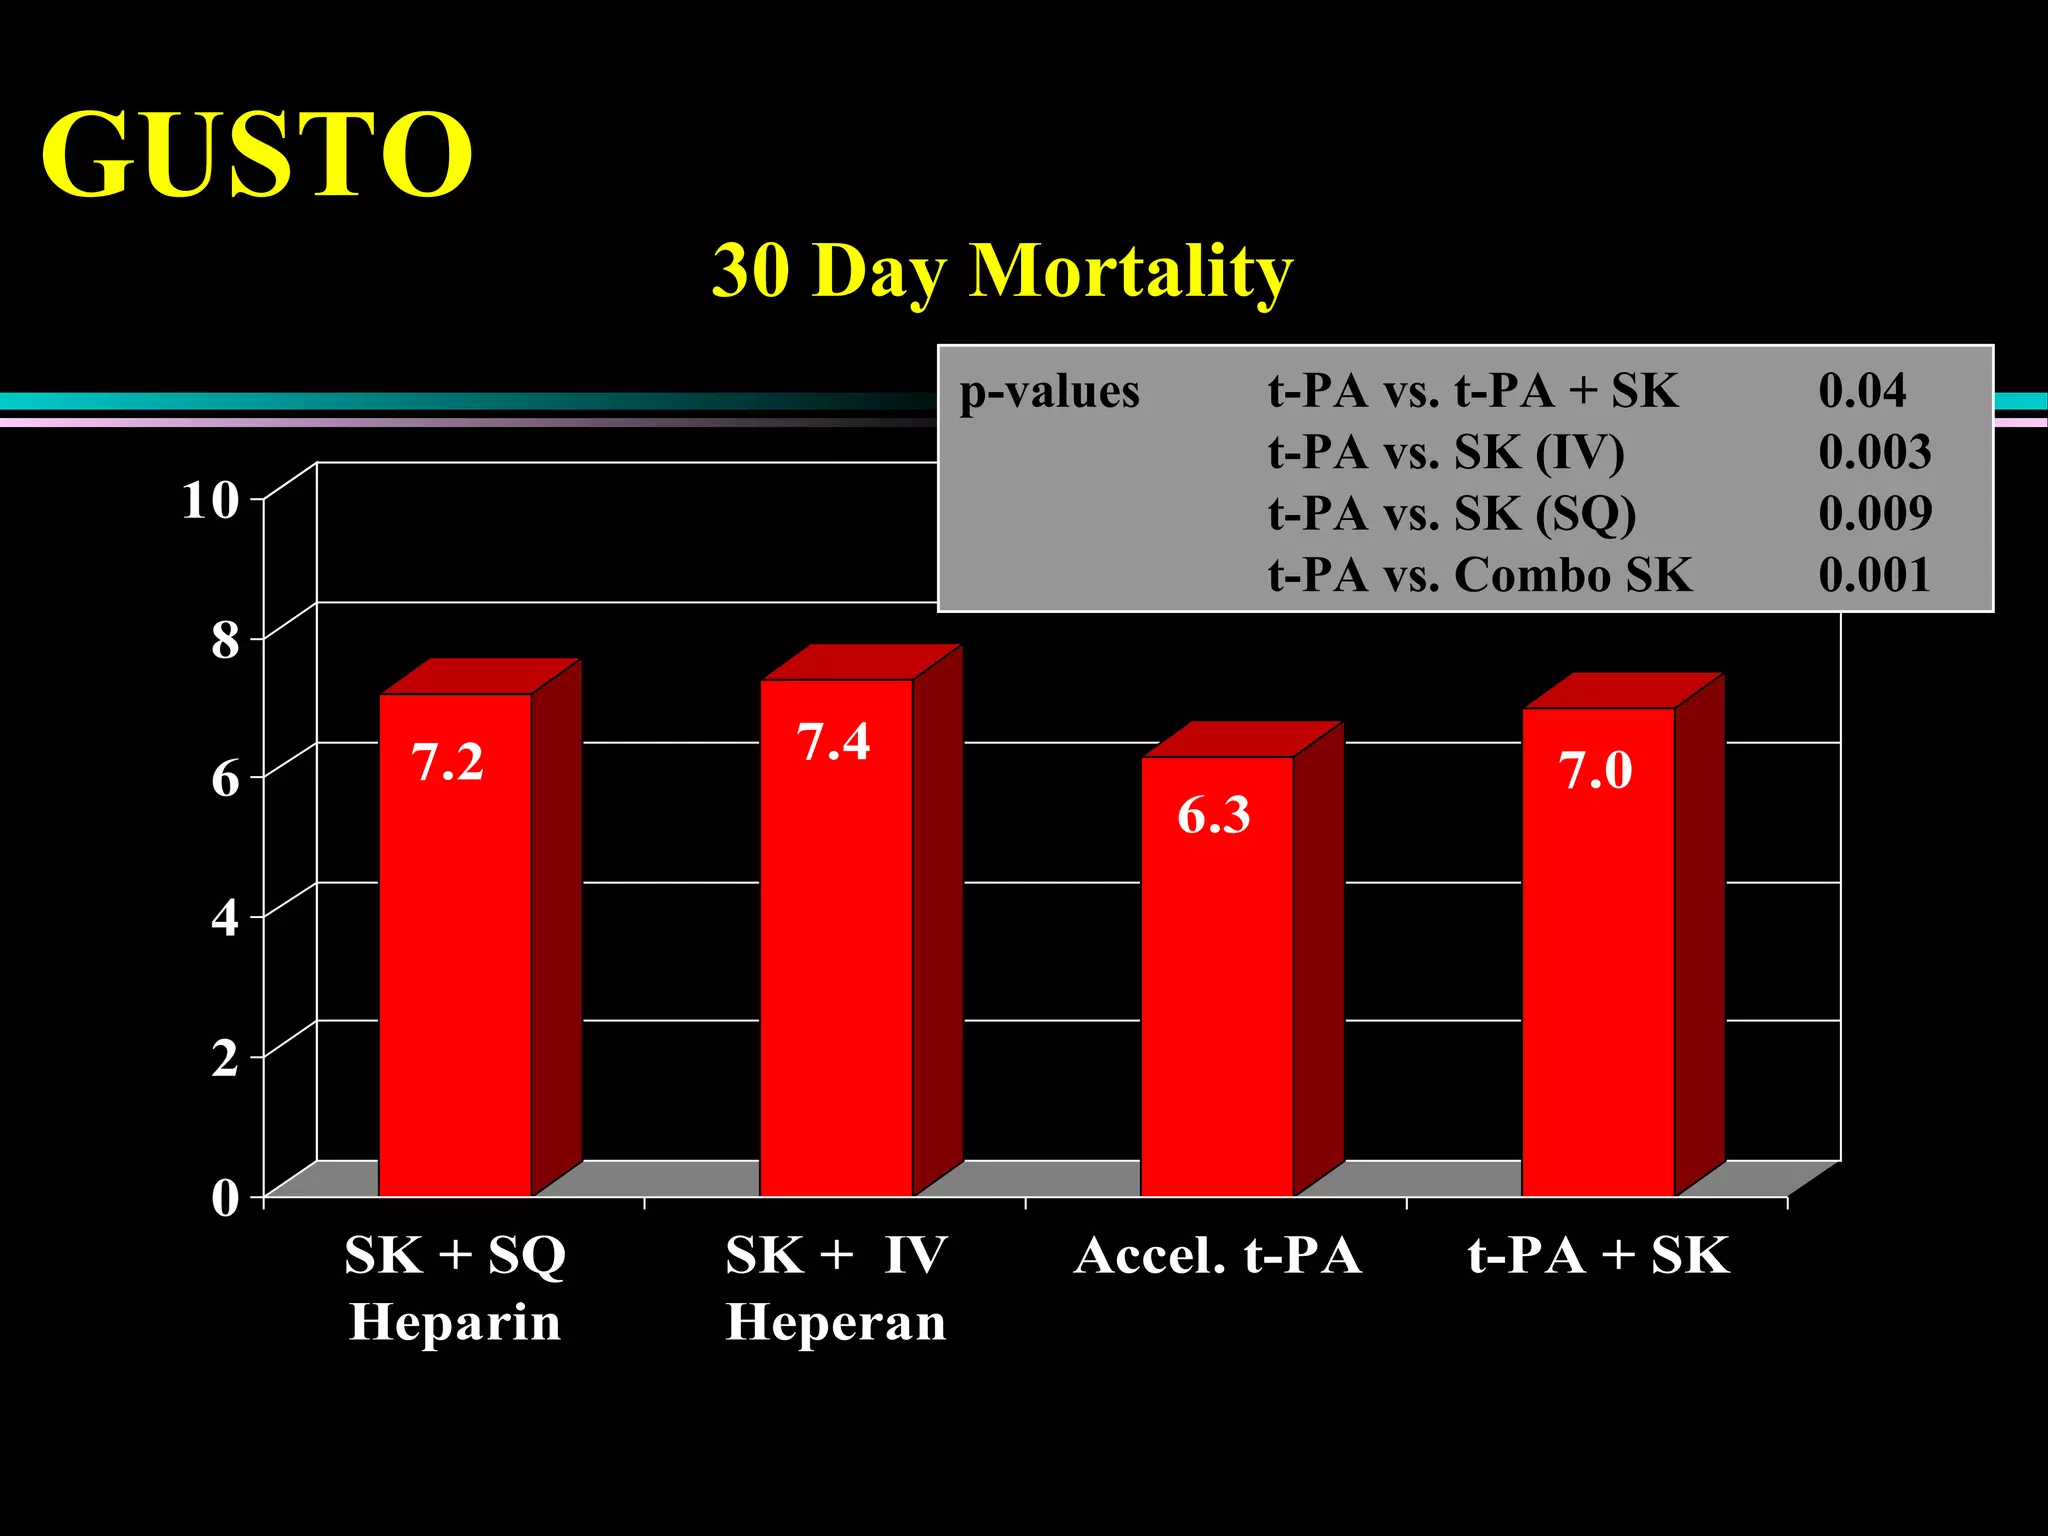
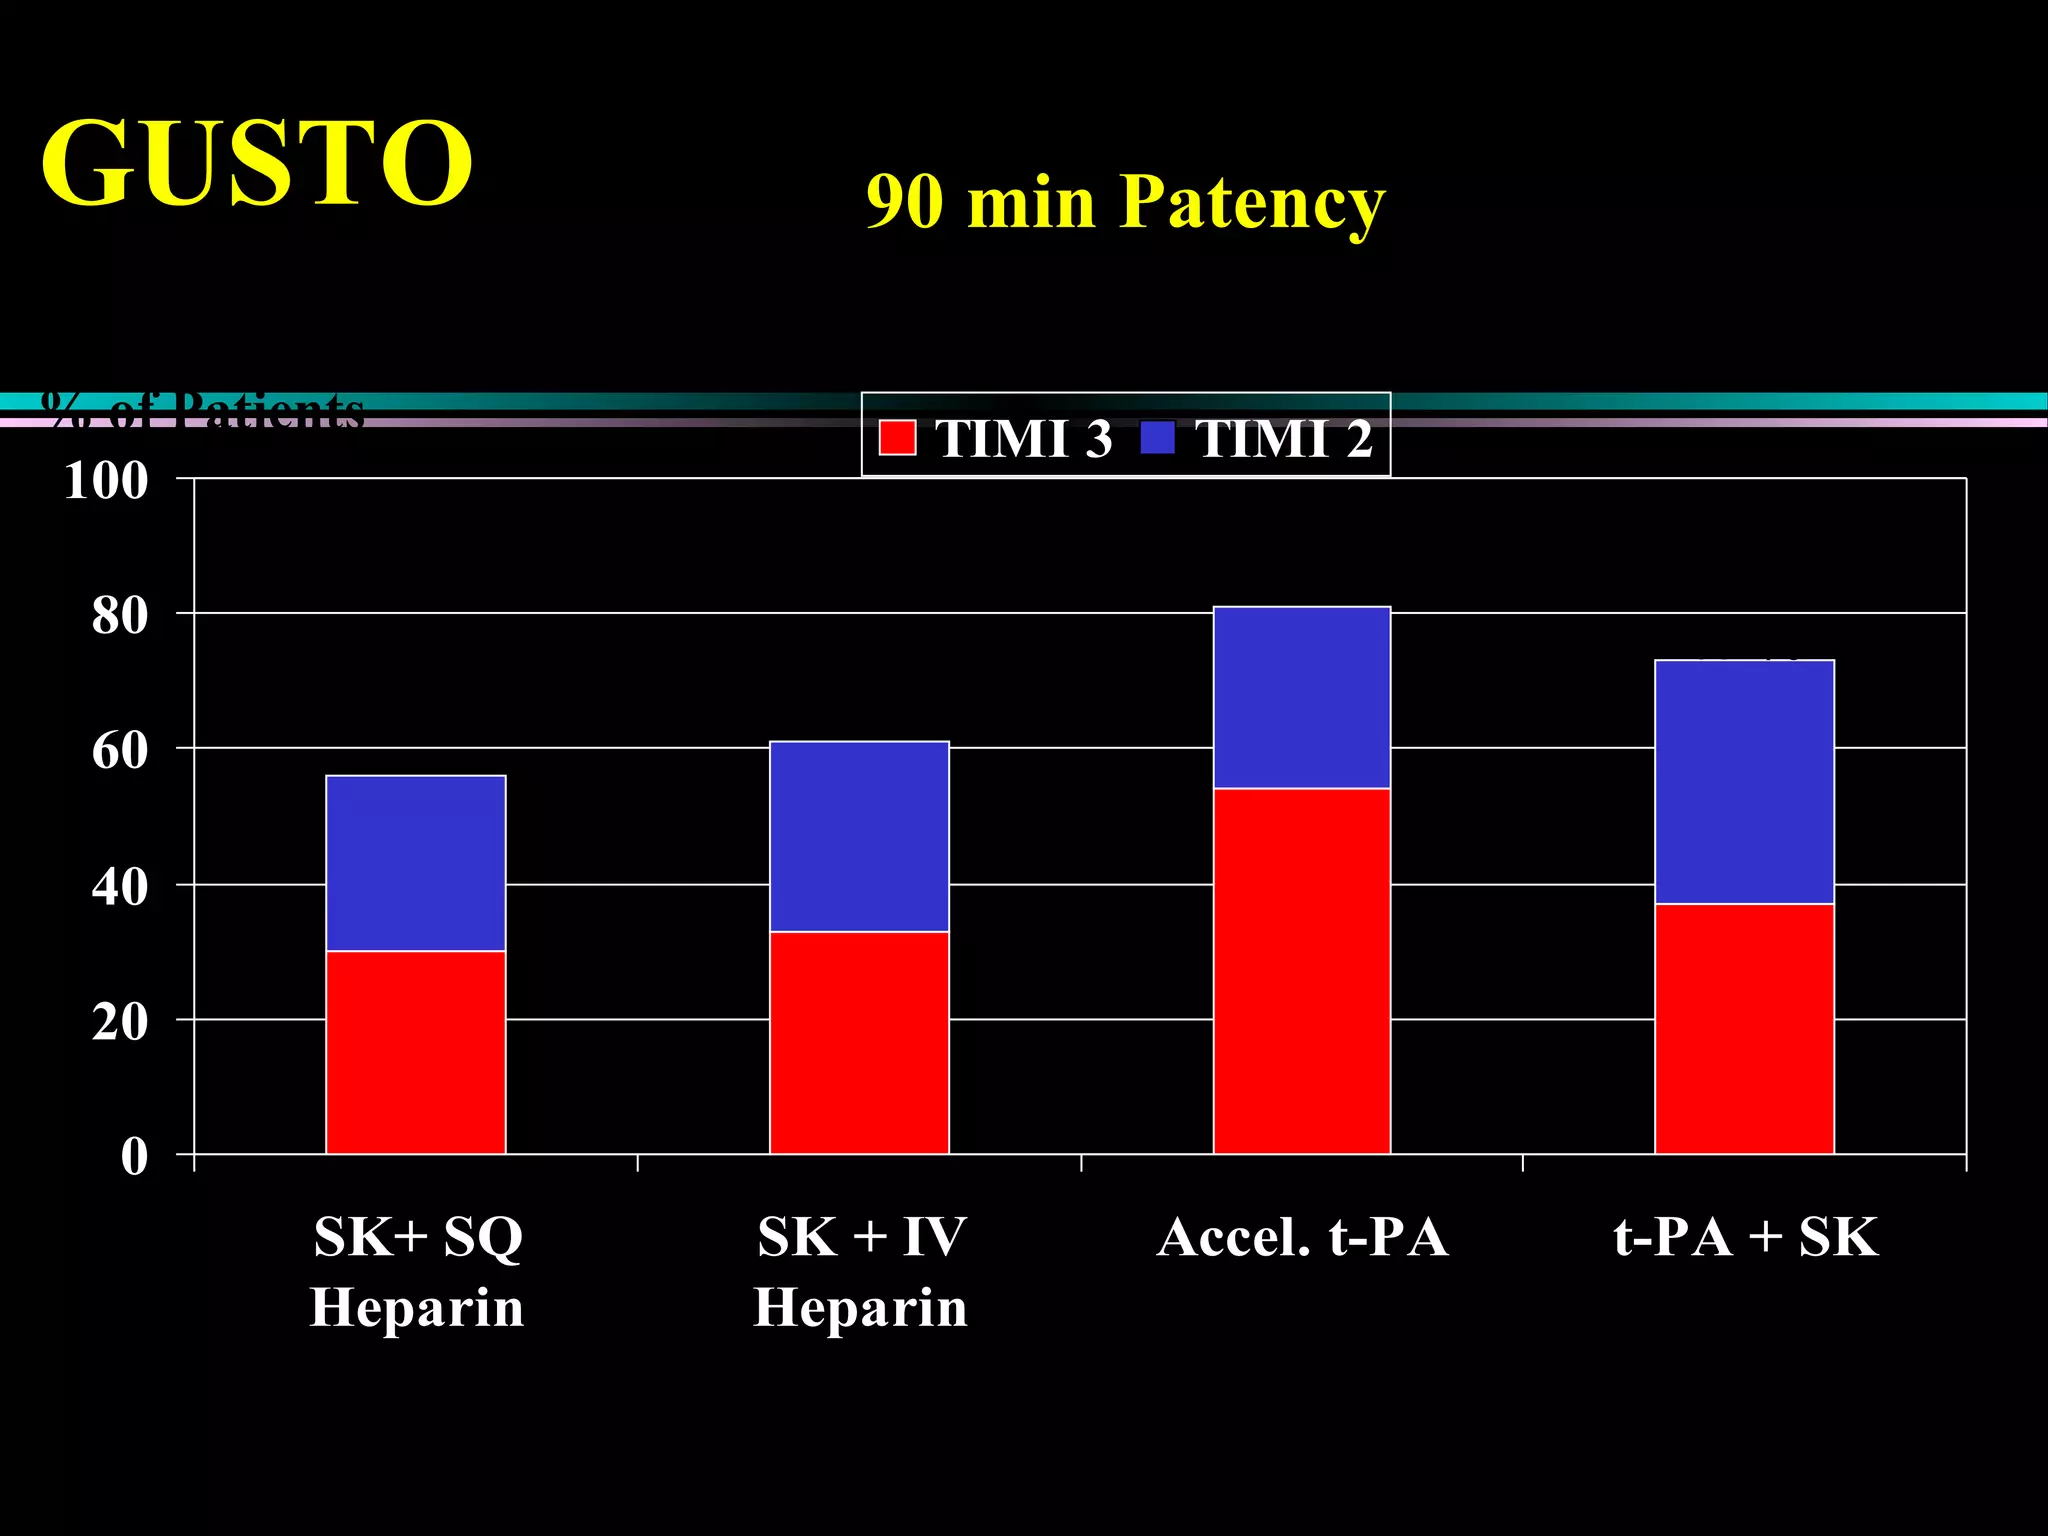
Treatment approaches for acute myocardial infarction, including pharmacologic therapies and interventions to optimize outcomes.
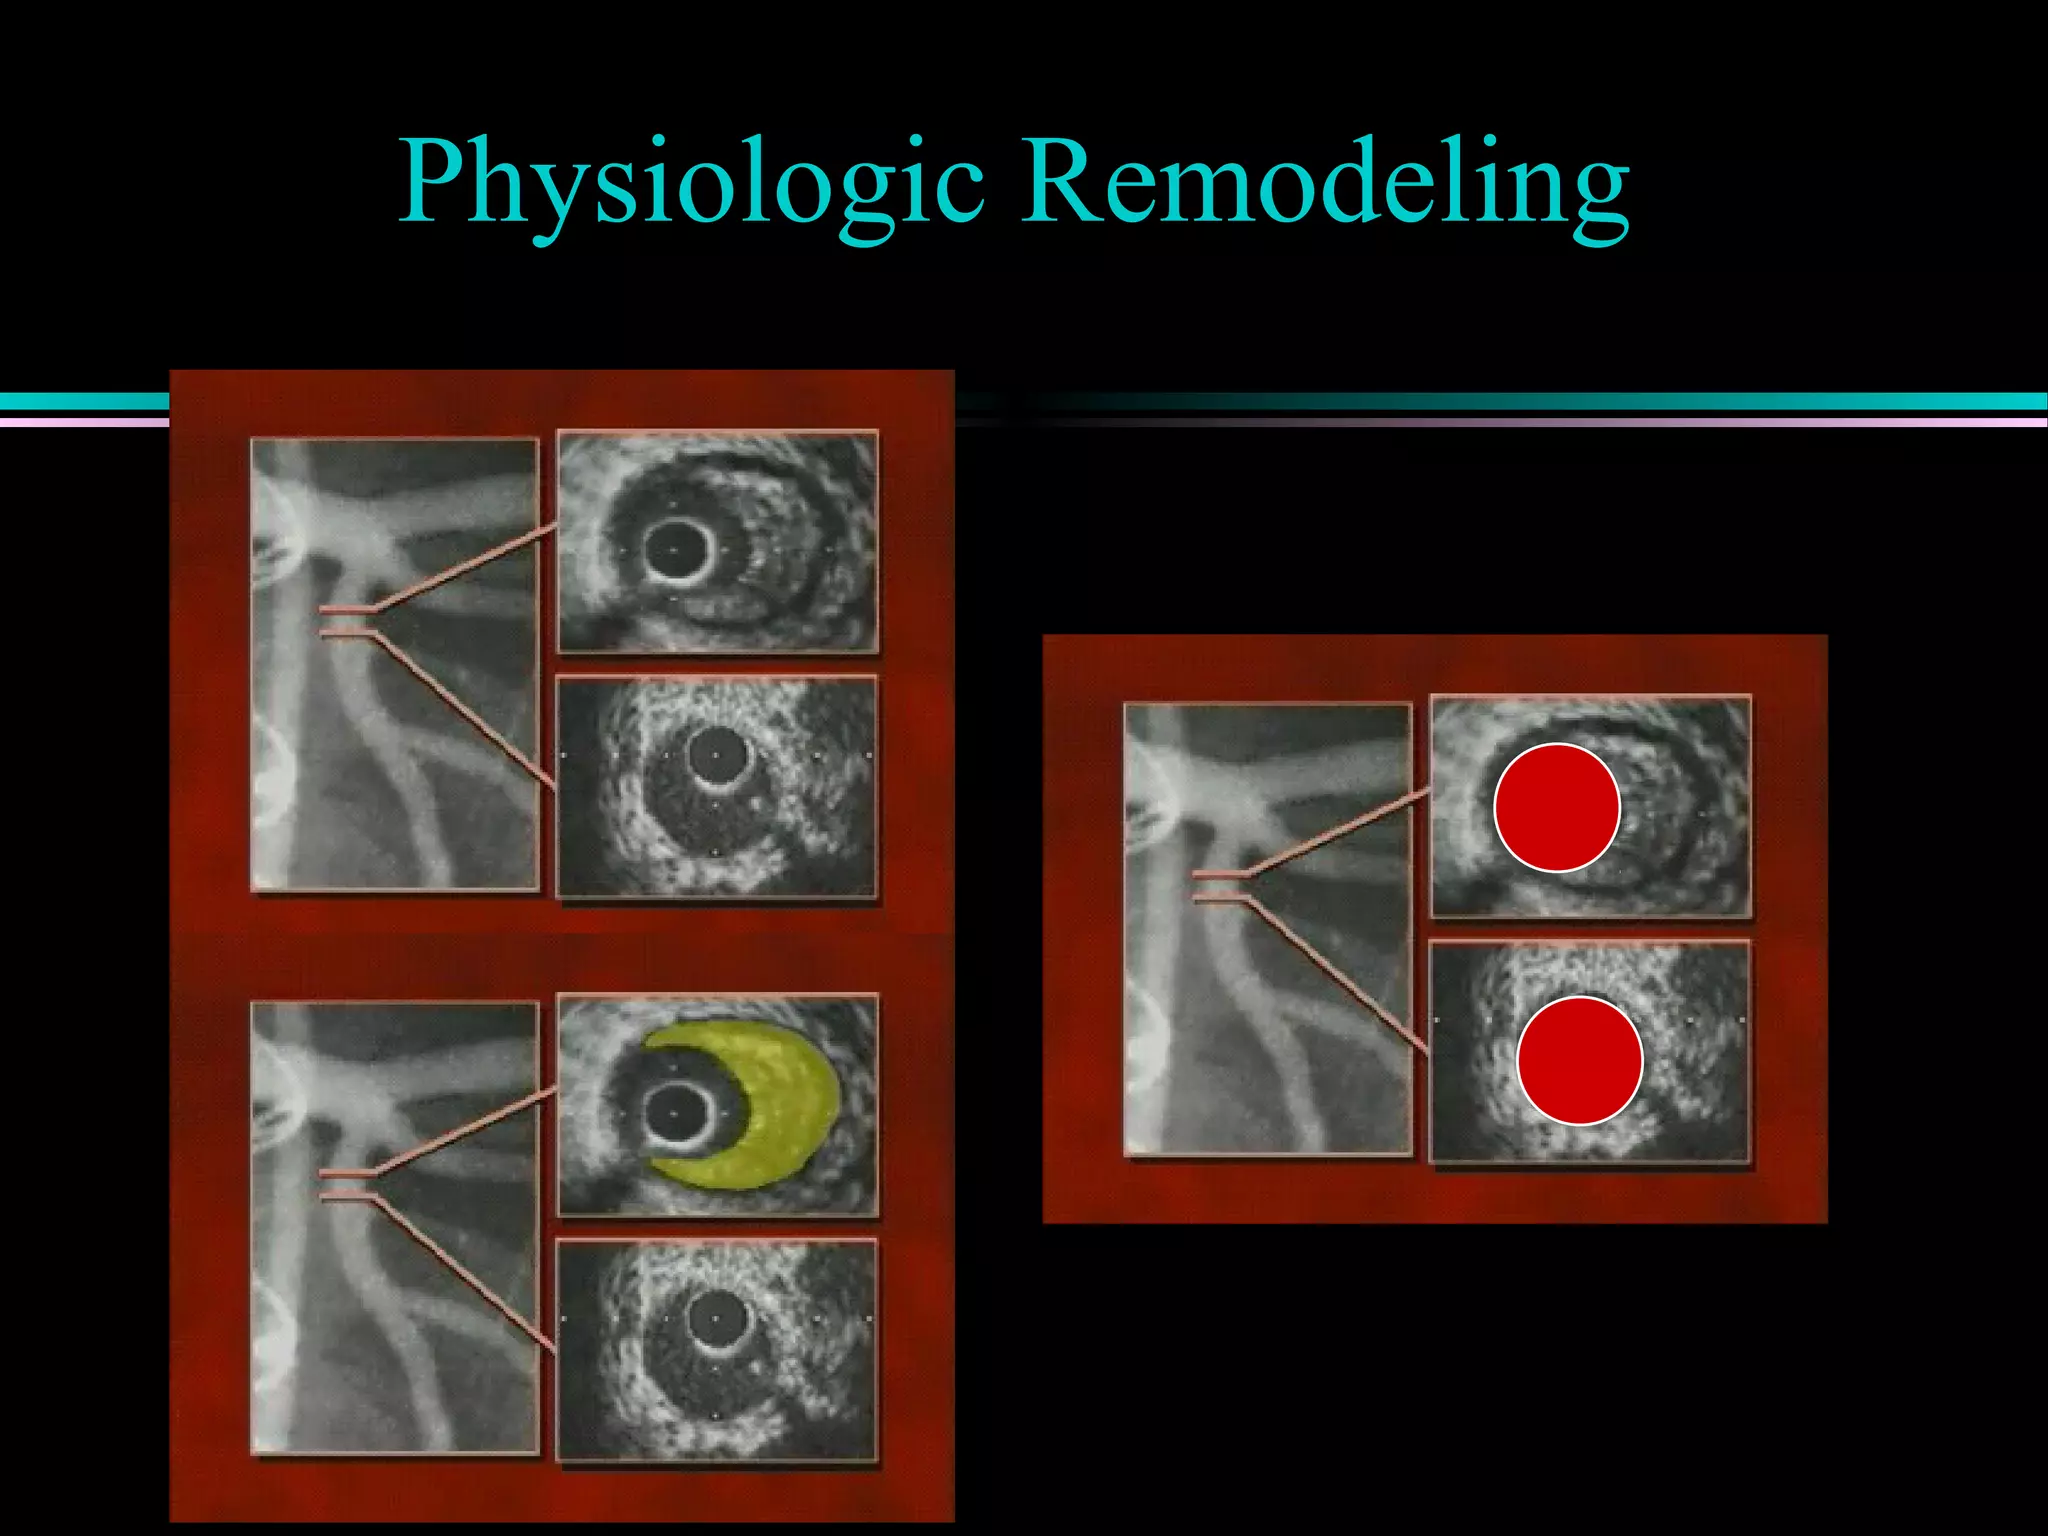
Introduction to the changing paradigm of physiologic remodeling in coronary artery disease.


