Downloaded 169 times
![Surface Acoustic Wave (SAW) Wireless Passive RF Sensor Systems Donald C. Malocha School of Electrical Engineering & Computer Science University of Central Florida Orlando, Fl. 32816-2450 [email_address]](https://image.slidesharecdn.com/usfsawwireless102109-091201132303-phpapp01/85/UCF-Wireless-SAW-Sensor-Systems-1-320.jpg)
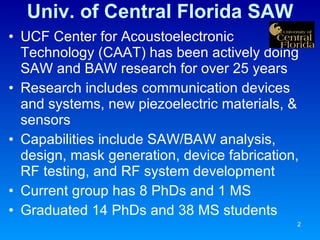
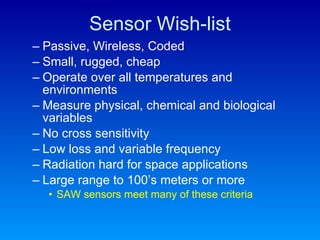
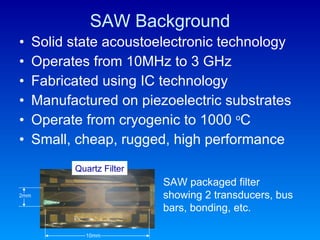
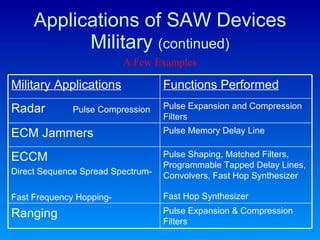
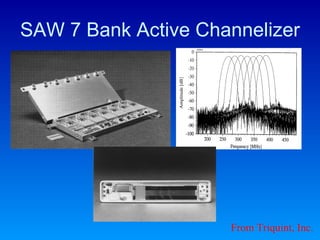

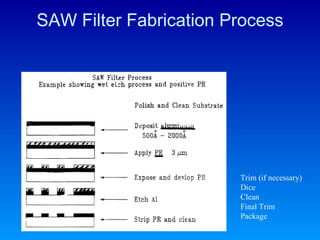
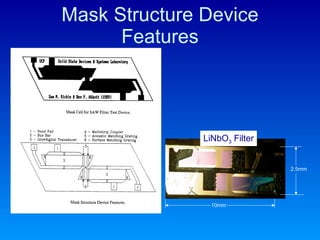
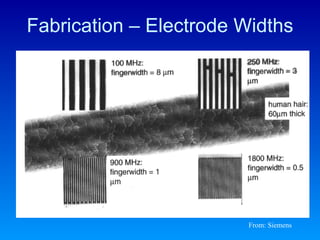
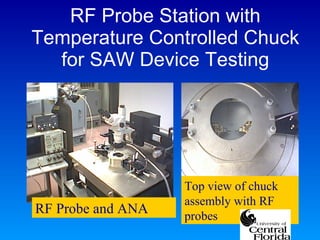
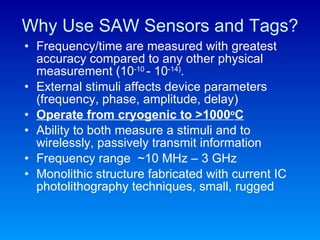
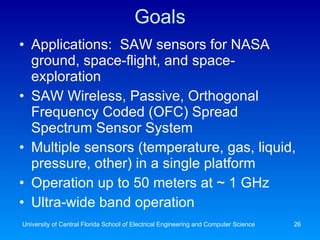


The document details the research and development of surface acoustic wave (SAW) wireless passive RF sensor systems at the University of Central Florida, highlighting their applications in military and consumer technologies. It describes the manufacturing capabilities, the advantages of SAW devices, and their potential in sensing various physical, chemical, and biological variables. Additionally, the document discusses specific projects and collaborations, including those with NASA, focusing on the development of robust, multi-sensor platforms and their applications in extreme environments.


![5G Explained! A High Level Overview [Introduction]](https://cdn.slidesharecdn.com/ss_thumbnails/5gexplainedahighleveloverview-260119165306-cc137a3e-thumbnail.jpg?width=640&height=640&fit=bounds)


