Downloaded 152 times

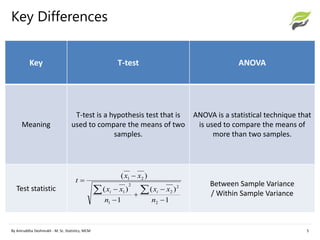
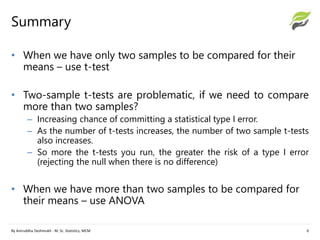


T-test and ANOVA are statistical techniques used to test hypotheses and compare population means. The t-test is used to compare the means of two samples or groups, while ANOVA can compare the means of more than two groups. Specifically, the t-test examines whether two sample means are significantly different and assumes a normal distribution and unknown standard deviation. ANOVA compares three or more population means by assessing variation within and between groups, and assumes samples are from normally distributed populations with equal variances. Researchers should use a t-test when comparing only two means and ANOVA when comparing more than two means to avoid increasing the chances of a Type I error.