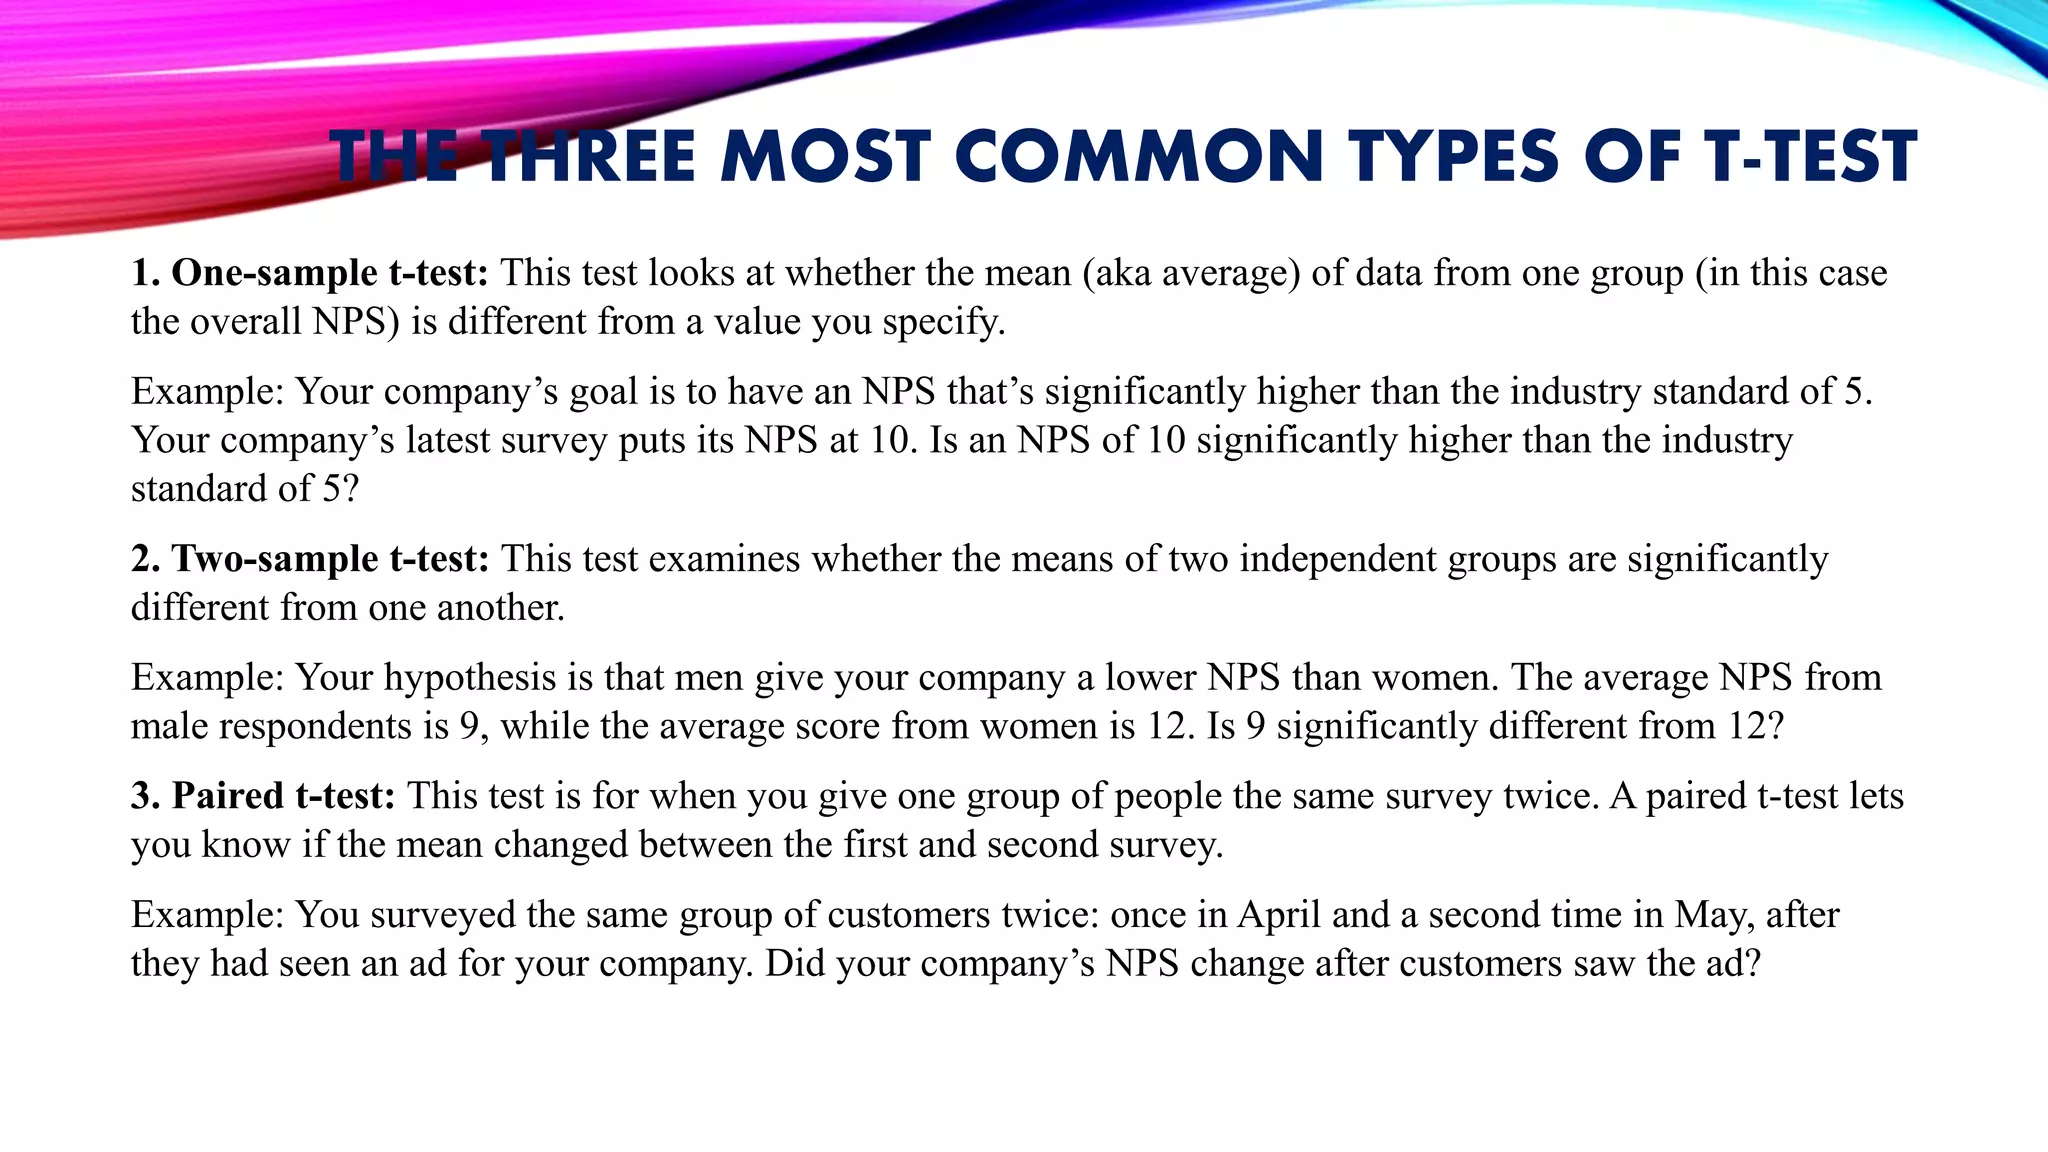
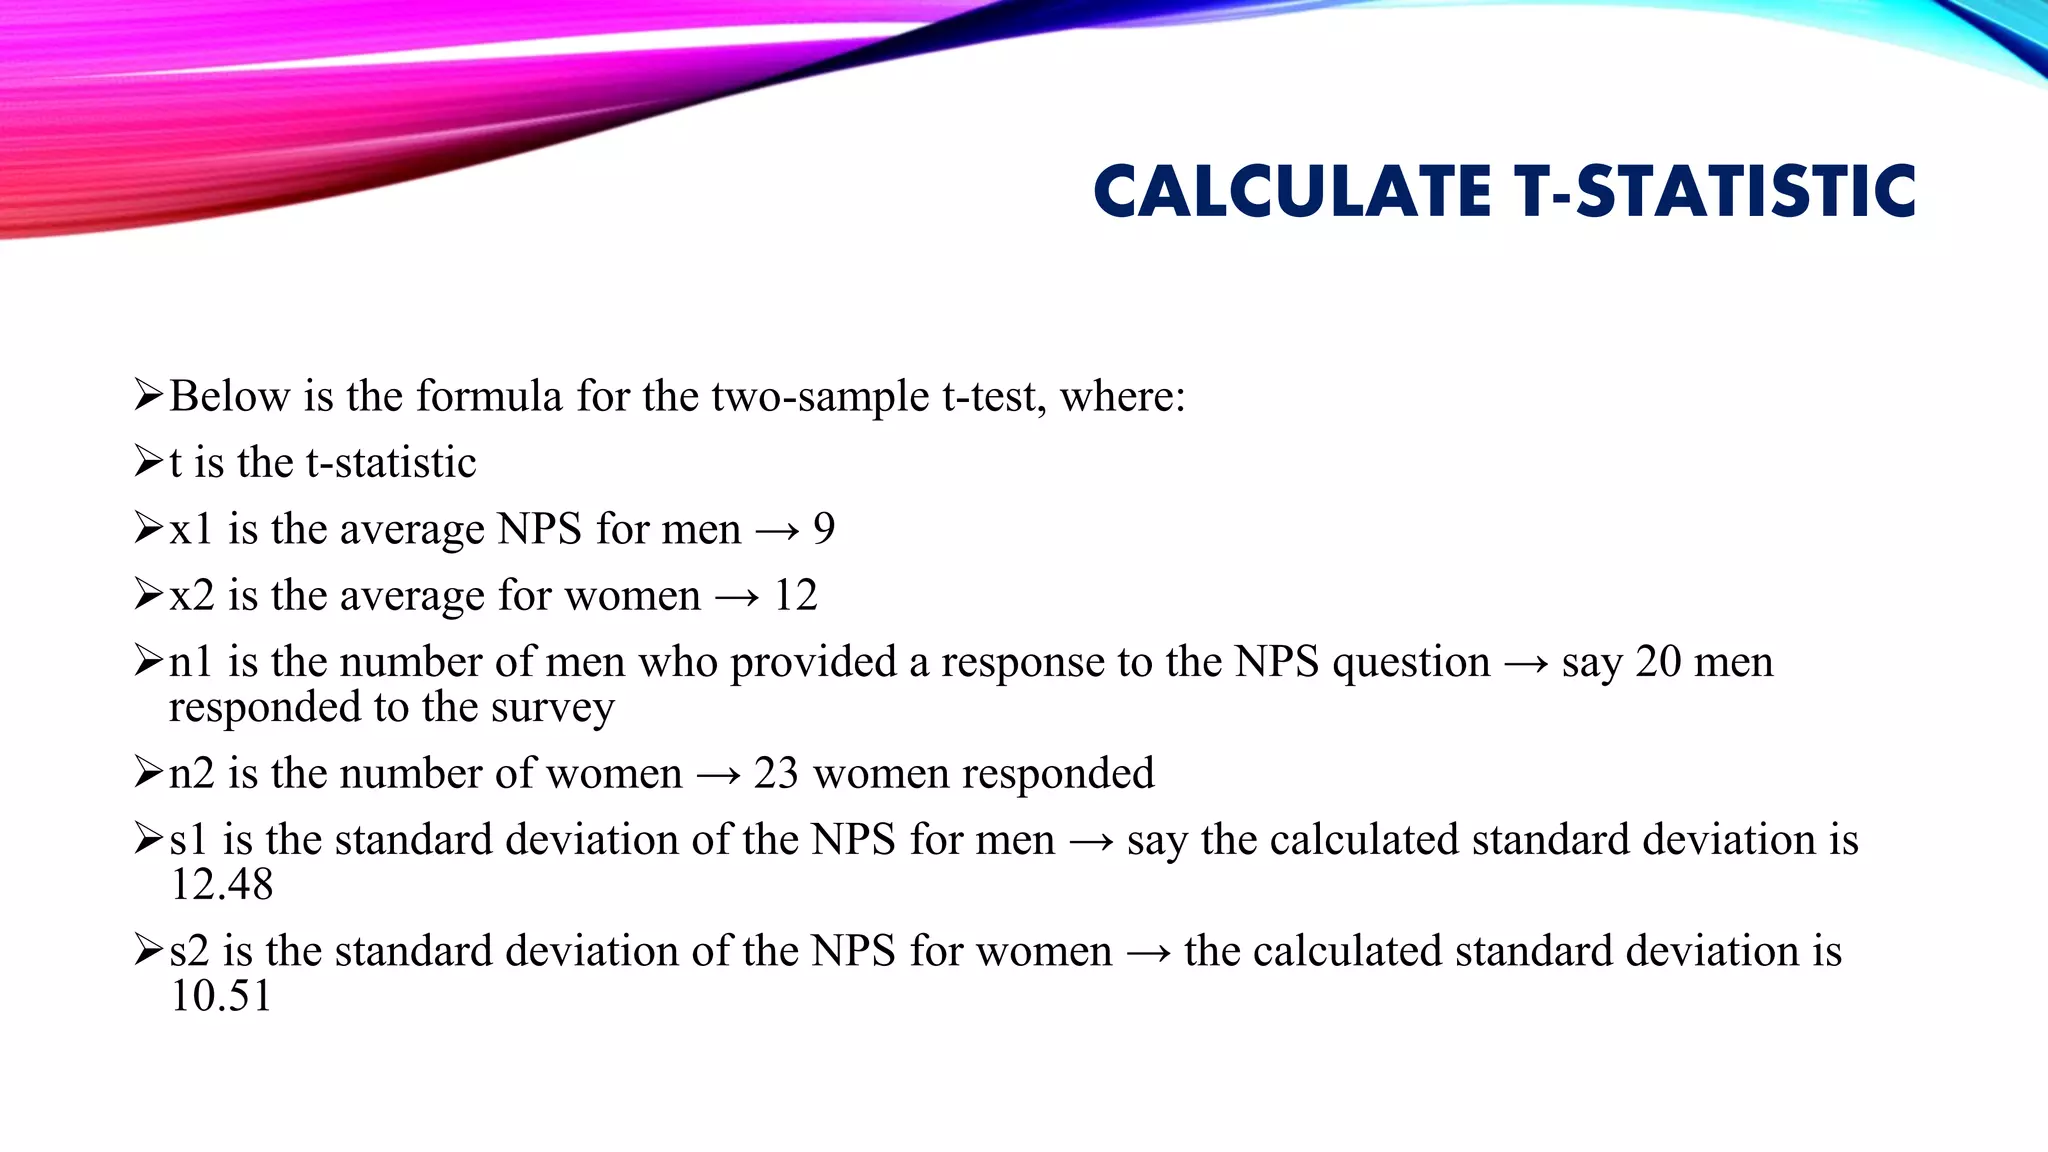
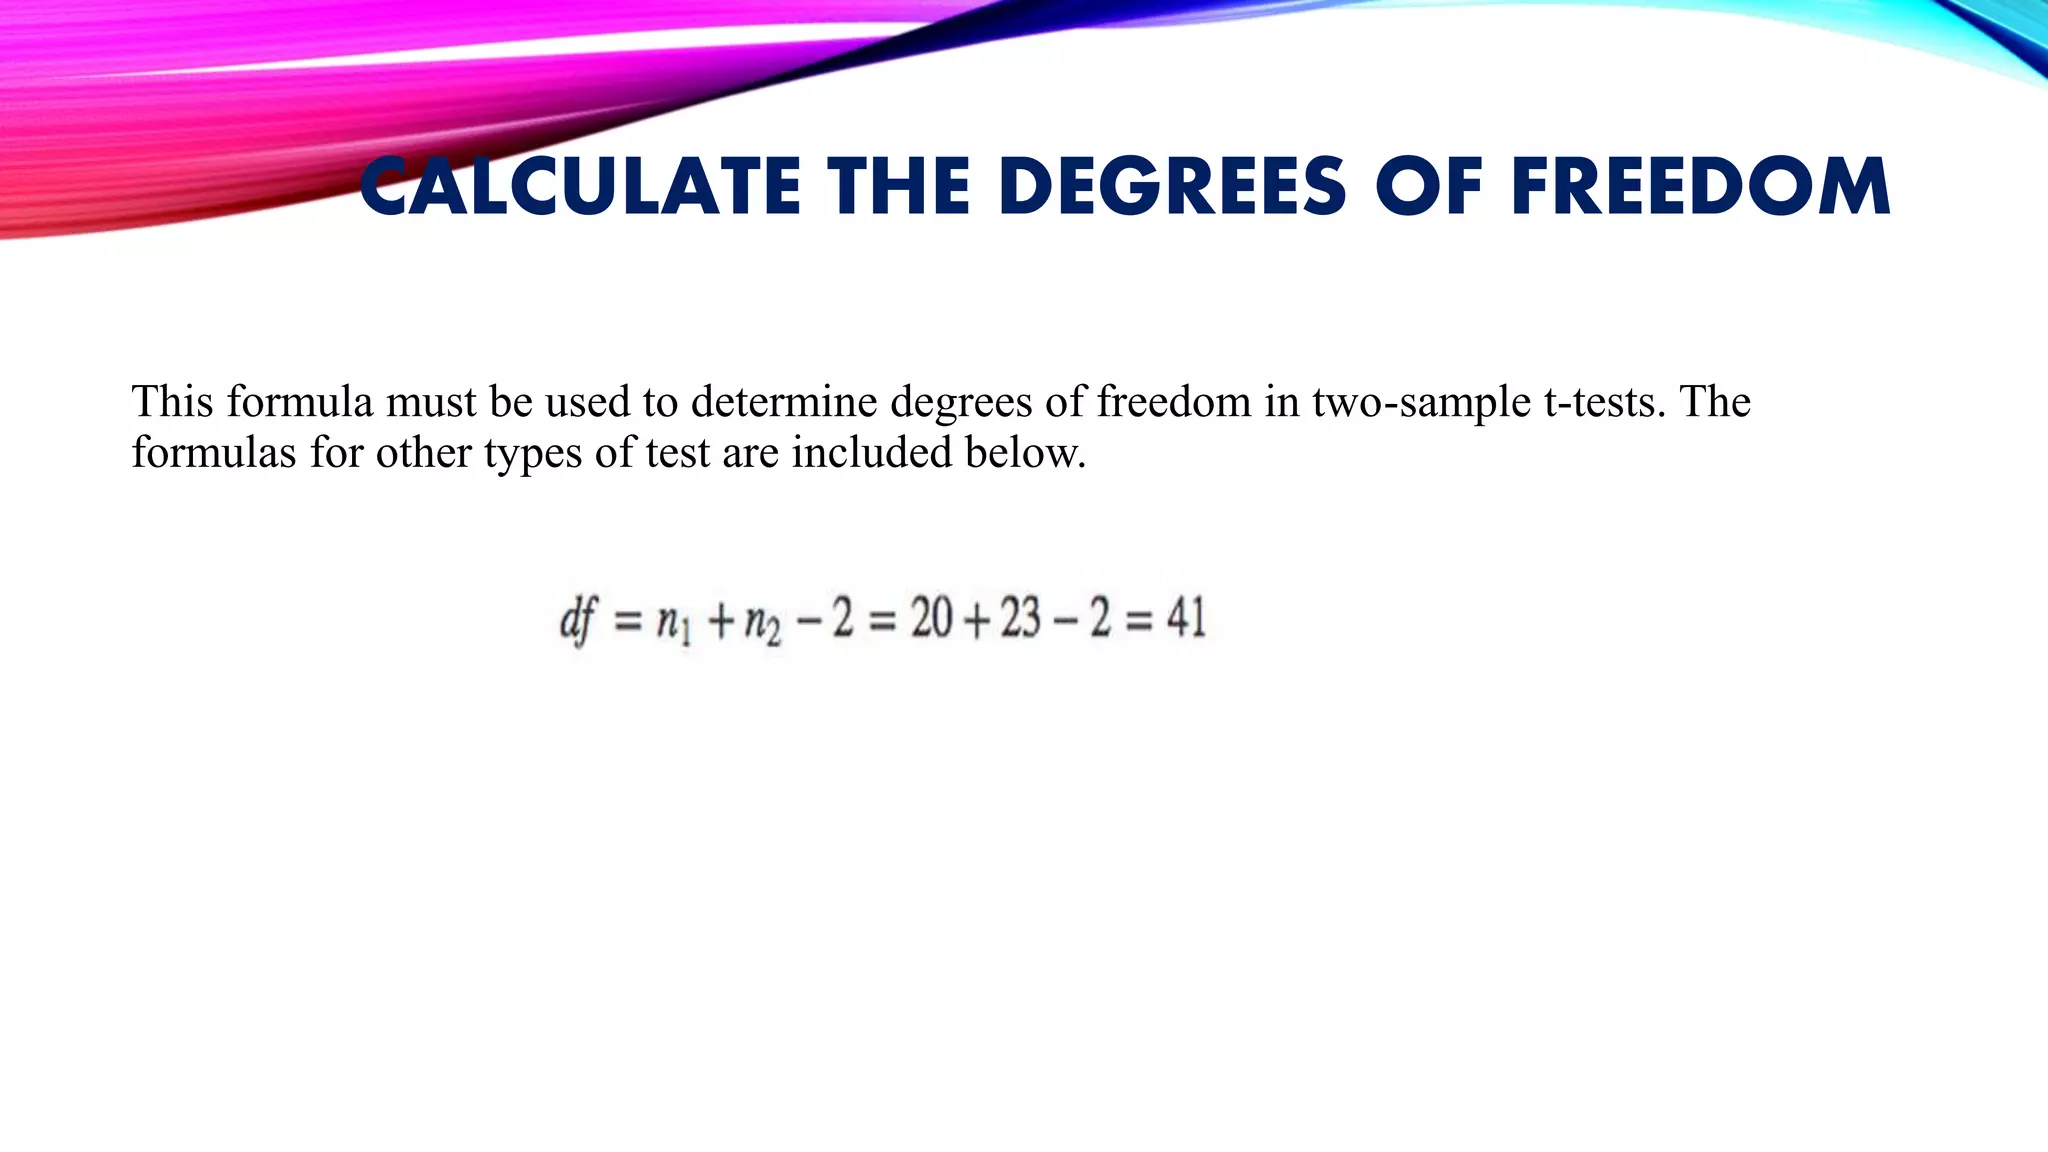
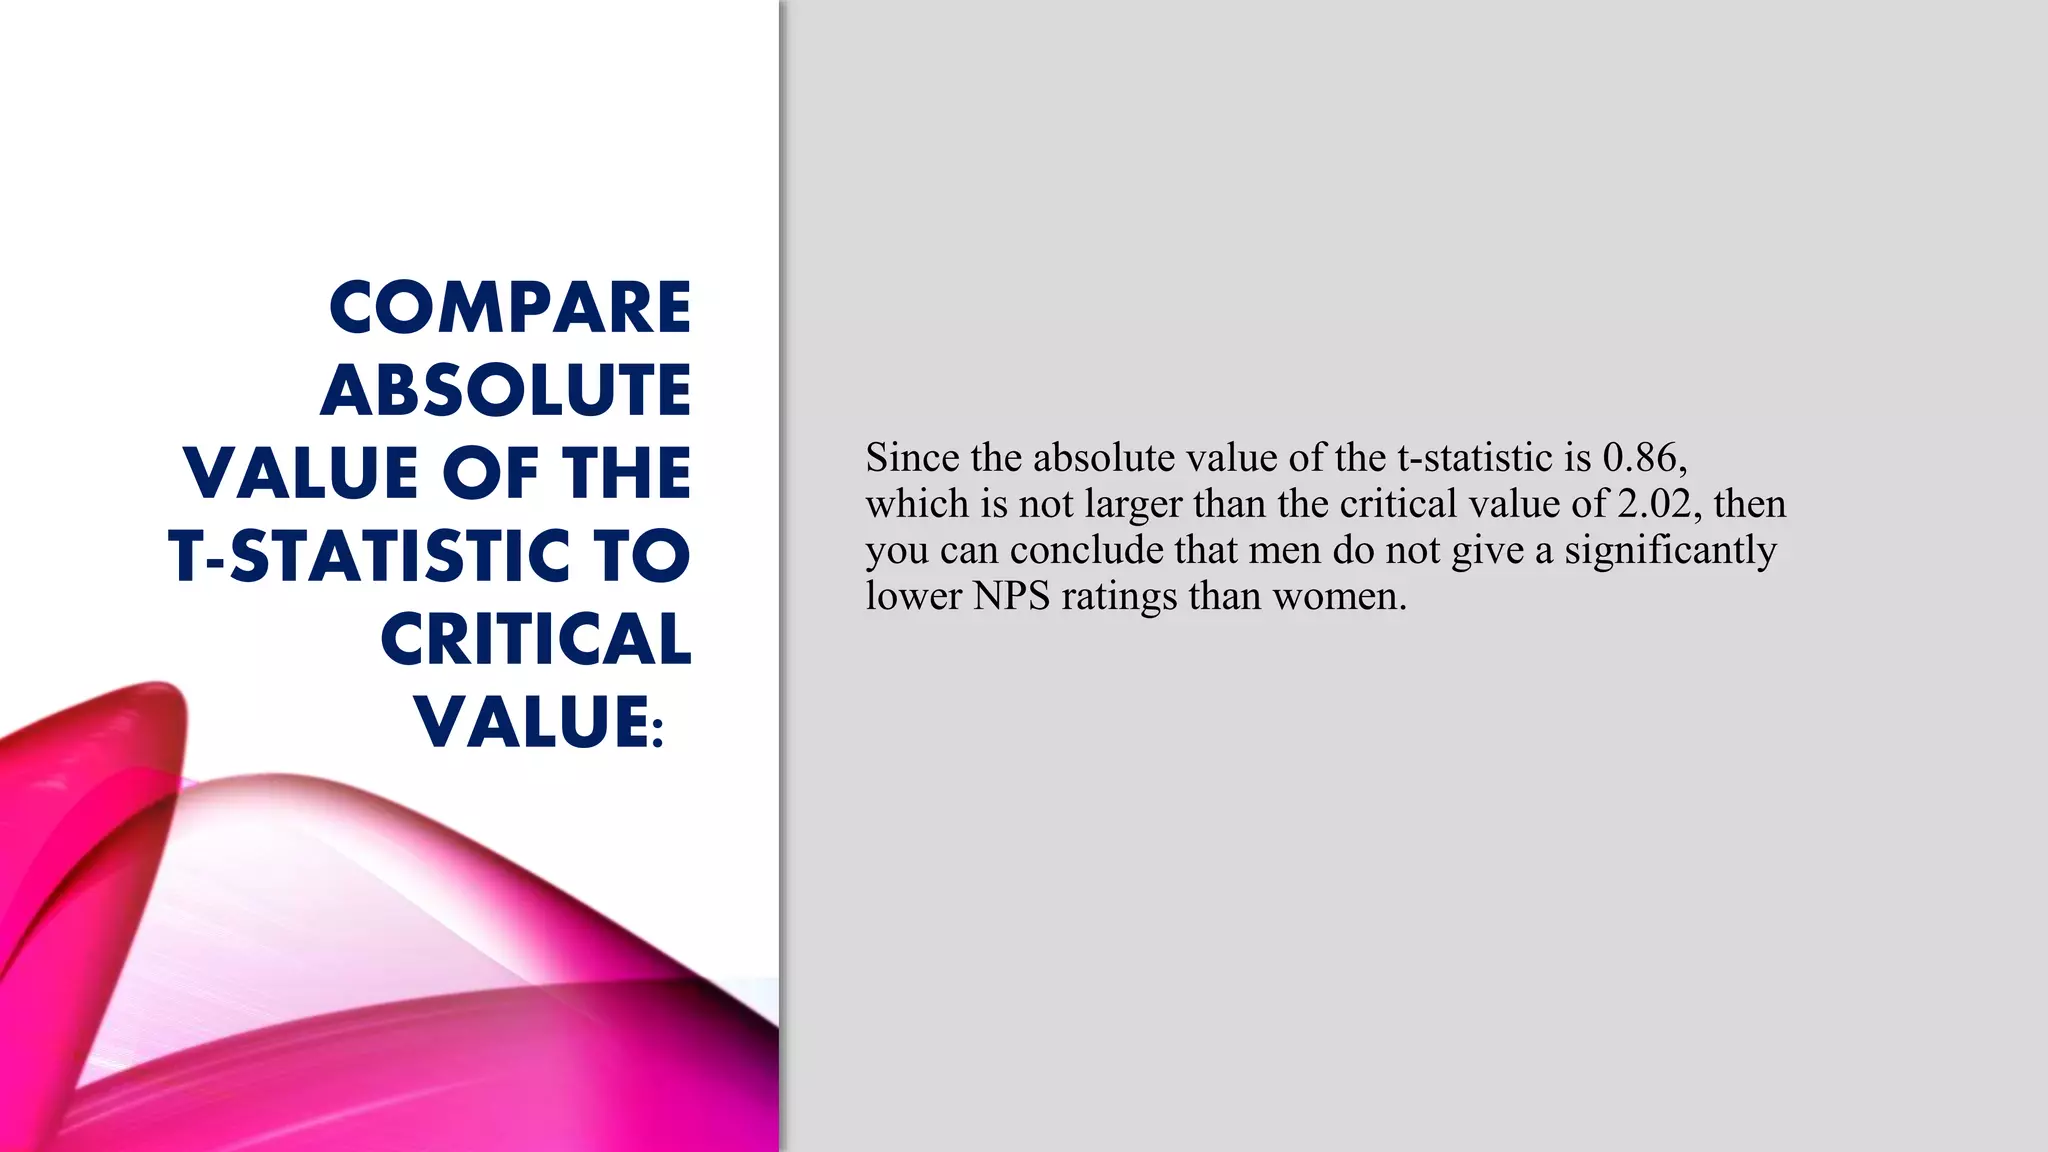
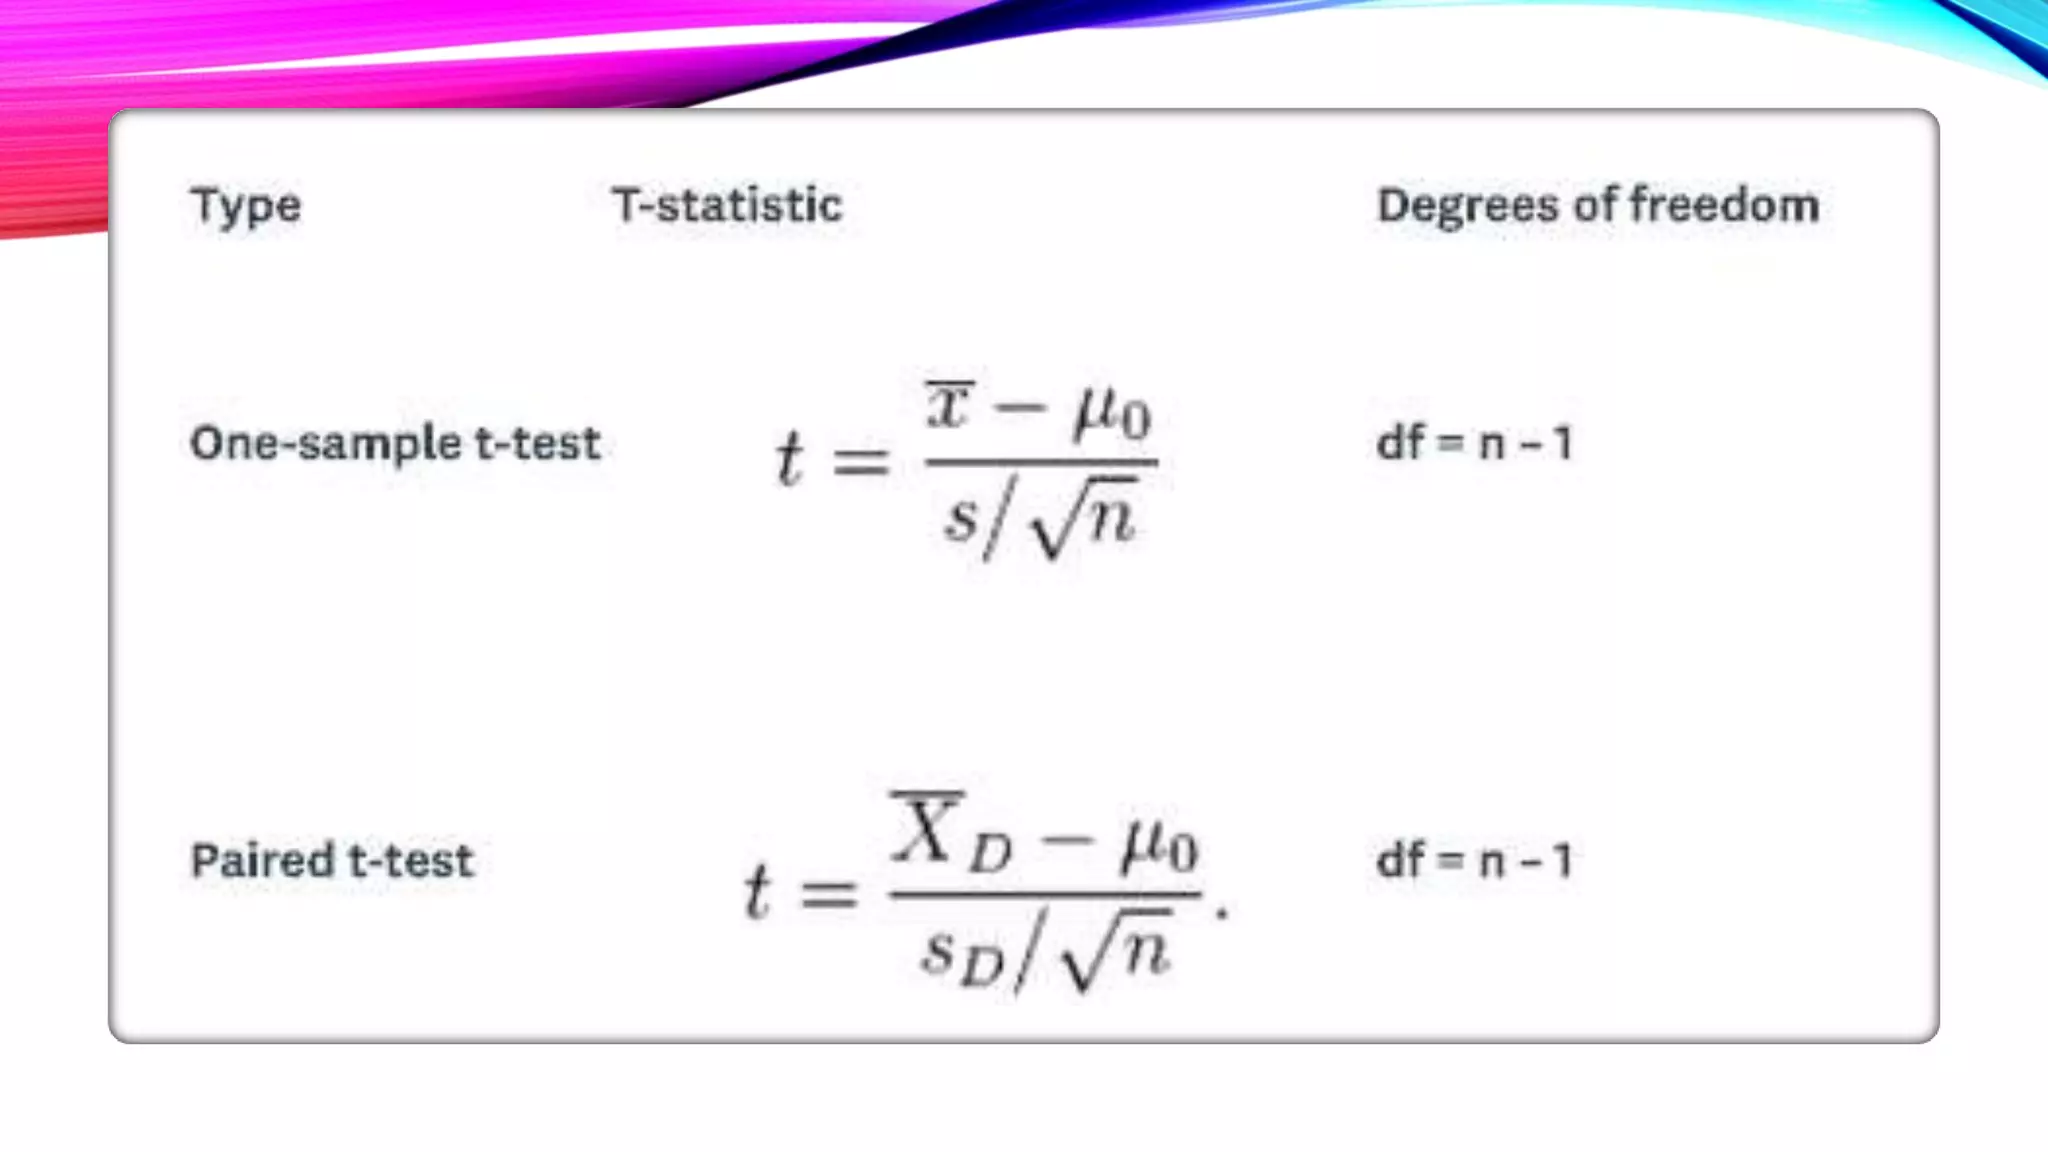
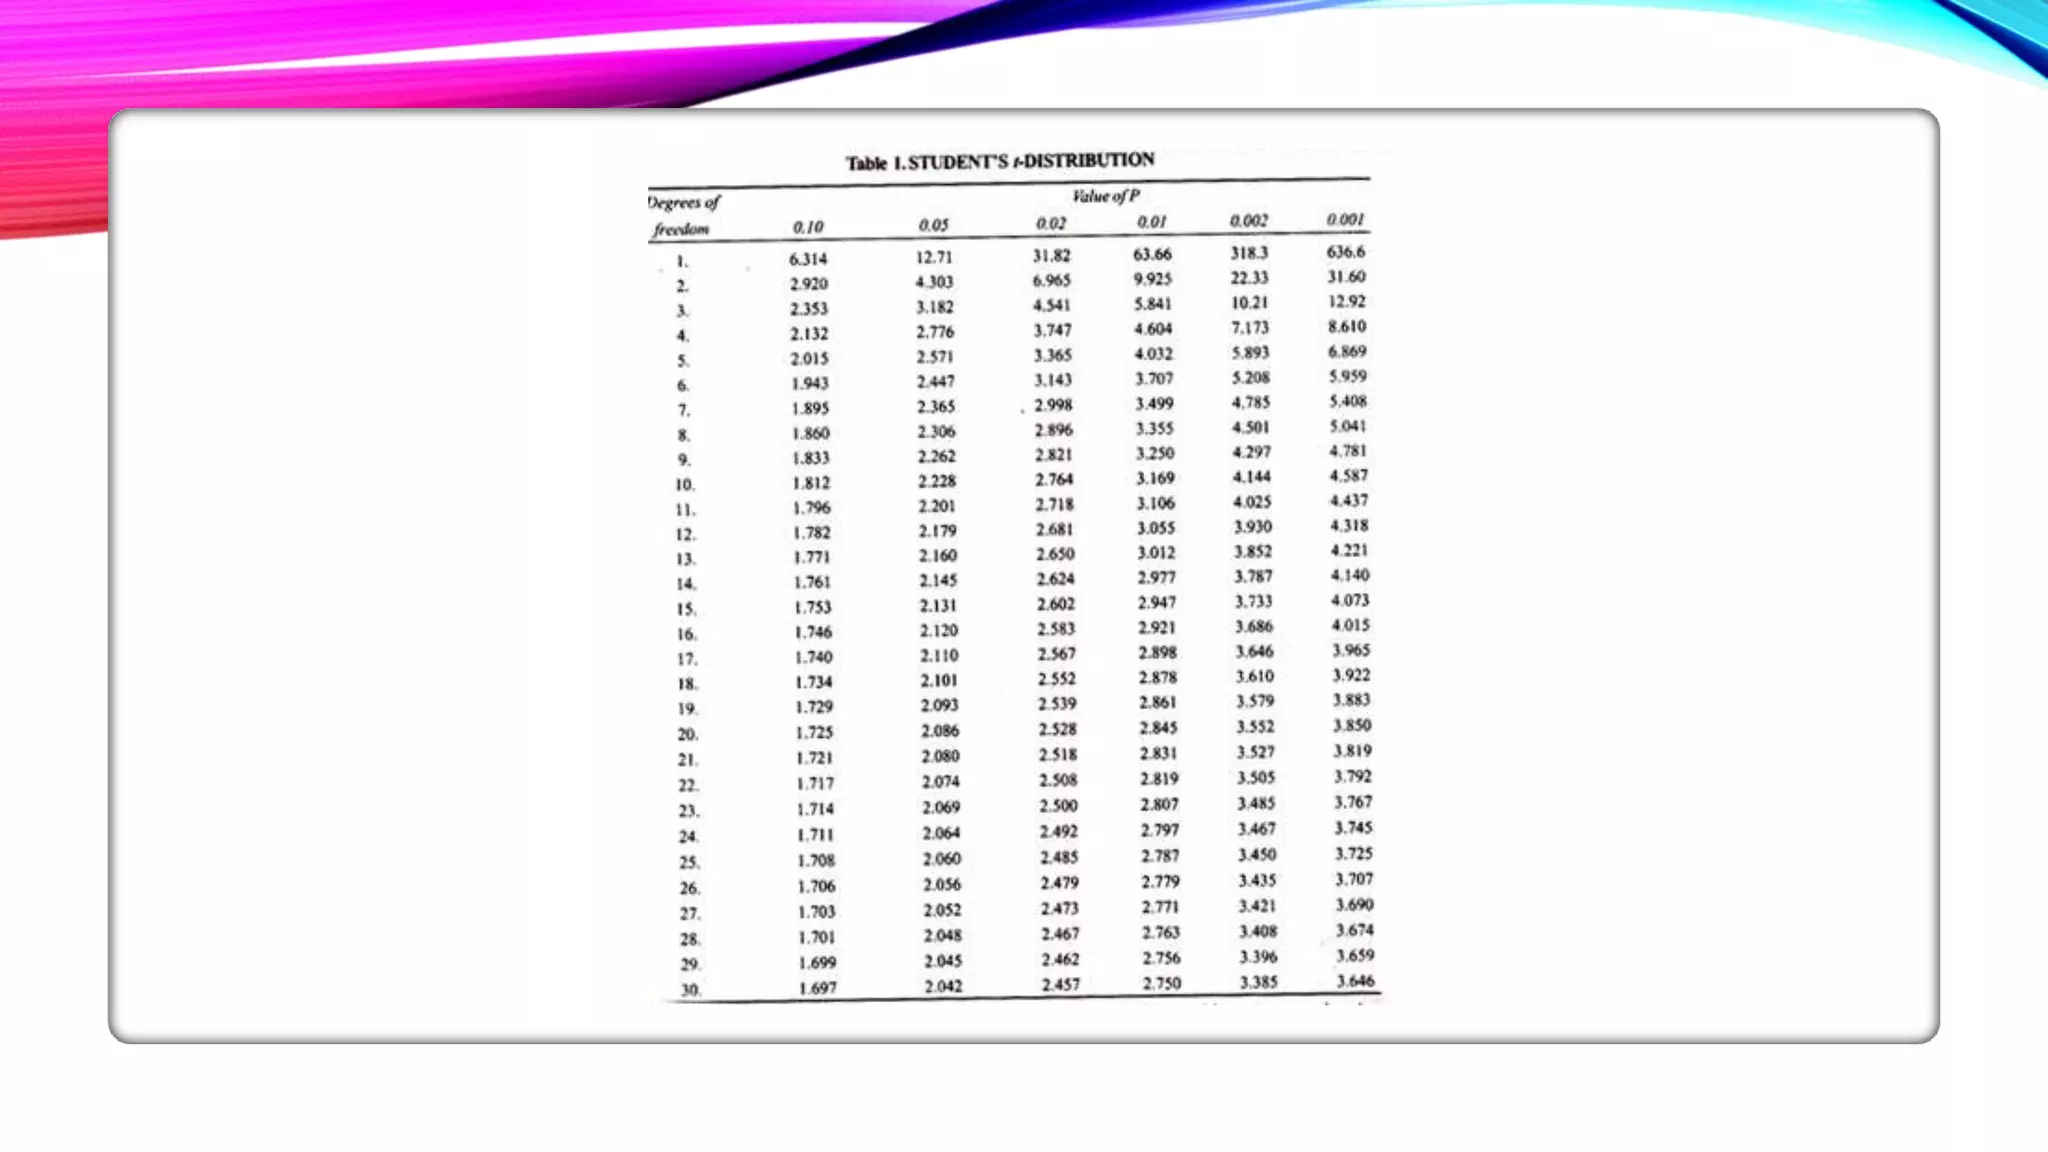
SlideShare a Scribd company logo
STUDENT T - TEST
The t-test is a way to determine whether two
numbers are significantly different from one
another. There are several types of t-test, and
each is calculated using a different formula.
THE THREE MOST COMMON TYPES OF T-TEST
1. One-sample t-test: This test looks at whether the mean (aka average) of data from one group (in this case
the overall NPS) is different from a value you specify.
Example: Your company’s goal is to have an NPS that’s significantly higher than the industry standard of 5.
Your company’s latest survey puts its NPS at 10. Is an NPS of 10 significantly higher than the industry
standard of 5?
2. Two-sample t-test: This test examines whether the means of two independent groups are significantly
different from one another.
Example: Your hypothesis is that men give your company a lower NPS than women. The average NPS from
male respondents is 9, while the average score from women is 12. Is 9 significantly different from 12?
3. Paired t-test: This test is for when you give one group of people the same survey twice. A paired t-test lets
you know if the mean changed between the first and second survey.
Example: You surveyed the same group of customers twice: once in April and a second time in May, after
they had seen an ad for your company. Did your company’s NPS change after customers saw the ad?
HOW TO CONDUCT A T-TEST
1. Calculate the t-statistic:
Each type of t-test has a different formula for calculating the t-statistic (You can scroll to the
bottom of the page to find all three formulas).
2. Calculate the degrees of freedom:
Degrees of freedom are the number of ways the mean could vary. In this case, the degrees of
freedom are the number of NPS ratings that you could have in a given group of respondents.
Similar to the t-statistic, the formula for degrees of freedom will vary depending on the type of
t-test you perform.
3. Determine the critical value:
The critical value is the threshold at which the difference between two numbers is considered
to be statistically significant.
4. Compare absolute value of the t-statistic to critical value:
If your t-statistic is larger than your critical value, your difference is significant. If your t-
statistic is smaller, then your two numbers are, statistically speaking, indistinguishable.
CALCULATE T-STATISTIC
Below is the formula for the two-sample t-test, where:
t is the t-statistic
x1 is the average NPS for men → 9
x2 is the average for women → 12
n1 is the number of men who provided a response to the NPS question → say 20 men
responded to the survey
n2 is the number of women → 23 women responded
s1 is the standard deviation of the NPS for men → say the calculated standard deviation is
12.48
s2 is the standard deviation of the NPS for women → the calculated standard deviation is
10.51
CALCULATE THE DEGREES OF FREEDOM
This formula must be used to determine degrees of freedom in two-sample t-tests. The
formulas for other types of test are included below.
DETERMINE
CRITICAL VALUE
According to this table, for a two-tailed test with an
alpha level of 0.05 at 41 degrees of freedom, the
critical value is 2.02.
Note that most analysts use a two-tailed test instead
of a one-tailed test because it’s more conservative.
COMPARE
ABSOLUTE
VALUE OF THE
T-STATISTIC TO
CRITICAL
VALUE:
Since the absolute value of the t-statistic is 0.86,
which is not larger than the critical value of 2.02, then
you can conclude that men do not give a significantly
lower NPS ratings than women.
Student T -  test
Student T -  test
Student T -  test

More Related Content

What's hot

Design of Experiments
Design of ExperimentsDesign of Experiments
Non parametric test
Non parametric testNon parametric test
Non parametric test
dineshmeena53
 
NON-PARAMETRIC TESTS by Prajakta Sawant
NON-PARAMETRIC TESTS by Prajakta SawantNON-PARAMETRIC TESTS by Prajakta Sawant
NON-PARAMETRIC TESTS by Prajakta Sawant
PRAJAKTASAWANT33
 
Wilcoxon signed rank test
Wilcoxon signed rank testWilcoxon signed rank test
Wilcoxon signed rank test
Biswash Sapkota
 
wilcoxon signed rank test
wilcoxon signed rank testwilcoxon signed rank test
wilcoxon signed rank test
raj shekar
 
Parametric & non parametric
Parametric & non parametricParametric & non parametric
Parametric & non parametric
ANCYBS
 
Wilcoxon Signed Rank Test
Wilcoxon Signed Rank Test Wilcoxon Signed Rank Test
Wilcoxon Signed Rank Test
Sharlaine Ruth
 
Analysis of variance (ANOVA)
Analysis of variance (ANOVA)Analysis of variance (ANOVA)
Analysis of variance (ANOVA)
Tesfamichael Getu
 
Mann- Whitney Test.pptx
Mann- Whitney Test.pptxMann- Whitney Test.pptx
Mann- Whitney Test.pptx
EchaACagalitan
 
Standard error of the mean
Standard error of the meanStandard error of the mean
Student's T-test, Paired T-Test, ANOVA & Proportionate Test
Student's T-test, Paired T-Test, ANOVA & Proportionate TestStudent's T-test, Paired T-Test, ANOVA & Proportionate Test
Student's T-test, Paired T-Test, ANOVA & Proportionate Test
Azmi Mohd Tamil
 
Applications of sas and minitab in data analysis
Applications of sas and minitab in data analysisApplications of sas and minitab in data analysis
Applications of sas and minitab in data analysis
VeenaV29
 
Advance Statistics - Wilcoxon Signed Rank Test
Advance Statistics - Wilcoxon Signed Rank TestAdvance Statistics - Wilcoxon Signed Rank Test
Advance Statistics - Wilcoxon Signed Rank Test
Joshua Batalla
 
Introduction to ANOVA
Introduction to ANOVAIntroduction to ANOVA
Introduction to ANOVA
AKASH GHANATE
 
Chi square test
Chi square testChi square test
Chi square test
Nayna Azad
 
Analysis of variance
Analysis of varianceAnalysis of variance
Analysis of variance
Dr NEETHU ASOKAN
 

What's hot (20)

Design of Experiments
Design of ExperimentsDesign of Experiments
Design of Experiments
 
Non parametric test
Non parametric testNon parametric test
Non parametric test
 
NON-PARAMETRIC TESTS by Prajakta Sawant
NON-PARAMETRIC TESTS by Prajakta SawantNON-PARAMETRIC TESTS by Prajakta Sawant
NON-PARAMETRIC TESTS by Prajakta Sawant
 
Student’s t test
Student’s  t testStudent’s  t test
Student’s t test
 
Wilcoxon signed rank test
Wilcoxon signed rank testWilcoxon signed rank test
Wilcoxon signed rank test
 
wilcoxon signed rank test
wilcoxon signed rank testwilcoxon signed rank test
wilcoxon signed rank test
 
Parametric & non parametric
Parametric & non parametricParametric & non parametric
Parametric & non parametric
 
Wilcoxon Signed Rank Test
Wilcoxon Signed Rank Test Wilcoxon Signed Rank Test
Wilcoxon Signed Rank Test
 
Analysis of variance (ANOVA)
Analysis of variance (ANOVA)Analysis of variance (ANOVA)
Analysis of variance (ANOVA)
 
Mann- Whitney Test.pptx
Mann- Whitney Test.pptxMann- Whitney Test.pptx
Mann- Whitney Test.pptx
 
Confidence interval
Confidence intervalConfidence interval
Confidence interval
 
Standard error of the mean
Standard error of the meanStandard error of the mean
Standard error of the mean
 
Student's T-test, Paired T-Test, ANOVA & Proportionate Test
Student's T-test, Paired T-Test, ANOVA & Proportionate TestStudent's T-test, Paired T-Test, ANOVA & Proportionate Test
Student's T-test, Paired T-Test, ANOVA & Proportionate Test
 
Applications of sas and minitab in data analysis
Applications of sas and minitab in data analysisApplications of sas and minitab in data analysis
Applications of sas and minitab in data analysis
 
Advance Statistics - Wilcoxon Signed Rank Test
Advance Statistics - Wilcoxon Signed Rank TestAdvance Statistics - Wilcoxon Signed Rank Test
Advance Statistics - Wilcoxon Signed Rank Test
 
Introduction to ANOVA
Introduction to ANOVAIntroduction to ANOVA
Introduction to ANOVA
 
Chi square test
Chi square testChi square test
Chi square test
 
Confidence Intervals
Confidence IntervalsConfidence Intervals
Confidence Intervals
 
Kruskal wallis test
Kruskal wallis testKruskal wallis test
Kruskal wallis test
 
Analysis of variance
Analysis of varianceAnalysis of variance
Analysis of variance
 

Similar to Student T - test

What is a t test
What is a t testWhat is a t test
What is a t test
Dr.Nadeem Khan
 
Independent Samples t-test.pptx
Independent Samples t-test.pptxIndependent Samples t-test.pptx
Independent Samples t-test.pptx
rv1272
 
t test
t testt test
t test for statistics 1st sem mba sylabus
t test for statistics 1st sem mba sylabust test for statistics 1st sem mba sylabus
t test for statistics 1st sem mba sylabus
SoujanyaLk1
 
students_t_test.ppt
students_t_test.pptstudents_t_test.ppt
students_t_test.ppt
Khayal Abbas Akhtar
 
students_t_test.ppt
students_t_test.pptstudents_t_test.ppt
students_t_test.ppt
Dunakanshon
 
Anova and T-Test
Anova and T-TestAnova and T-Test
Anova and T-Test
AD Sarwar
 
T test and types of t-test
T test and types of t-testT test and types of t-test
T test and types of t-test
Rachamalla Sai Rahul
 
Assignment 4Chapter 1010.1. In a t test for a single samp.docx
Assignment 4Chapter 1010.1. In a t test for a single samp.docxAssignment 4Chapter 1010.1. In a t test for a single samp.docx
Assignment 4Chapter 1010.1. In a t test for a single samp.docx
ssuser562afc1
 
Ttest
TtestTtest
Chapter 5 t-test
Chapter 5 t-testChapter 5 t-test
Chapter 5 t-test
Jevf Shen
 
Spss2 comparing means_two_groups
Spss2 comparing means_two_groupsSpss2 comparing means_two_groups
Spss2 comparing means_two_groups
riddhu12
 
The t Test for Two Related Samples
The t Test for Two Related SamplesThe t Test for Two Related Samples
The t Test for Two Related Samples
jasondroesch
 
Assessment 3 – Hypothesis, Effect Size, Power, and t Tests.docx
Assessment 3 – Hypothesis, Effect Size, Power, and t Tests.docxAssessment 3 – Hypothesis, Effect Size, Power, and t Tests.docx
Assessment 3 – Hypothesis, Effect Size, Power, and t Tests.docx
cargillfilberto
 
Experimental designs and data analysis in the field of Agronomy science by ma...
Experimental designs and data analysis in the field of Agronomy science by ma...Experimental designs and data analysis in the field of Agronomy science by ma...
Experimental designs and data analysis in the field of Agronomy science by ma...
Manoj Sharma
 
Inferential Statistics (Melrose High School Library)
Inferential Statistics (Melrose High School Library)Inferential Statistics (Melrose High School Library)
Inferential Statistics (Melrose High School Library)
TomScudder1
 
Day 11 t test for independent samples
Day 11 t test for independent samplesDay 11 t test for independent samples
Day 11 t test for independent samples
Elih Sutisna Yanto
 
T-Test
T-TestT-Test
WEEK 6 – EXERCISES Enter your answers in the spaces pr.docx
WEEK 6 – EXERCISES Enter your answers in the spaces pr.docxWEEK 6 – EXERCISES Enter your answers in the spaces pr.docx
WEEK 6 – EXERCISES Enter your answers in the spaces pr.docx
wendolynhalbert
 

Similar to Student T - test (20)

What is a t test
What is a t testWhat is a t test
What is a t test
 
Independent Samples t-test.pptx
Independent Samples t-test.pptxIndependent Samples t-test.pptx
Independent Samples t-test.pptx
 
t test
t testt test
t test
 
t test for statistics 1st sem mba sylabus
t test for statistics 1st sem mba sylabust test for statistics 1st sem mba sylabus
t test for statistics 1st sem mba sylabus
 
students_t_test.ppt
students_t_test.pptstudents_t_test.ppt
students_t_test.ppt
 
students_t_test.ppt
students_t_test.pptstudents_t_test.ppt
students_t_test.ppt
 
Anova and T-Test
Anova and T-TestAnova and T-Test
Anova and T-Test
 
T test and types of t-test
T test and types of t-testT test and types of t-test
T test and types of t-test
 
Assignment 4Chapter 1010.1. In a t test for a single samp.docx
Assignment 4Chapter 1010.1. In a t test for a single samp.docxAssignment 4Chapter 1010.1. In a t test for a single samp.docx
Assignment 4Chapter 1010.1. In a t test for a single samp.docx
 
Ttest
TtestTtest
Ttest
 
Chapter 5 t-test
Chapter 5 t-testChapter 5 t-test
Chapter 5 t-test
 
Spss2 comparing means_two_groups
Spss2 comparing means_two_groupsSpss2 comparing means_two_groups
Spss2 comparing means_two_groups
 
The t Test for Two Related Samples
The t Test for Two Related SamplesThe t Test for Two Related Samples
The t Test for Two Related Samples
 
Assessment 3 – Hypothesis, Effect Size, Power, and t Tests.docx
Assessment 3 – Hypothesis, Effect Size, Power, and t Tests.docxAssessment 3 – Hypothesis, Effect Size, Power, and t Tests.docx
Assessment 3 – Hypothesis, Effect Size, Power, and t Tests.docx
 
Experimental designs and data analysis in the field of Agronomy science by ma...
Experimental designs and data analysis in the field of Agronomy science by ma...Experimental designs and data analysis in the field of Agronomy science by ma...
Experimental designs and data analysis in the field of Agronomy science by ma...
 
Inferential Statistics (Melrose High School Library)
Inferential Statistics (Melrose High School Library)Inferential Statistics (Melrose High School Library)
Inferential Statistics (Melrose High School Library)
 
Day 11 t test for independent samples
Day 11 t test for independent samplesDay 11 t test for independent samples
Day 11 t test for independent samples
 
T-Test
T-TestT-Test
T-Test
 
WEEK 6 – EXERCISES Enter your answers in the spaces pr.docx
WEEK 6 – EXERCISES Enter your answers in the spaces pr.docxWEEK 6 – EXERCISES Enter your answers in the spaces pr.docx
WEEK 6 – EXERCISES Enter your answers in the spaces pr.docx
 
T test
T test T test
T test
 

More from Afra Fathima

Time management
Time managementTime management
Time management
Afra Fathima
 
Radio active labeling
Radio active labelingRadio active labeling
Radio active labeling
Afra Fathima
 
Micriobiology & Microbes
Micriobiology & MicrobesMicriobiology & Microbes
Micriobiology & Microbes
Afra Fathima
 
Identification of proteins by 2D gel
Identification of proteins by 2D gelIdentification of proteins by 2D gel
Identification of proteins by 2D gel
Afra Fathima
 
SDS PAGE
SDS PAGESDS PAGE
SDS PAGE
Afra Fathima
 
HIGH PERFORMANCE LIQUID CHROMATOGRAPHY
HIGH PERFORMANCE LIQUID CHROMATOGRAPHYHIGH PERFORMANCE LIQUID CHROMATOGRAPHY
HIGH PERFORMANCE LIQUID CHROMATOGRAPHY
Afra Fathima
 
Dialysis
DialysisDialysis
Dialysis
Afra Fathima
 
Lowry's method
Lowry's  methodLowry's  method
Lowry's method
Afra Fathima
 
Bradford's method
Bradford's methodBradford's method
Bradford's method
Afra Fathima
 
Ammonium sulphate precipitation
Ammonium sulphate precipitationAmmonium sulphate precipitation
Ammonium sulphate precipitation
Afra Fathima
 
Collection of blood, serum & plasma
Collection of blood, serum & plasmaCollection of blood, serum & plasma
Collection of blood, serum & plasma
Afra Fathima
 
Sub cellular fractionation
Sub cellular fractionationSub cellular fractionation
Sub cellular fractionation
Afra Fathima
 
Cells of the immune system
Cells of the immune systemCells of the immune system
Cells of the immune system
Afra Fathima
 
Cells of the immune system
Cells  of the immune system Cells  of the immune system
Cells of the immune system
Afra Fathima
 
Dinitro salicylic acid (DNSA) method
Dinitro salicylic acid (DNSA) methodDinitro salicylic acid (DNSA) method
Dinitro salicylic acid (DNSA) method
Afra Fathima
 
Cells of the immune system
Cells of the immune system Cells of the immune system
Cells of the immune system
Afra Fathima
 
Cells of the immune system
Cells  of the immune system Cells  of the immune system
Cells of the immune system
Afra Fathima
 
Cells of the immune system
Cells  of the immune system Cells  of the immune system
Cells of the immune system
Afra Fathima
 
Cells of the immune system
Cells  of the immune systemCells  of the immune system
Cells of the immune system
Afra Fathima
 
Sulphadiazine
SulphadiazineSulphadiazine
Sulphadiazine
Afra Fathima
 

More from Afra Fathima (20)

Time management
Time managementTime management
Time management
 
Radio active labeling
Radio active labelingRadio active labeling
Radio active labeling
 
Micriobiology & Microbes
Micriobiology & MicrobesMicriobiology & Microbes
Micriobiology & Microbes
 
Identification of proteins by 2D gel
Identification of proteins by 2D gelIdentification of proteins by 2D gel
Identification of proteins by 2D gel
 
SDS PAGE
SDS PAGESDS PAGE
SDS PAGE
 
HIGH PERFORMANCE LIQUID CHROMATOGRAPHY
HIGH PERFORMANCE LIQUID CHROMATOGRAPHYHIGH PERFORMANCE LIQUID CHROMATOGRAPHY
HIGH PERFORMANCE LIQUID CHROMATOGRAPHY
 
Dialysis
DialysisDialysis
Dialysis
 
Lowry's method
Lowry's  methodLowry's  method
Lowry's method
 
Bradford's method
Bradford's methodBradford's method
Bradford's method
 
Ammonium sulphate precipitation
Ammonium sulphate precipitationAmmonium sulphate precipitation
Ammonium sulphate precipitation
 
Collection of blood, serum & plasma
Collection of blood, serum & plasmaCollection of blood, serum & plasma
Collection of blood, serum & plasma
 
Sub cellular fractionation
Sub cellular fractionationSub cellular fractionation
Sub cellular fractionation
 
Cells of the immune system
Cells of the immune systemCells of the immune system
Cells of the immune system
 
Cells of the immune system
Cells  of the immune system Cells  of the immune system
Cells of the immune system
 
Dinitro salicylic acid (DNSA) method
Dinitro salicylic acid (DNSA) methodDinitro salicylic acid (DNSA) method
Dinitro salicylic acid (DNSA) method
 
Cells of the immune system
Cells of the immune system Cells of the immune system
Cells of the immune system
 
Cells of the immune system
Cells  of the immune system Cells  of the immune system
Cells of the immune system
 
Cells of the immune system
Cells  of the immune system Cells  of the immune system
Cells of the immune system
 
Cells of the immune system
Cells  of the immune systemCells  of the immune system
Cells of the immune system
 
Sulphadiazine
SulphadiazineSulphadiazine
Sulphadiazine
 

Recently uploaded

SOCRadar Germany 2024 Threat Landscape Report
SOCRadar Germany 2024 Threat Landscape ReportSOCRadar Germany 2024 Threat Landscape Report
SOCRadar Germany 2024 Threat Landscape Report
SOCRadar
 
Jpolillo Amazon PPC - Bid Optimization Sample
Jpolillo Amazon PPC - Bid Optimization SampleJpolillo Amazon PPC - Bid Optimization Sample
Jpolillo Amazon PPC - Bid Optimization Sample
James Polillo
 
Q1’2024 Update: MYCI’s Leap Year Rebound
Q1’2024 Update: MYCI’s Leap Year ReboundQ1’2024 Update: MYCI’s Leap Year Rebound
Q1’2024 Update: MYCI’s Leap Year Rebound
Oppotus
 
Sample_Global Non-invasive Prenatal Testing (NIPT) Market, 2019-2030.pdf
Sample_Global Non-invasive Prenatal Testing (NIPT) Market, 2019-2030.pdfSample_Global Non-invasive Prenatal Testing (NIPT) Market, 2019-2030.pdf
Sample_Global Non-invasive Prenatal Testing (NIPT) Market, 2019-2030.pdf
Linda486226
 
一比一原版(UPenn毕业证)宾夕法尼亚大学毕业证成绩单
一比一原版(UPenn毕业证)宾夕法尼亚大学毕业证成绩单一比一原版(UPenn毕业证)宾夕法尼亚大学毕业证成绩单
一比一原版(UPenn毕业证)宾夕法尼亚大学毕业证成绩单
ewymefz
 
Levelwise PageRank with Loop-Based Dead End Handling Strategy : SHORT REPORT ...
Levelwise PageRank with Loop-Based Dead End Handling Strategy : SHORT REPORT ...Levelwise PageRank with Loop-Based Dead End Handling Strategy : SHORT REPORT ...
Levelwise PageRank with Loop-Based Dead End Handling Strategy : SHORT REPORT ...
Subhajit Sahu
 
一比一原版(IIT毕业证)伊利诺伊理工大学毕业证成绩单
一比一原版(IIT毕业证)伊利诺伊理工大学毕业证成绩单一比一原版(IIT毕业证)伊利诺伊理工大学毕业证成绩单
一比一原版(IIT毕业证)伊利诺伊理工大学毕业证成绩单
ewymefz
 
Innovative Methods in Media and Communication Research by Sebastian Kubitschk...
Innovative Methods in Media and Communication Research by Sebastian Kubitschk...Innovative Methods in Media and Communication Research by Sebastian Kubitschk...
Innovative Methods in Media and Communication Research by Sebastian Kubitschk...
correoyaya
 
一比一原版(RUG毕业证)格罗宁根大学毕业证成绩单
一比一原版(RUG毕业证)格罗宁根大学毕业证成绩单一比一原版(RUG毕业证)格罗宁根大学毕业证成绩单
一比一原版(RUG毕业证)格罗宁根大学毕业证成绩单
vcaxypu
 
The affect of service quality and online reviews on customer loyalty in the E...
The affect of service quality and online reviews on customer loyalty in the E...The affect of service quality and online reviews on customer loyalty in the E...
The affect of service quality and online reviews on customer loyalty in the E...
jerlynmaetalle
 
Opendatabay - Open Data Marketplace.pptx
Opendatabay - Open Data Marketplace.pptxOpendatabay - Open Data Marketplace.pptx
Opendatabay - Open Data Marketplace.pptx
Opendatabay
 
一比一原版(UVic毕业证)维多利亚大学毕业证成绩单
一比一原版(UVic毕业证)维多利亚大学毕业证成绩单一比一原版(UVic毕业证)维多利亚大学毕业证成绩单
一比一原版(UVic毕业证)维多利亚大学毕业证成绩单
ukgaet
 
Tabula.io Cheatsheet: automate your data workflows
Tabula.io Cheatsheet: automate your data workflowsTabula.io Cheatsheet: automate your data workflows
Tabula.io Cheatsheet: automate your data workflows
alex933524
 
做(mqu毕业证书)麦考瑞大学毕业证硕士文凭证书学费发票原版一模一样
做(mqu毕业证书)麦考瑞大学毕业证硕士文凭证书学费发票原版一模一样做(mqu毕业证书)麦考瑞大学毕业证硕士文凭证书学费发票原版一模一样
做(mqu毕业证书)麦考瑞大学毕业证硕士文凭证书学费发票原版一模一样
axoqas
 
一比一原版(NYU毕业证)纽约大学毕业证成绩单
一比一原版(NYU毕业证)纽约大学毕业证成绩单一比一原版(NYU毕业证)纽约大学毕业证成绩单
一比一原版(NYU毕业证)纽约大学毕业证成绩单
ewymefz
 
Malana- Gimlet Market Analysis (Portfolio 2)
Malana- Gimlet Market Analysis (Portfolio 2)Malana- Gimlet Market Analysis (Portfolio 2)
Malana- Gimlet Market Analysis (Portfolio 2)
TravisMalana
 
一比一原版(UofM毕业证)明尼苏达大学毕业证成绩单
一比一原版(UofM毕业证)明尼苏达大学毕业证成绩单一比一原版(UofM毕业证)明尼苏达大学毕业证成绩单
一比一原版(UofM毕业证)明尼苏达大学毕业证成绩单
ewymefz
 
一比一原版(CBU毕业证)不列颠海角大学毕业证成绩单
一比一原版(CBU毕业证)不列颠海角大学毕业证成绩单一比一原版(CBU毕业证)不列颠海角大学毕业证成绩单
一比一原版(CBU毕业证)不列颠海角大学毕业证成绩单
nscud
 
Adjusting primitives for graph : SHORT REPORT / NOTES
Adjusting primitives for graph : SHORT REPORT / NOTESAdjusting primitives for graph : SHORT REPORT / NOTES
Adjusting primitives for graph : SHORT REPORT / NOTES
Subhajit Sahu
 
tapal brand analysis PPT slide for comptetive data
tapal brand analysis PPT slide for comptetive datatapal brand analysis PPT slide for comptetive data
tapal brand analysis PPT slide for comptetive data
theahmadsaood
 

Recently uploaded (20)

SOCRadar Germany 2024 Threat Landscape Report
SOCRadar Germany 2024 Threat Landscape ReportSOCRadar Germany 2024 Threat Landscape Report
SOCRadar Germany 2024 Threat Landscape Report
 
Jpolillo Amazon PPC - Bid Optimization Sample
Jpolillo Amazon PPC - Bid Optimization SampleJpolillo Amazon PPC - Bid Optimization Sample
Jpolillo Amazon PPC - Bid Optimization Sample
 
Q1’2024 Update: MYCI’s Leap Year Rebound
Q1’2024 Update: MYCI’s Leap Year ReboundQ1’2024 Update: MYCI’s Leap Year Rebound
Q1’2024 Update: MYCI’s Leap Year Rebound
 
Sample_Global Non-invasive Prenatal Testing (NIPT) Market, 2019-2030.pdf
Sample_Global Non-invasive Prenatal Testing (NIPT) Market, 2019-2030.pdfSample_Global Non-invasive Prenatal Testing (NIPT) Market, 2019-2030.pdf
Sample_Global Non-invasive Prenatal Testing (NIPT) Market, 2019-2030.pdf
 
一比一原版(UPenn毕业证)宾夕法尼亚大学毕业证成绩单
一比一原版(UPenn毕业证)宾夕法尼亚大学毕业证成绩单一比一原版(UPenn毕业证)宾夕法尼亚大学毕业证成绩单
一比一原版(UPenn毕业证)宾夕法尼亚大学毕业证成绩单
 
Levelwise PageRank with Loop-Based Dead End Handling Strategy : SHORT REPORT ...
Levelwise PageRank with Loop-Based Dead End Handling Strategy : SHORT REPORT ...Levelwise PageRank with Loop-Based Dead End Handling Strategy : SHORT REPORT ...
Levelwise PageRank with Loop-Based Dead End Handling Strategy : SHORT REPORT ...
 
一比一原版(IIT毕业证)伊利诺伊理工大学毕业证成绩单
一比一原版(IIT毕业证)伊利诺伊理工大学毕业证成绩单一比一原版(IIT毕业证)伊利诺伊理工大学毕业证成绩单
一比一原版(IIT毕业证)伊利诺伊理工大学毕业证成绩单
 
Innovative Methods in Media and Communication Research by Sebastian Kubitschk...
Innovative Methods in Media and Communication Research by Sebastian Kubitschk...Innovative Methods in Media and Communication Research by Sebastian Kubitschk...
Innovative Methods in Media and Communication Research by Sebastian Kubitschk...
 
一比一原版(RUG毕业证)格罗宁根大学毕业证成绩单
一比一原版(RUG毕业证)格罗宁根大学毕业证成绩单一比一原版(RUG毕业证)格罗宁根大学毕业证成绩单
一比一原版(RUG毕业证)格罗宁根大学毕业证成绩单
 
The affect of service quality and online reviews on customer loyalty in the E...
The affect of service quality and online reviews on customer loyalty in the E...The affect of service quality and online reviews on customer loyalty in the E...
The affect of service quality and online reviews on customer loyalty in the E...
 
Opendatabay - Open Data Marketplace.pptx
Opendatabay - Open Data Marketplace.pptxOpendatabay - Open Data Marketplace.pptx
Opendatabay - Open Data Marketplace.pptx
 
一比一原版(UVic毕业证)维多利亚大学毕业证成绩单
一比一原版(UVic毕业证)维多利亚大学毕业证成绩单一比一原版(UVic毕业证)维多利亚大学毕业证成绩单
一比一原版(UVic毕业证)维多利亚大学毕业证成绩单
 
Tabula.io Cheatsheet: automate your data workflows
Tabula.io Cheatsheet: automate your data workflowsTabula.io Cheatsheet: automate your data workflows
Tabula.io Cheatsheet: automate your data workflows
 
做(mqu毕业证书)麦考瑞大学毕业证硕士文凭证书学费发票原版一模一样
做(mqu毕业证书)麦考瑞大学毕业证硕士文凭证书学费发票原版一模一样做(mqu毕业证书)麦考瑞大学毕业证硕士文凭证书学费发票原版一模一样
做(mqu毕业证书)麦考瑞大学毕业证硕士文凭证书学费发票原版一模一样
 
一比一原版(NYU毕业证)纽约大学毕业证成绩单
一比一原版(NYU毕业证)纽约大学毕业证成绩单一比一原版(NYU毕业证)纽约大学毕业证成绩单
一比一原版(NYU毕业证)纽约大学毕业证成绩单
 
Malana- Gimlet Market Analysis (Portfolio 2)
Malana- Gimlet Market Analysis (Portfolio 2)Malana- Gimlet Market Analysis (Portfolio 2)
Malana- Gimlet Market Analysis (Portfolio 2)
 
一比一原版(UofM毕业证)明尼苏达大学毕业证成绩单
一比一原版(UofM毕业证)明尼苏达大学毕业证成绩单一比一原版(UofM毕业证)明尼苏达大学毕业证成绩单
一比一原版(UofM毕业证)明尼苏达大学毕业证成绩单
 
一比一原版(CBU毕业证)不列颠海角大学毕业证成绩单
一比一原版(CBU毕业证)不列颠海角大学毕业证成绩单一比一原版(CBU毕业证)不列颠海角大学毕业证成绩单
一比一原版(CBU毕业证)不列颠海角大学毕业证成绩单
 
Adjusting primitives for graph : SHORT REPORT / NOTES
Adjusting primitives for graph : SHORT REPORT / NOTESAdjusting primitives for graph : SHORT REPORT / NOTES
Adjusting primitives for graph : SHORT REPORT / NOTES
 
tapal brand analysis PPT slide for comptetive data
tapal brand analysis PPT slide for comptetive datatapal brand analysis PPT slide for comptetive data
tapal brand analysis PPT slide for comptetive data
 

Student T - test

  • 1. STUDENT T - TEST
  • 2. The t-test is a way to determine whether two numbers are significantly different from one another. There are several types of t-test, and each is calculated using a different formula.
  • 3. THE THREE MOST COMMON TYPES OF T-TEST 1. One-sample t-test: This test looks at whether the mean (aka average) of data from one group (in this case the overall NPS) is different from a value you specify. Example: Your company’s goal is to have an NPS that’s significantly higher than the industry standard of 5. Your company’s latest survey puts its NPS at 10. Is an NPS of 10 significantly higher than the industry standard of 5? 2. Two-sample t-test: This test examines whether the means of two independent groups are significantly different from one another. Example: Your hypothesis is that men give your company a lower NPS than women. The average NPS from male respondents is 9, while the average score from women is 12. Is 9 significantly different from 12? 3. Paired t-test: This test is for when you give one group of people the same survey twice. A paired t-test lets you know if the mean changed between the first and second survey. Example: You surveyed the same group of customers twice: once in April and a second time in May, after they had seen an ad for your company. Did your company’s NPS change after customers saw the ad?
  • 4. HOW TO CONDUCT A T-TEST 1. Calculate the t-statistic: Each type of t-test has a different formula for calculating the t-statistic (You can scroll to the bottom of the page to find all three formulas). 2. Calculate the degrees of freedom: Degrees of freedom are the number of ways the mean could vary. In this case, the degrees of freedom are the number of NPS ratings that you could have in a given group of respondents. Similar to the t-statistic, the formula for degrees of freedom will vary depending on the type of t-test you perform. 3. Determine the critical value: The critical value is the threshold at which the difference between two numbers is considered to be statistically significant. 4. Compare absolute value of the t-statistic to critical value: If your t-statistic is larger than your critical value, your difference is significant. If your t- statistic is smaller, then your two numbers are, statistically speaking, indistinguishable.
  • 5. CALCULATE T-STATISTIC Below is the formula for the two-sample t-test, where: t is the t-statistic x1 is the average NPS for men → 9 x2 is the average for women → 12 n1 is the number of men who provided a response to the NPS question → say 20 men responded to the survey n2 is the number of women → 23 women responded s1 is the standard deviation of the NPS for men → say the calculated standard deviation is 12.48 s2 is the standard deviation of the NPS for women → the calculated standard deviation is 10.51
  • 6.
  • 7. CALCULATE THE DEGREES OF FREEDOM This formula must be used to determine degrees of freedom in two-sample t-tests. The formulas for other types of test are included below.
  • 8. DETERMINE CRITICAL VALUE According to this table, for a two-tailed test with an alpha level of 0.05 at 41 degrees of freedom, the critical value is 2.02. Note that most analysts use a two-tailed test instead of a one-tailed test because it’s more conservative.
  • 9. COMPARE ABSOLUTE VALUE OF THE T-STATISTIC TO CRITICAL VALUE: Since the absolute value of the t-statistic is 0.86, which is not larger than the critical value of 2.02, then you can conclude that men do not give a significantly lower NPS ratings than women.