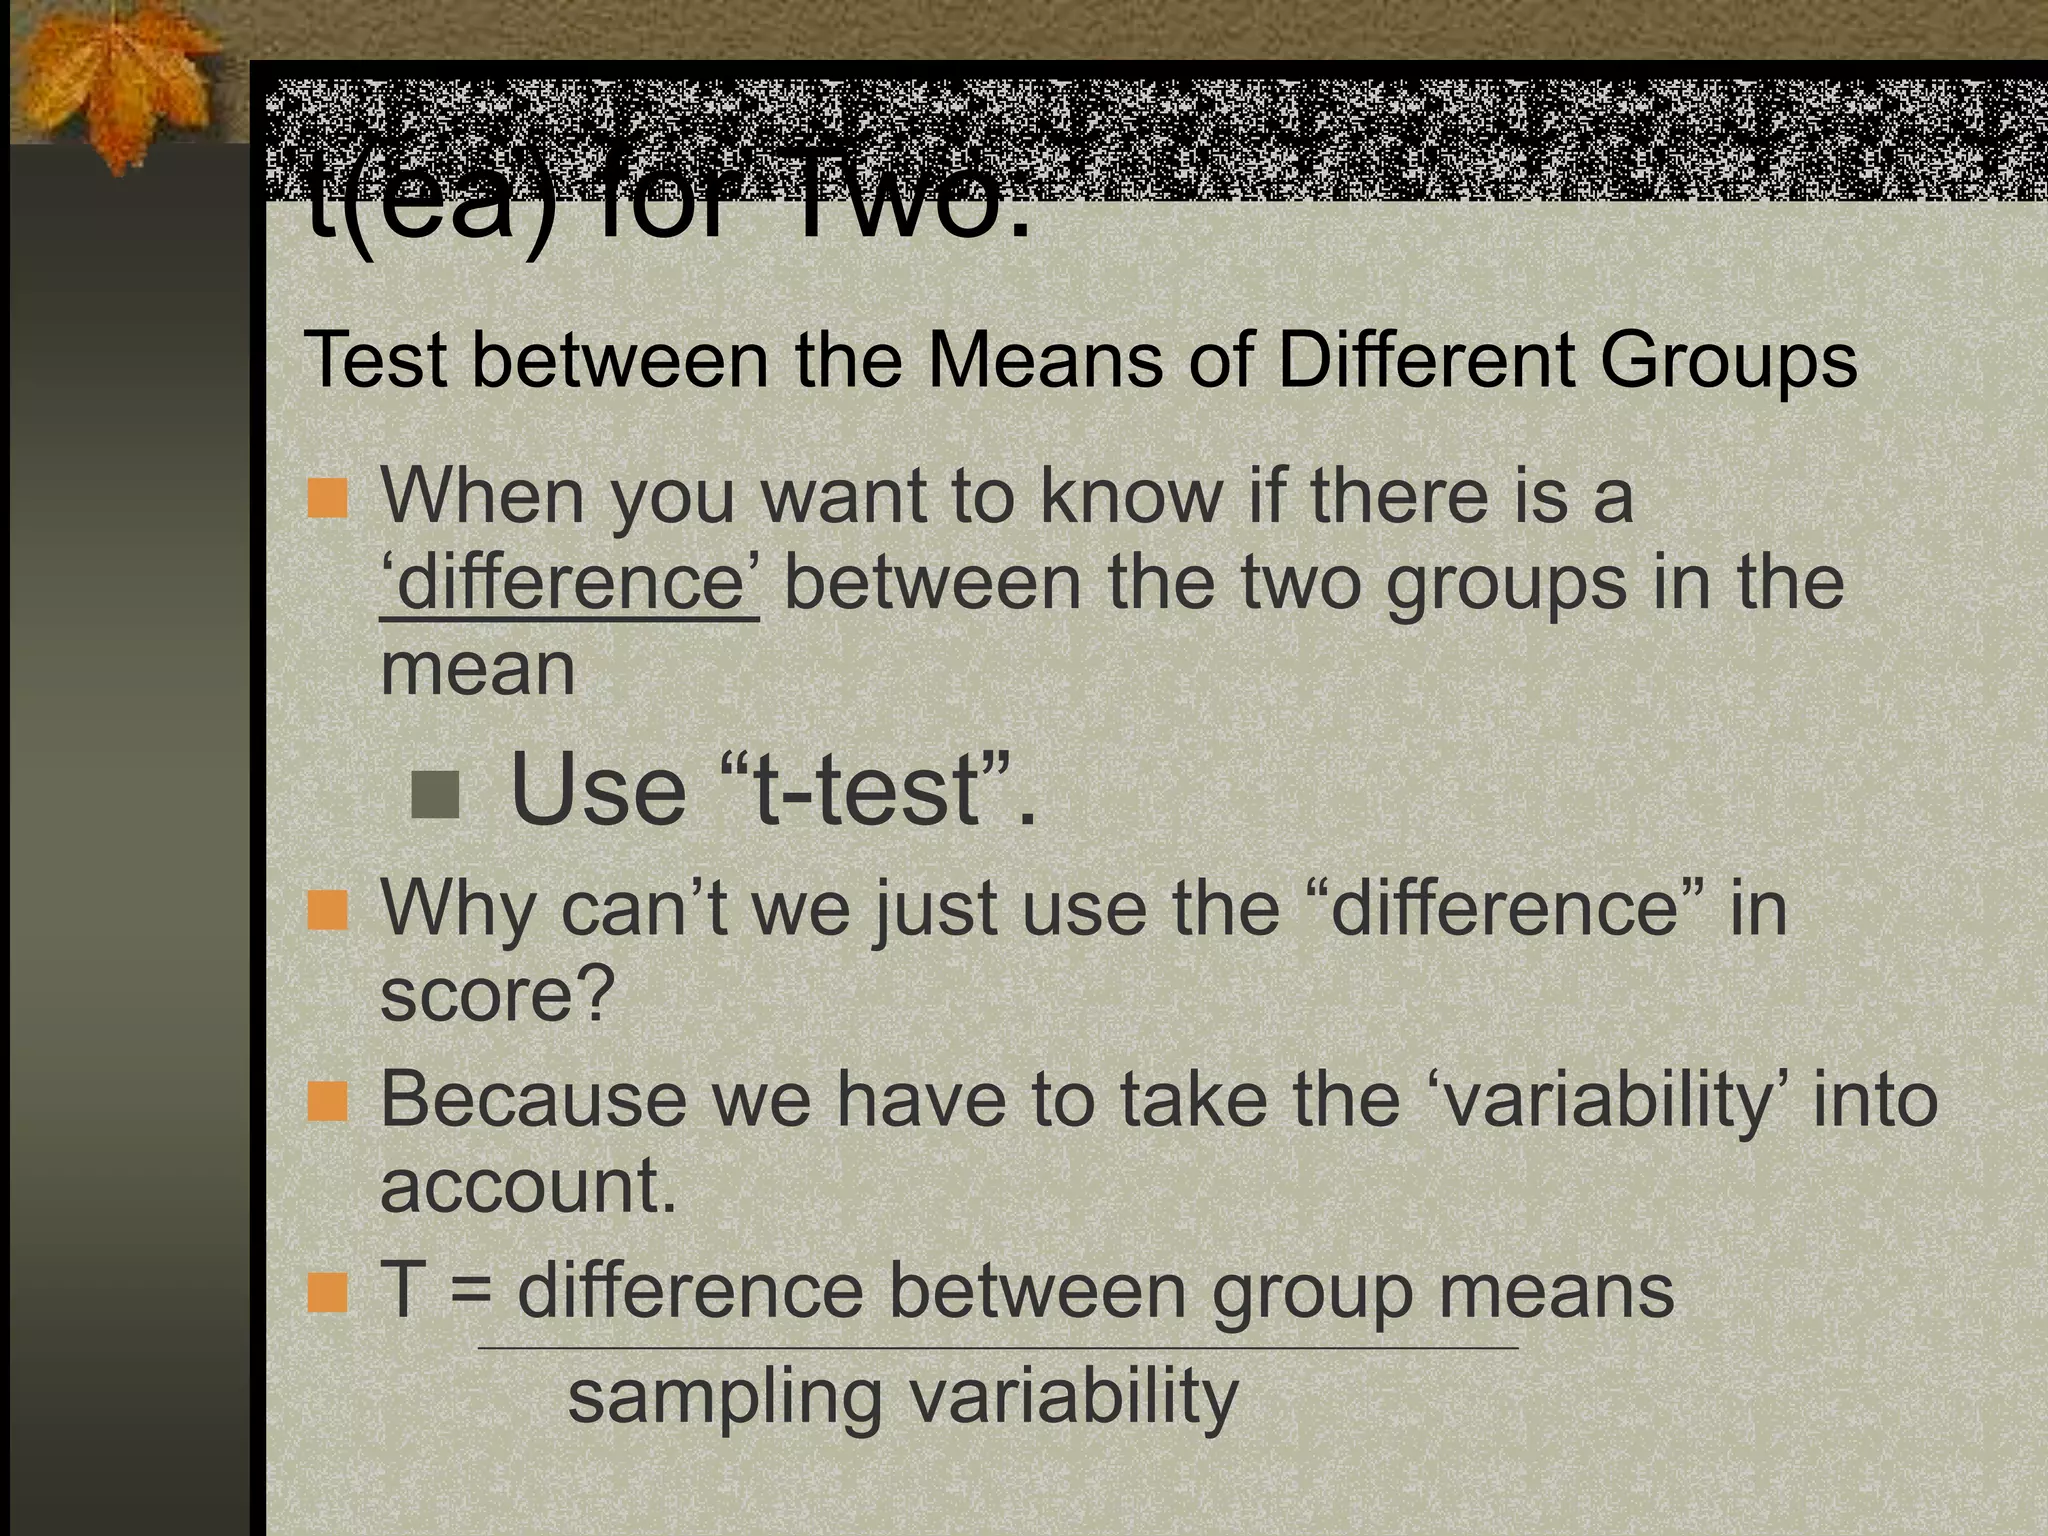
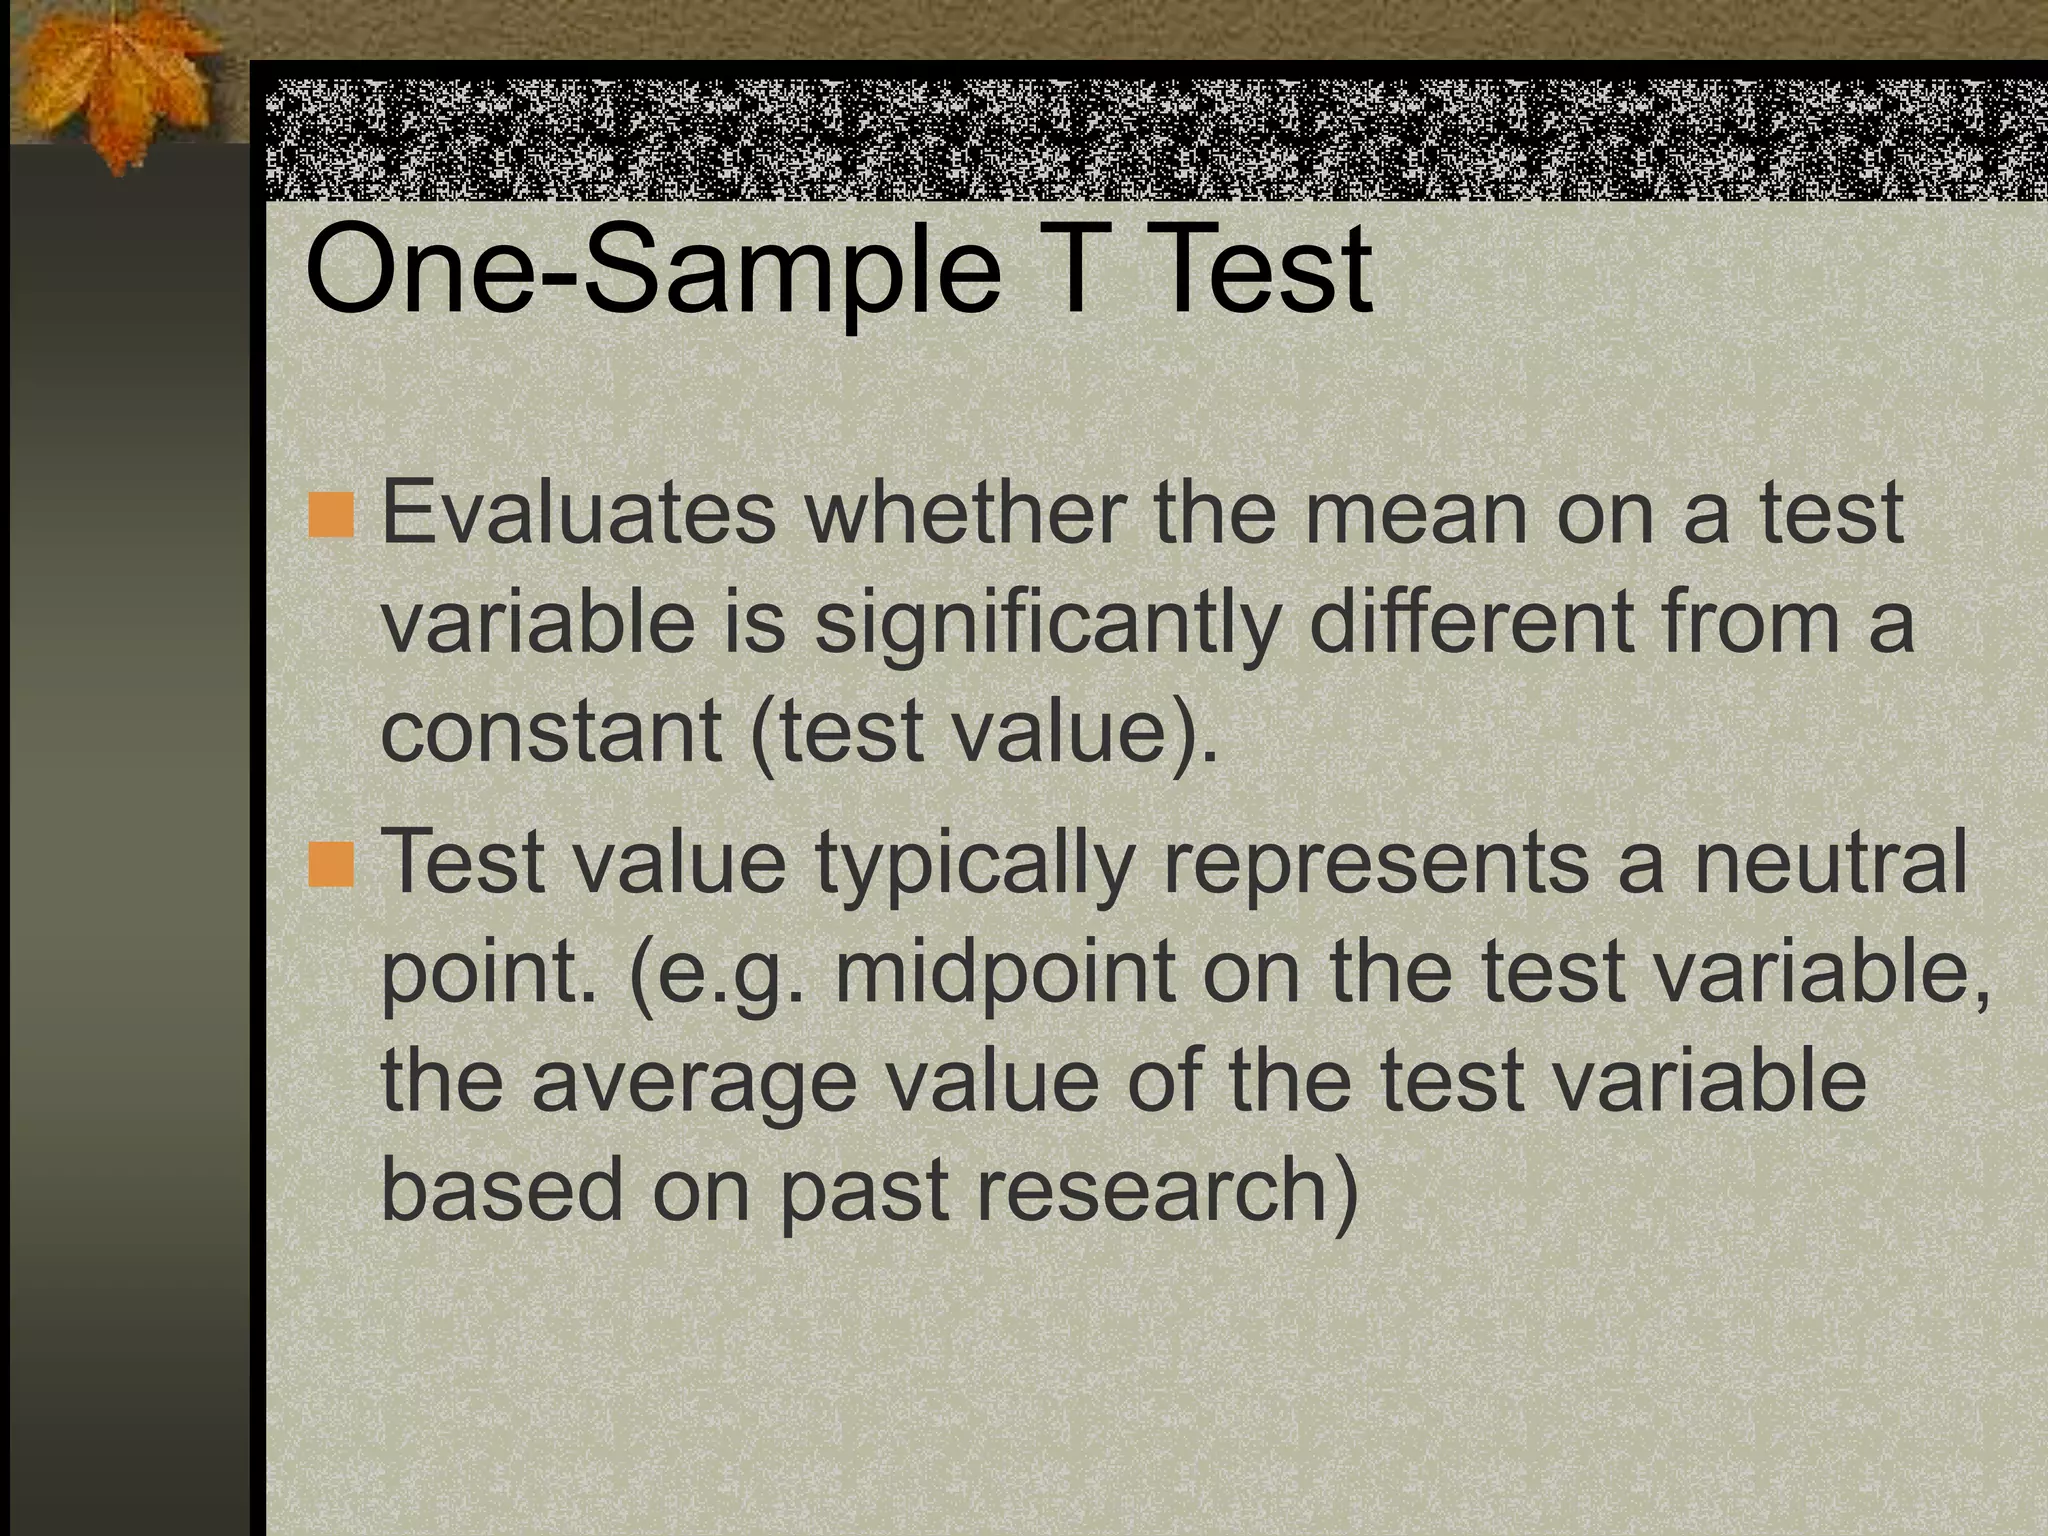
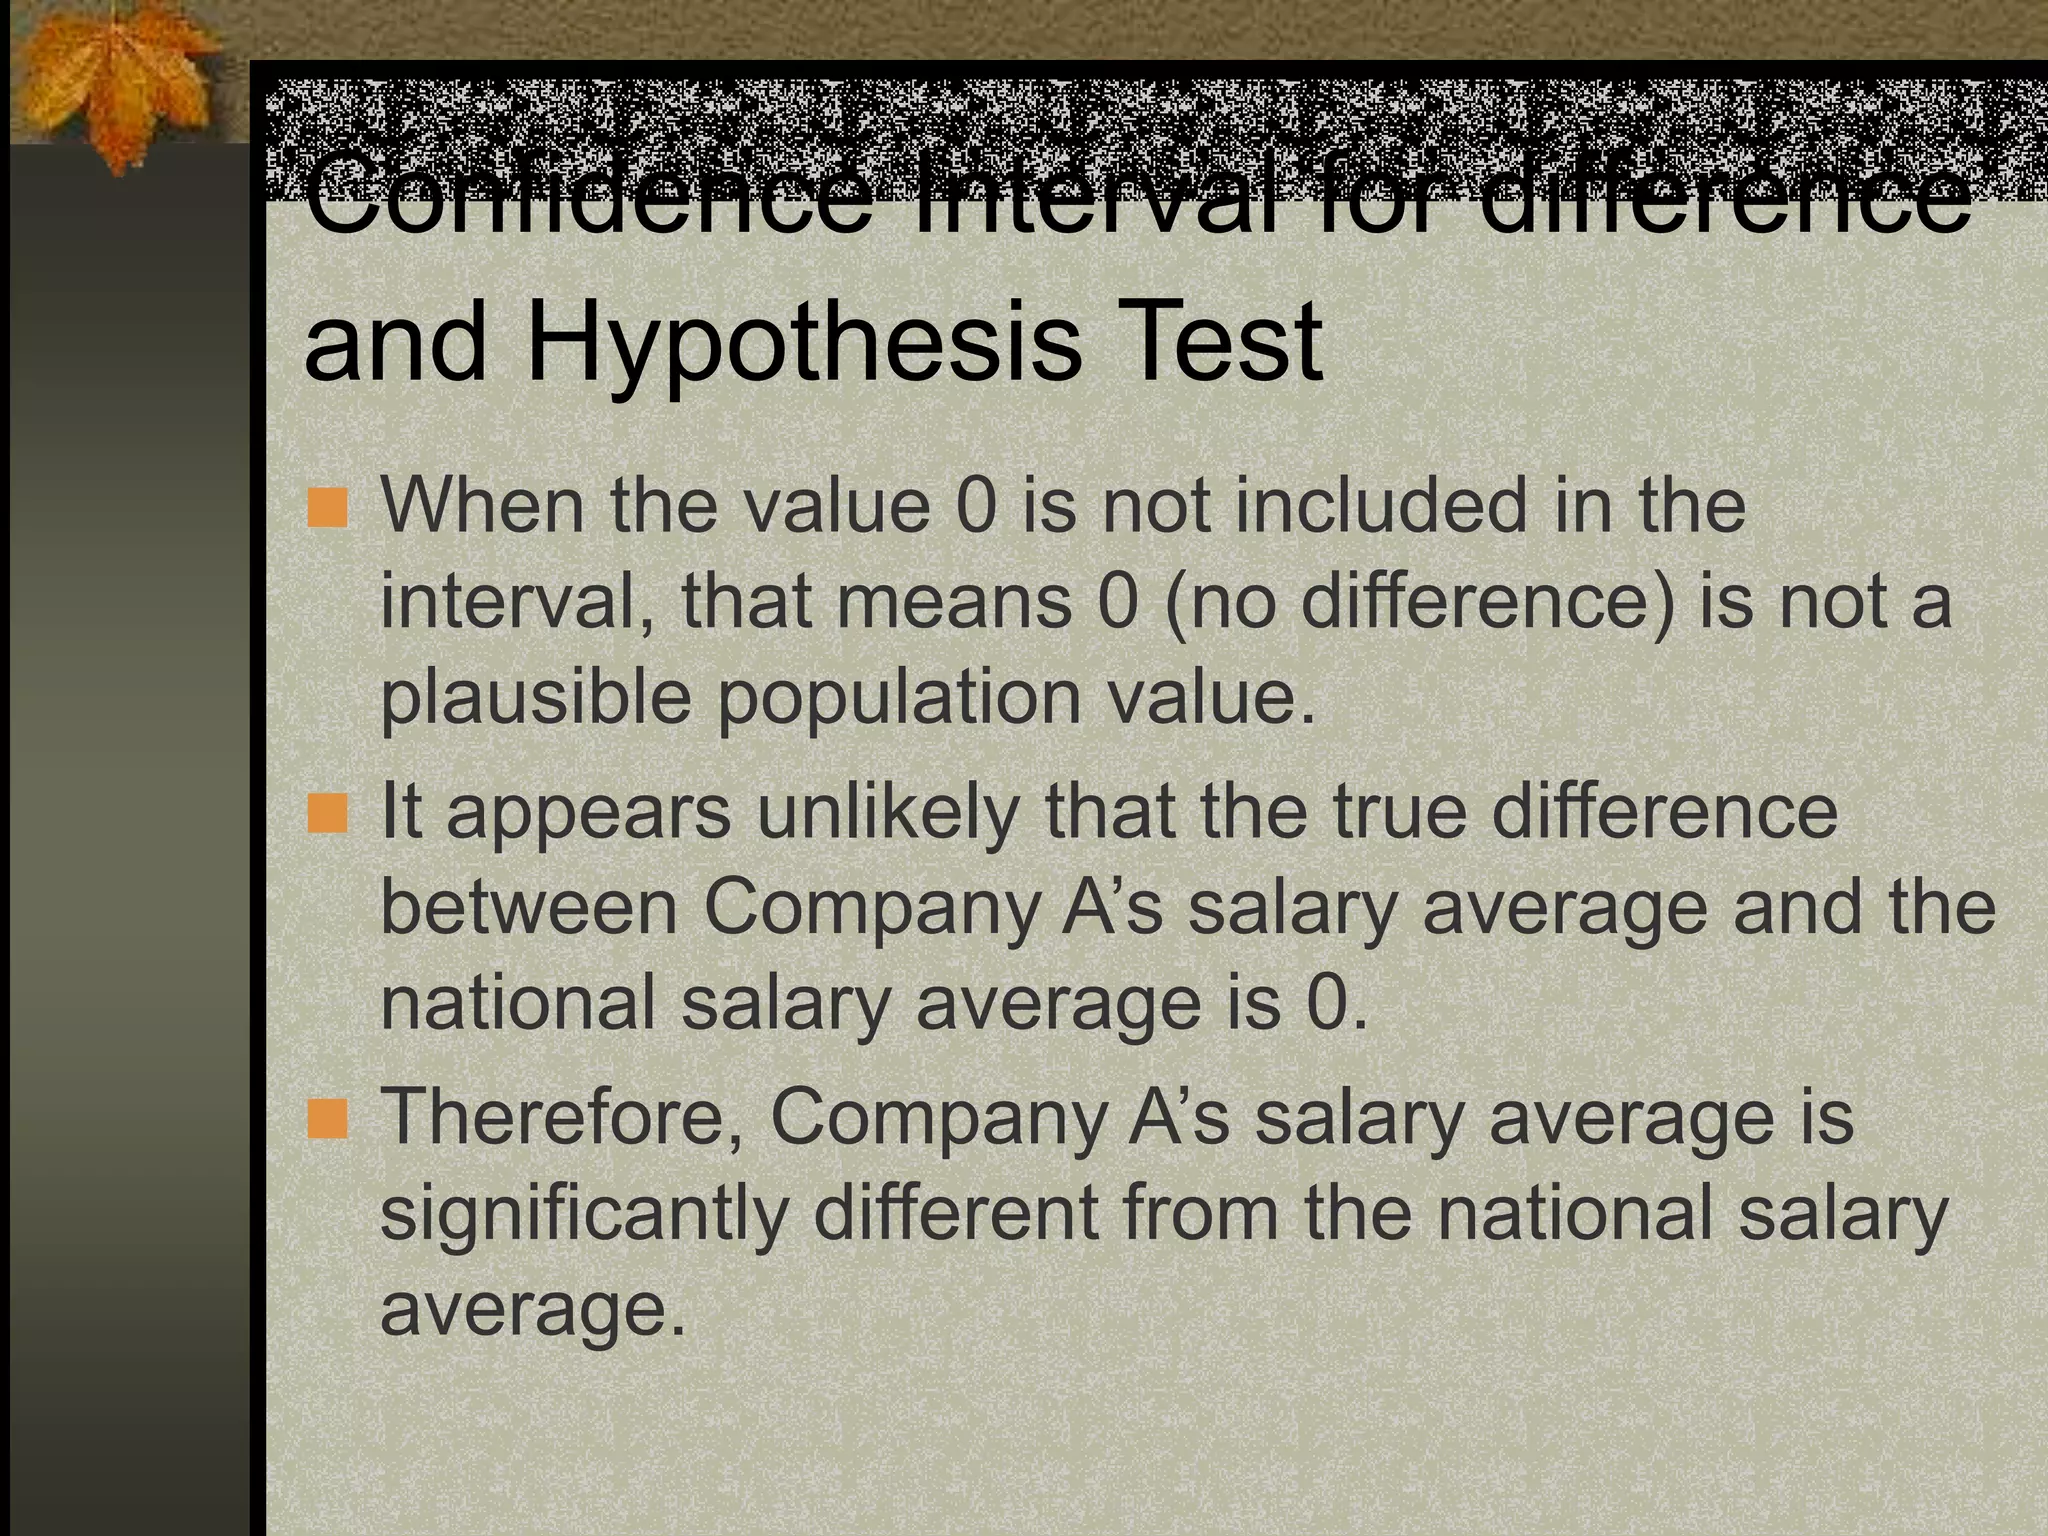
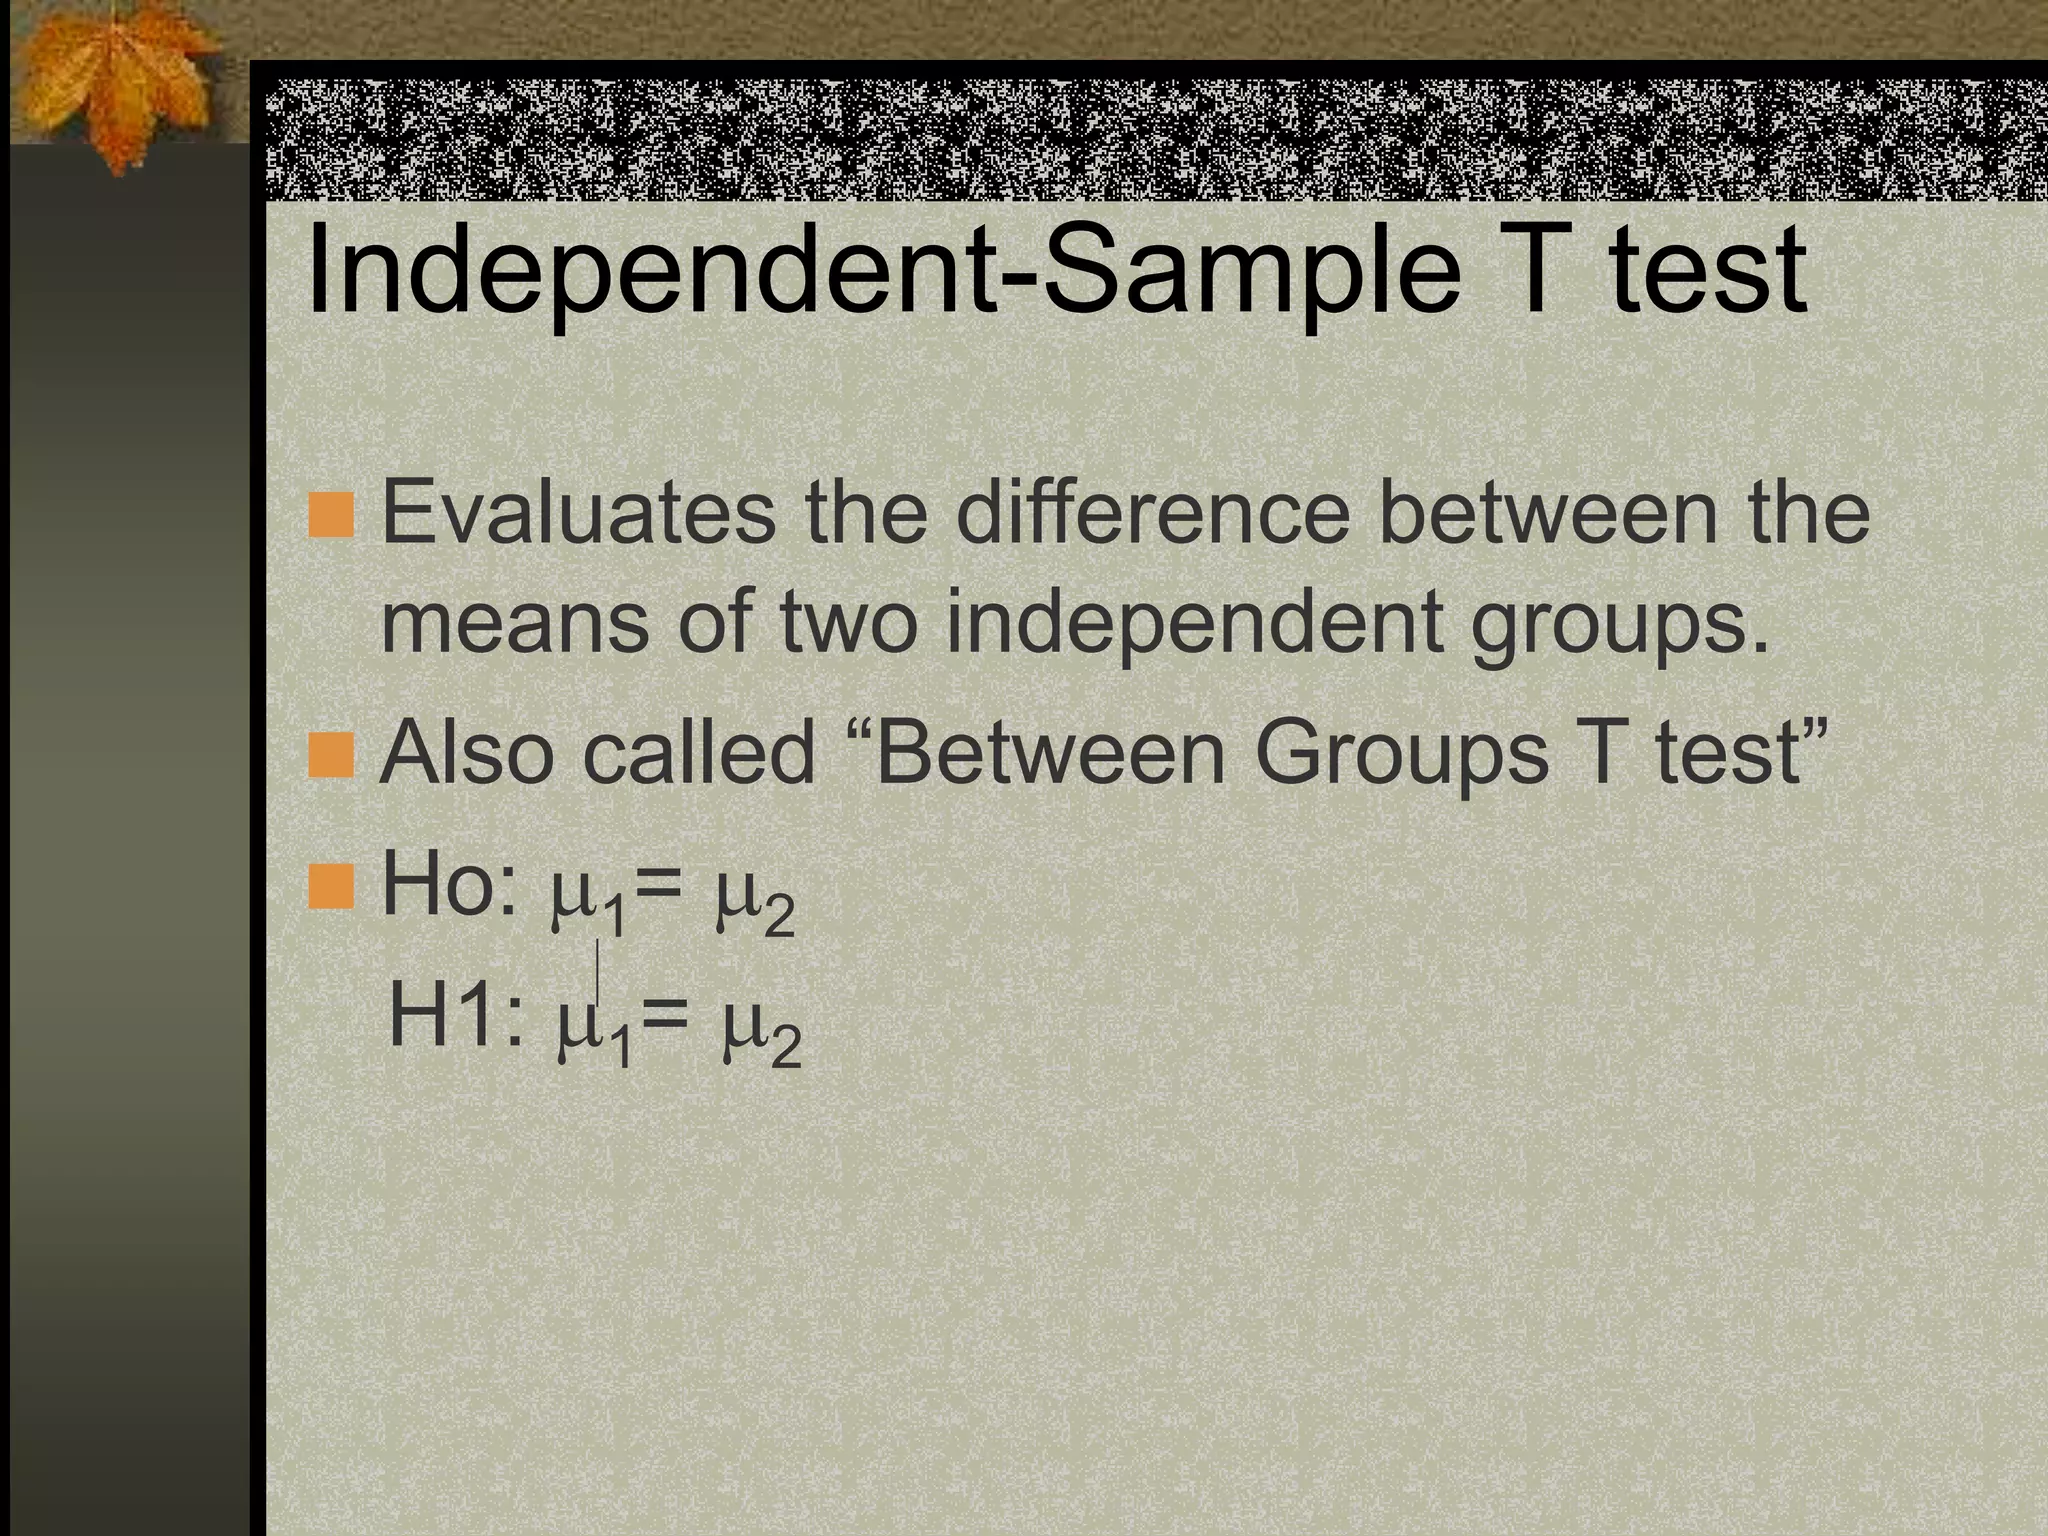
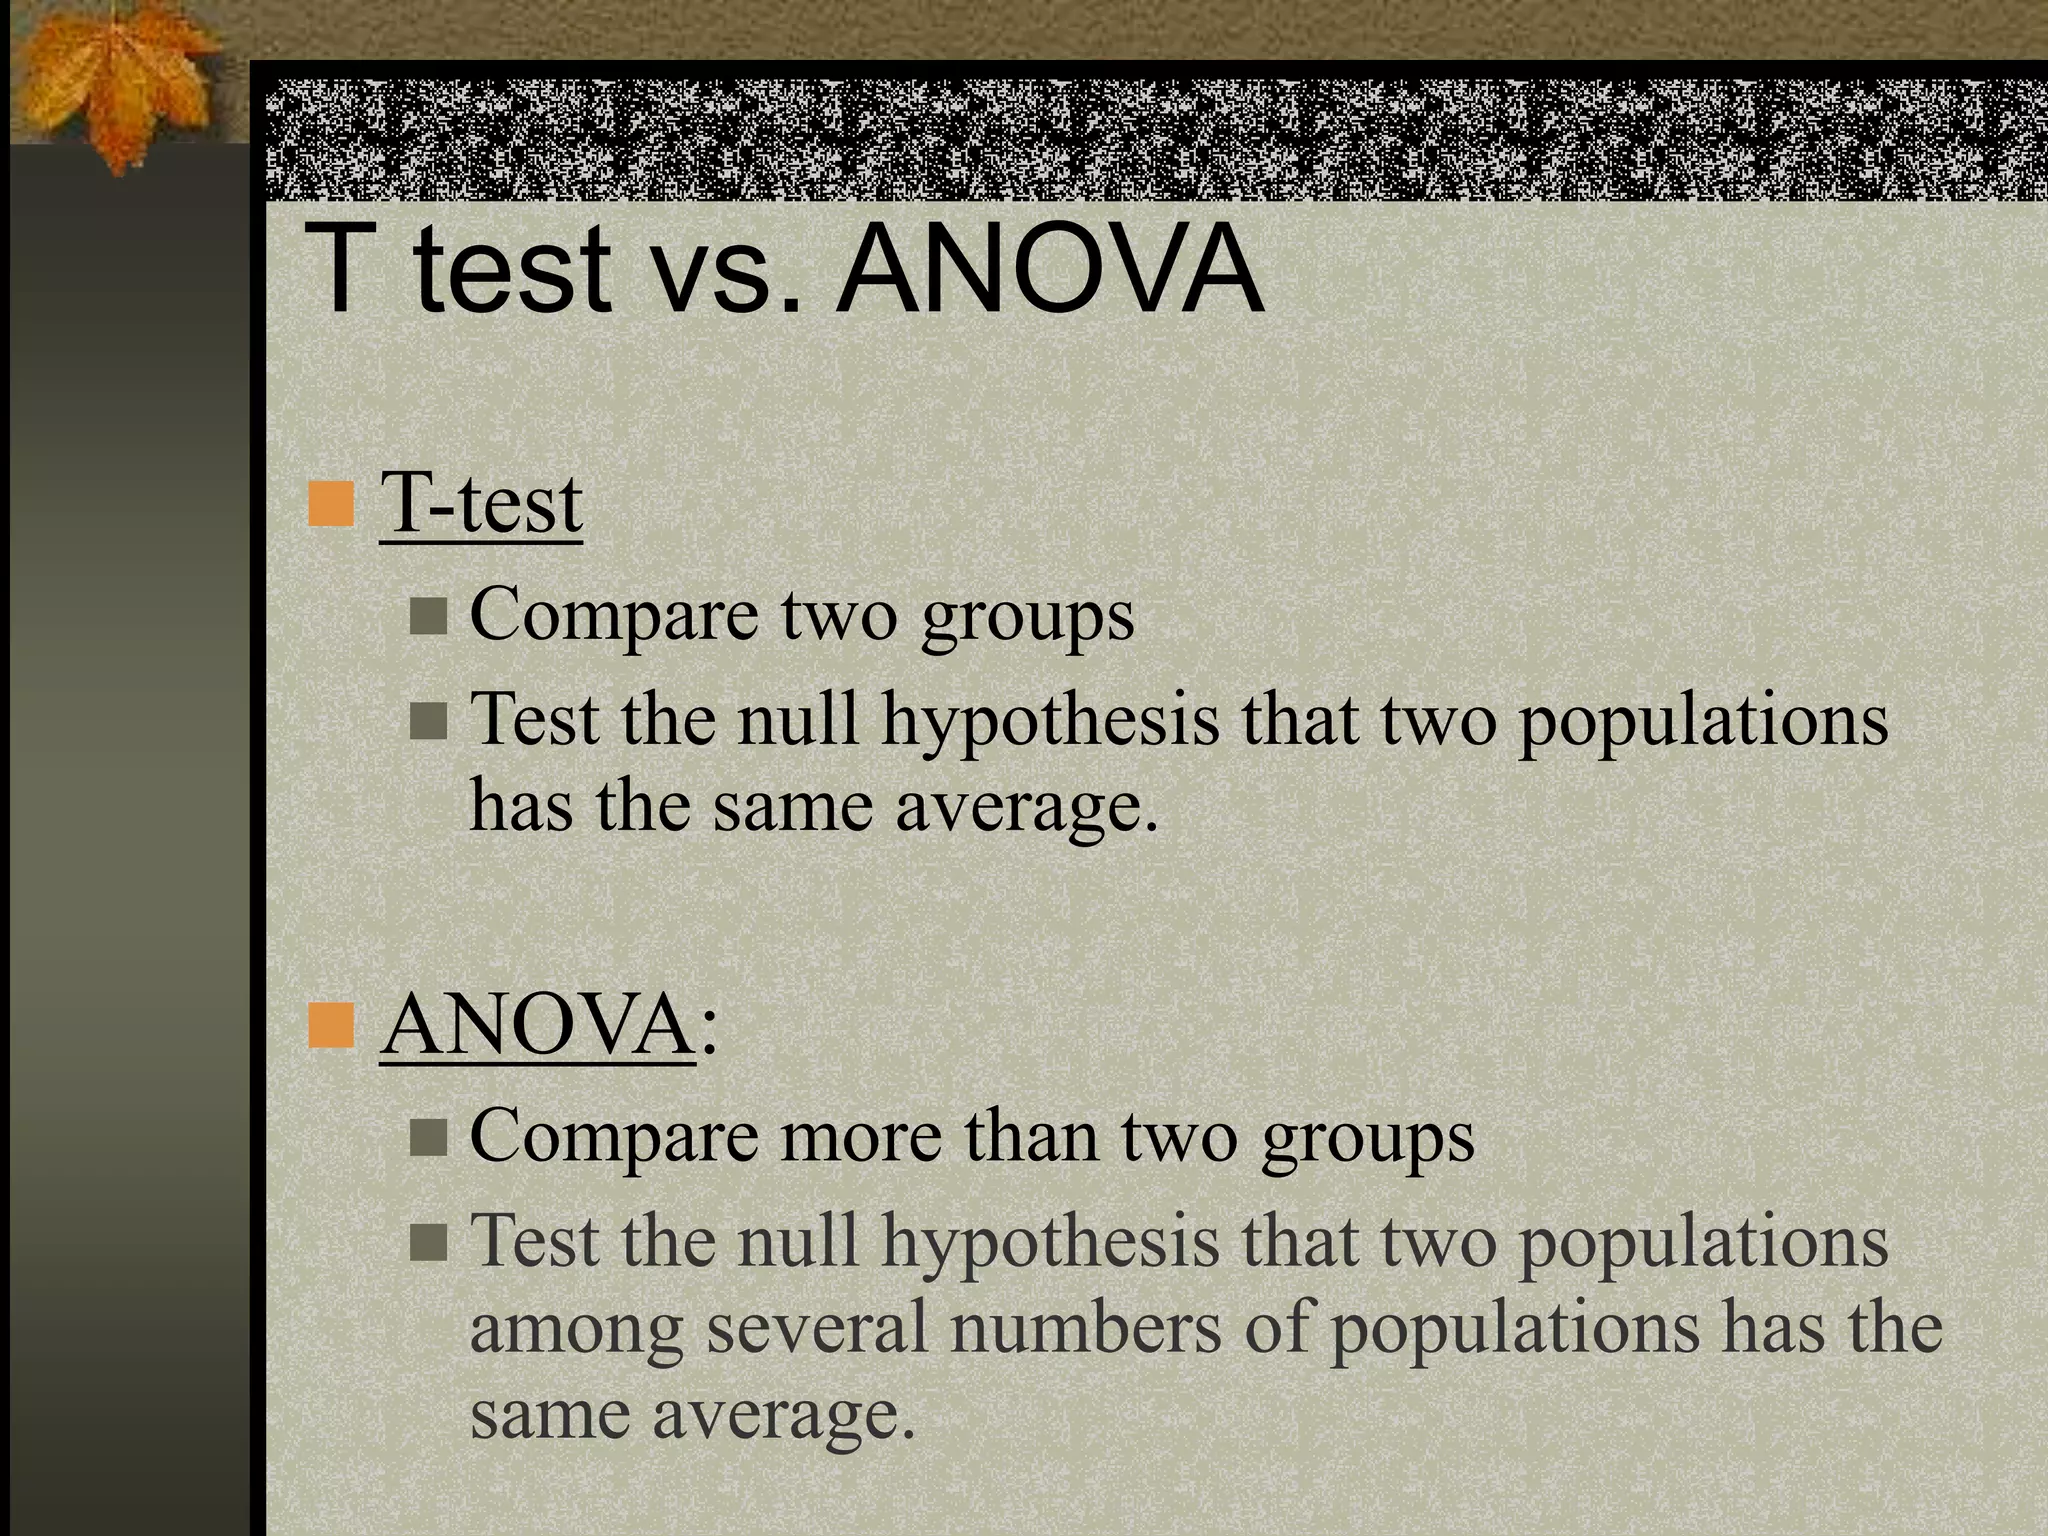
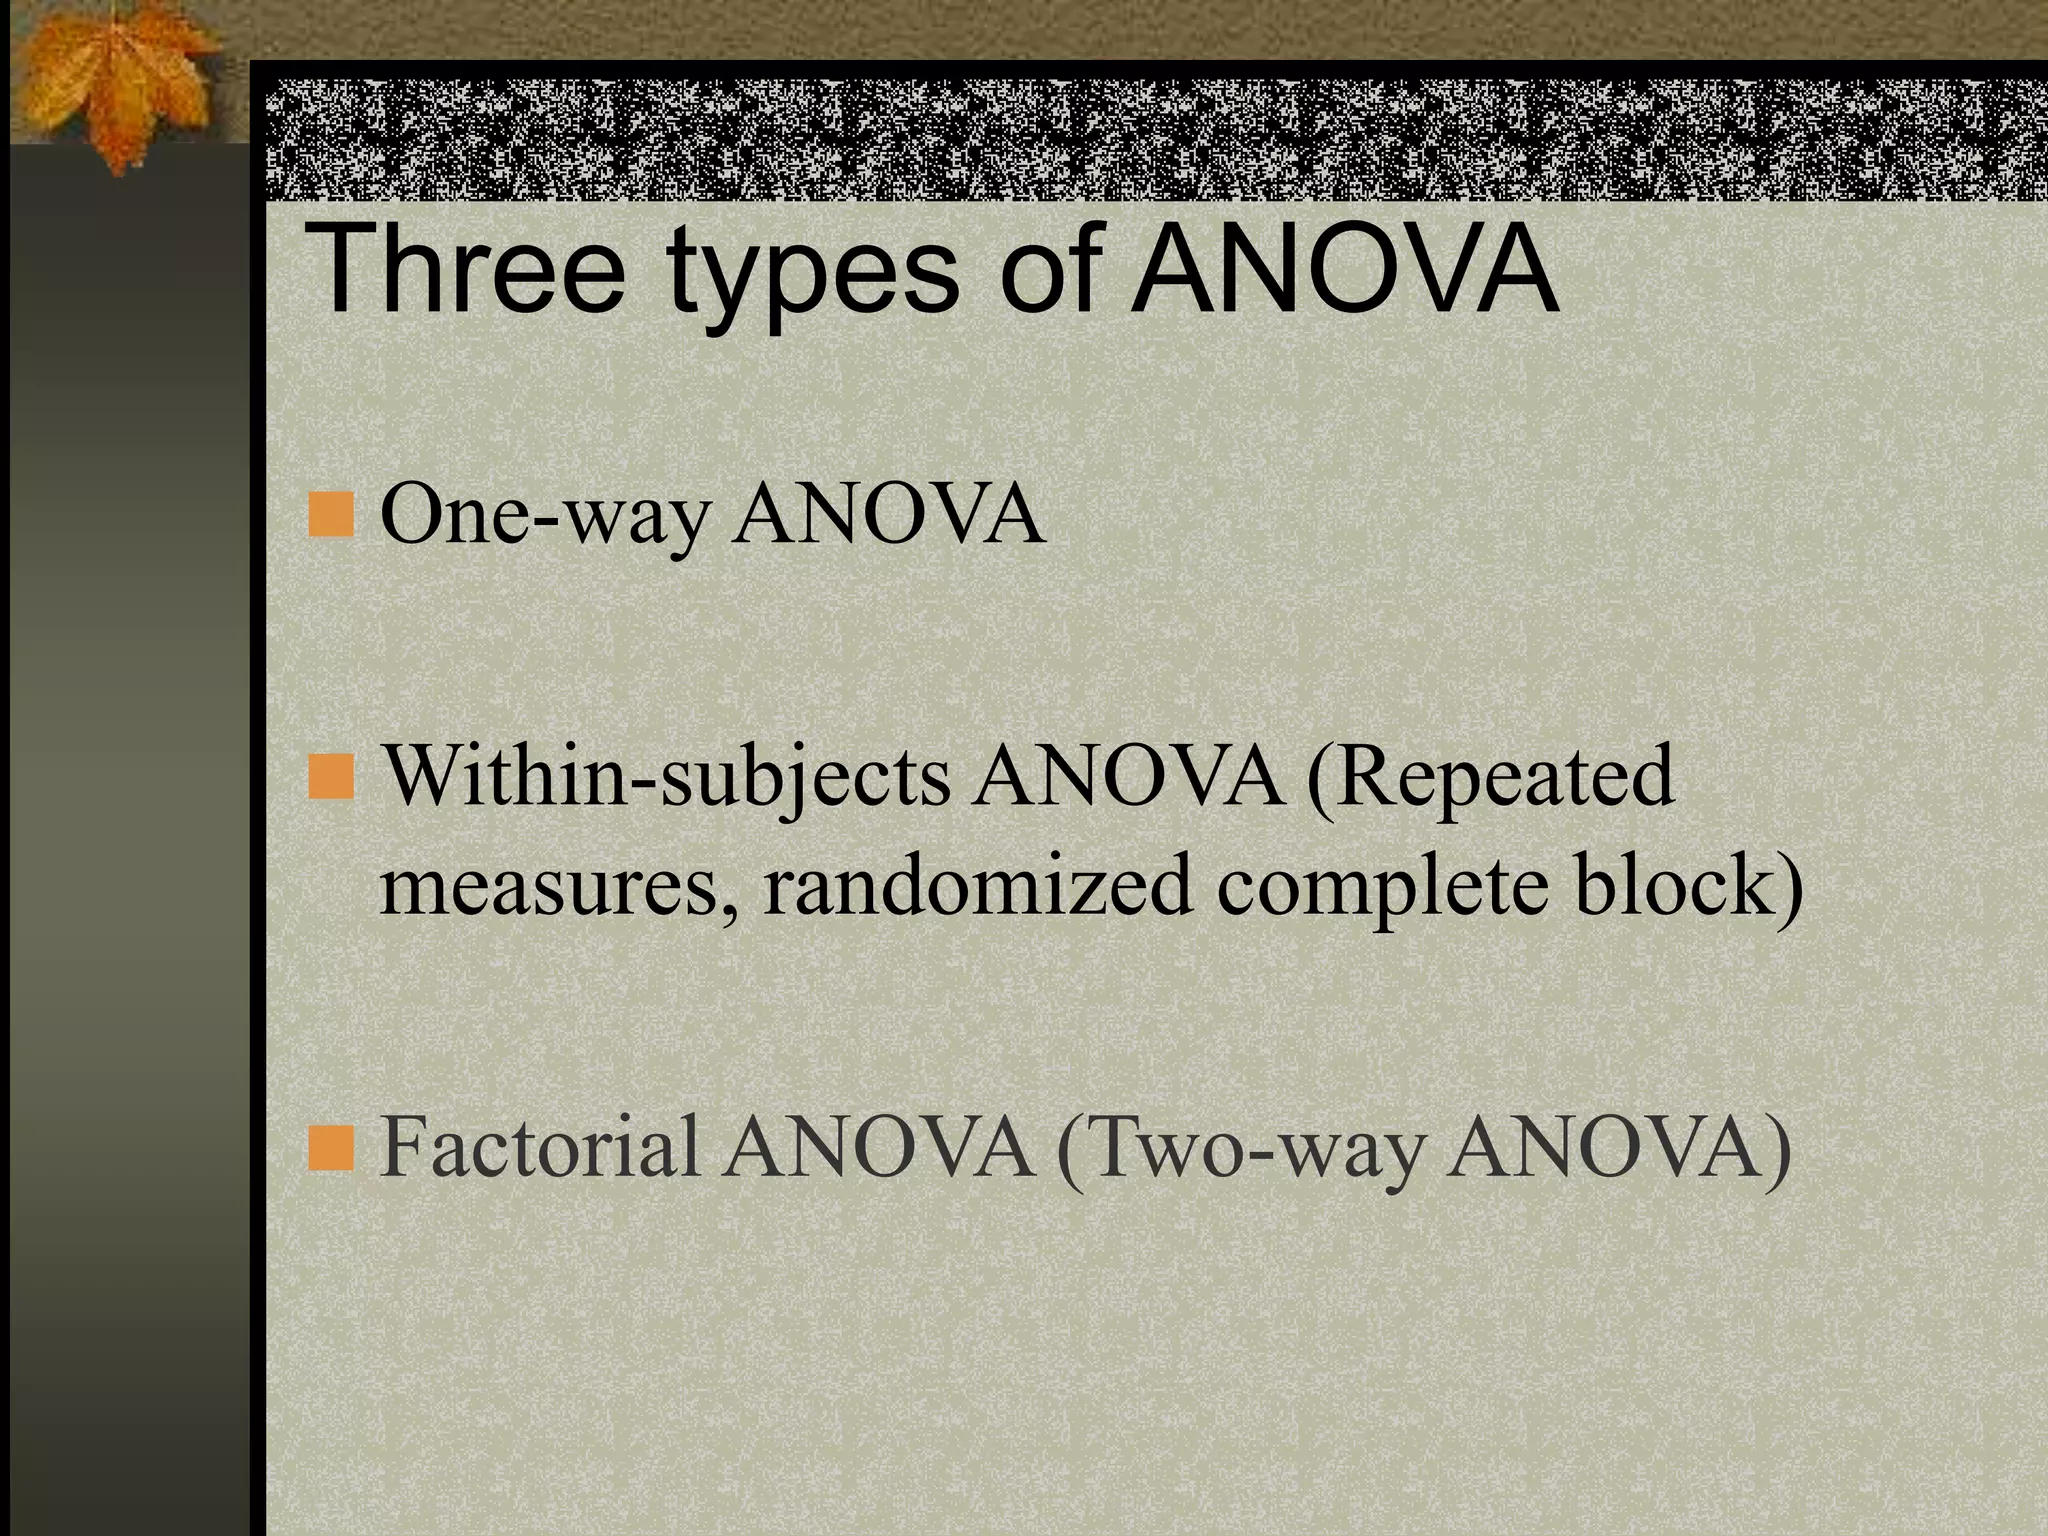
This document provides an overview of t-tests and analysis of variance (ANOVA) statistical methods. It defines different types of t-tests including one-sample t-tests, independent-samples t-tests, and paired-samples t-tests. It also explains one-way ANOVA, within-subjects ANOVA, factorial ANOVA, main effects and interaction effects in ANOVA. Key concepts such as confidence intervals, significance tests, and assumptions of normality are discussed. Examples are provided to illustrate how to set up null and alternative hypotheses and interpret statistical significance.
(Individuals With Disabilities Act Transformation Over the Years)DSilvaGraf83
(Individuals With Disabilities Act Transformation Over the Years)
Discussion Forum Instructions:
1. You must post at least three times each week.
2. Your initial post is due Tuesday of each week and the following two post are due before Sunday.
3. All post must be on separate days of the week.
4. Post must be at least 150 words and cite all of your references even it its the book.
Discussion Topic:
Describe how the lives of students with disabilities from culturally and/or linguistically diverse backgrounds have changed since the advent of IDEA. What do you feel are some things that can or should be implemented to better assist with students that have disabilities? Tell me about these ideas and how would you integrate them?
ANOVA
ANOVA
• Analysis of Variance
• Statistical method to analyzes variances to determine if the means from more than
two populations are the same
• compare the between-sample-variation to the within-sample-variation
• If the between-sample-variation is sufficiently large compared to the within-sample-
variation it is likely that the population means are statistically different
• Compares means (group differences) among levels of factors. No
assumptions are made regarding how the factors are related
• Residual related assumptions are the same as with simple regression
• Explanatory variables can be qualitative or quantitative but are categorized
for group investigations. These variables are often referred to as factors
with levels (category levels)
ANOVA Assumptions
• Assume populations , from which the response values for the groups
are drawn, are normally distributed
• Assumes populations have equal variances
• Can compare the ratio of smallest and largest sample standard deviations.
Between .05 and 2 are typically not considered evidence of a violation
assumption
• Assumes the response data are independent
• For large sample sizes, or for factor level sample sizes that are equal,
the ANOVA test is robust to assumption violations of normality and
unequal variances
ANOVA and Variance
Fixed or Random Factors
• A factor is fixed if its levels are chosen before the ANOVA investigation
begins
• Difference in groups are only investigated for the specific pre-selected factors
and levels
• A factor is random if its levels are choosen randomly from the
population before the ANOVA investigation begins
Randomization
• Assigning subjects to treatment groups or treatments to subjects
randomly reduces the chance of bias selecting results
ANOVA hypotheses statements
One-way ANOVA
One-Way ANOVA
Hypotheses statements
Test statistic
=
𝐵𝑒𝑡𝑤𝑒𝑒𝑛 𝐺𝑟𝑜𝑢𝑝 𝑉𝑎𝑟𝑖𝑎𝑛𝑐𝑒
𝑊𝑖𝑡ℎ𝑖𝑛 𝐺𝑟𝑜𝑢𝑝 𝑉𝑎𝑟𝑖𝑎𝑛𝑐𝑒
Under the null hypothesis both the between and within group variances estimate the
variance of the random error so the ratio is assumed to be close to 1.
Null Hypothesis
Alternate Hypothesis
One-Way ANOVA
One-Way ANOVA
One-Way ANOVA Excel Output
Treatme
(Individuals With Disabilities Act Transformation Over the Years)DMoseStaton39
(Individuals With Disabilities Act Transformation Over the Years)
Discussion Forum Instructions:
1. You must post at least three times each week.
2. Your initial post is due Tuesday of each week and the following two post are due before Sunday.
3. All post must be on separate days of the week.
4. Post must be at least 150 words and cite all of your references even it its the book.
Discussion Topic:
Describe how the lives of students with disabilities from culturally and/or linguistically diverse backgrounds have changed since the advent of IDEA. What do you feel are some things that can or should be implemented to better assist with students that have disabilities? Tell me about these ideas and how would you integrate them?
ANOVA
ANOVA
• Analysis of Variance
• Statistical method to analyzes variances to determine if the means from more than
two populations are the same
• compare the between-sample-variation to the within-sample-variation
• If the between-sample-variation is sufficiently large compared to the within-sample-
variation it is likely that the population means are statistically different
• Compares means (group differences) among levels of factors. No
assumptions are made regarding how the factors are related
• Residual related assumptions are the same as with simple regression
• Explanatory variables can be qualitative or quantitative but are categorized
for group investigations. These variables are often referred to as factors
with levels (category levels)
ANOVA Assumptions
• Assume populations , from which the response values for the groups
are drawn, are normally distributed
• Assumes populations have equal variances
• Can compare the ratio of smallest and largest sample standard deviations.
Between .05 and 2 are typically not considered evidence of a violation
assumption
• Assumes the response data are independent
• For large sample sizes, or for factor level sample sizes that are equal,
the ANOVA test is robust to assumption violations of normality and
unequal variances
ANOVA and Variance
Fixed or Random Factors
• A factor is fixed if its levels are chosen before the ANOVA investigation
begins
• Difference in groups are only investigated for the specific pre-selected factors
and levels
• A factor is random if its levels are choosen randomly from the
population before the ANOVA investigation begins
Randomization
• Assigning subjects to treatment groups or treatments to subjects
randomly reduces the chance of bias selecting results
ANOVA hypotheses statements
One-way ANOVA
One-Way ANOVA
Hypotheses statements
Test statistic
=
𝐵𝑒𝑡𝑤𝑒𝑒𝑛 𝐺𝑟𝑜𝑢𝑝 𝑉𝑎𝑟𝑖𝑎𝑛𝑐𝑒
𝑊𝑖𝑡ℎ𝑖𝑛 𝐺𝑟𝑜𝑢𝑝 𝑉𝑎𝑟𝑖𝑎𝑛𝑐𝑒
Under the null hypothesis both the between and within group variances estimate the
variance of the random error so the ratio is assumed to be close to 1.
Null Hypothesis
Alternate Hypothesis
One-Way ANOVA
One-Way ANOVA
One-Way ANOVA Excel Output
Treatme
A TOPIC WHICH IS RELATED TO NURSING RESEARCH AND EFFECTIVE TO DONE AND COMPLETE STUDY SO I WAS TRYING MY BEST TO INVOLVE THIS SO MY FRIENDS AND OTHER ONE COME TO WHY IS THIS MUST
Statistical inference: Statistical Power, ANOVA, and Post Hoc testsEugene Yan Ziyou
This deck was used in the IDA facilitation of the John Hopkins' Data Science Specialization course for Statistical Inference. It covers the topics in week 4 (statistical power, ANOVA, and post hoc tests).
The data and R script for the lab session can be found here: https://github.com/eugeneyan/Statistical-Inference
a full lecture presentation on ANOVA .
areas covered include;
a. definition and purpose of anova
b. one-way anova
c. factorial anova
d. mutiple anova
e MANOVA
f. POST-HOC TESTS - types
f. easy step by step process of calculating post hoc test.
Assessment 4 ContextRecall that null hypothesis tests are of.docxfestockton
Assessment 4 Context
Recall that null hypothesis tests are of two types: (1) differences between group means and (2) association between variables. In both cases there is a null hypothesis and an alternative hypothesis. In the group means test, the null hypothesis is that the two groups have equal means, and the alternative hypothesis is that the two groups do not have equal means. In the association between variables type of test, the null hypothesis is that the correlation coefficient between the two variables is zero, and the alternative hypothesis is that the correlation coefficient is not zero.
Notice in each case that the hypotheses are mutually exclusive. If the null is false, the alternative must be true. The purpose of null hypothesis statistical tests is generally to show that the null has a low probability of being true (the p value is less than .05) – low enough that the researcher can legitimately claim it is false. The reason this is done is to support the allegation that the alternative hypothesis is true.
In this context you will be studying the details of the first type of test again, with the added capability of comparing the means among more than two group at a time. This is the same type of test of difference between group means. In variations on this model, the groups can actually be the same people under different conditions. The main idea is that several group mean values are being compared. The groups each have an average score or mean on some variable. The null hypothesis is that the difference between all the group means is zero. The alternative hypothesis is that the difference between the means is not zero. Notice that if the null is false, the alternative must be true. It is first instructive to consider some of the details of groups.
One might ask why we would not use multiple t tests in this situation. For instance, with three groups, why would I not compare groups one and two with a t test, then compare groups one and three, and then compare groups two and three?
The answer can be found in our basic probability review. We are concerned with the probability of a TYPE I error (rejecting a true null hypothesis). We generally set an alpha level of .05, which is the probability of making a TYPE I error. Now consider what happens when we do three t tests. There is .05 probability of making a TYPE I error on the first test, .05 probability of the same error on the second test, and .05 probability on the third test. What happens is that these errors are essentially additive, in that the chances of at least one TYPE I error among the three tests much greater than .05. It is like the increased probability of drawing an ace from a deck of cards when we can make multiple draws.
ANOVA allows us do an "overall" test of multiple groups to determine if there are any differences among groups within the set. Notice that ANOVA does not tell us which groups among the three groups are different from each other. The primary test ...
Assessment 4 ContextRecall that null hypothesis tests are of.docxgalerussel59292
Assessment 4 Context
Recall that null hypothesis tests are of two types: (1) differences between group means and (2) association between variables. In both cases there is a null hypothesis and an alternative hypothesis. In the group means test, the null hypothesis is that the two groups have equal means, and the alternative hypothesis is that the two groups do not have equal means. In the association between variables type of test, the null hypothesis is that the correlation coefficient between the two variables is zero, and the alternative hypothesis is that the correlation coefficient is not zero.
Notice in each case that the hypotheses are mutually exclusive. If the null is false, the alternative must be true. The purpose of null hypothesis statistical tests is generally to show that the null has a low probability of being true (the p value is less than .05) – low enough that the researcher can legitimately claim it is false. The reason this is done is to support the allegation that the alternative hypothesis is true.
In this context you will be studying the details of the first type of test again, with the added capability of comparing the means among more than two group at a time. This is the same type of test of difference between group means. In variations on this model, the groups can actually be the same people under different conditions. The main idea is that several group mean values are being compared. The groups each have an average score or mean on some variable. The null hypothesis is that the difference between all the group means is zero. The alternative hypothesis is that the difference between the means is not zero. Notice that if the null is false, the alternative must be true. It is first instructive to consider some of the details of groups.
One might ask why we would not use multiple t tests in this situation. For instance, with three groups, why would I not compare groups one and two with a t test, then compare groups one and three, and then compare groups two and three?
The answer can be found in our basic probability review. We are concerned with the probability of a TYPE I error (rejecting a true null hypothesis). We generally set an alpha level of .05, which is the probability of making a TYPE I error. Now consider what happens when we do three t tests. There is .05 probability of making a TYPE I error on the first test, .05 probability of the same error on the second test, and .05 probability on the third test. What happens is that these errors are essentially additive, in that the chances of at least one TYPE I error among the three tests much greater than .05. It is like the increased probability of drawing an ace from a deck of cards when we can make multiple draws.
ANOVA allows us do an "overall" test of multiple groups to determine if there are any differences among groups within the set. Notice that ANOVA does not tell us which groups among the three groups are different from each other. The primary test.
This presentation describes the concept of One Sample t-test, Independent Sample t-test and Paired Sample t-test. This presentation also deals about the procedure to do the t-test through SPSS.
BUS 308 Week 3 Lecture 1 Examining Differences - Continued.docxcurwenmichaela
BUS 308 Week 3 Lecture 1
Examining Differences - Continued
Expected Outcomes
After reading this lecture, the student should be familiar with:
1. Issues around multiple testing
2. The basics of the Analysis of Variance test
3. Determining significant differences between group means
4. The basics of the Chi Square Distribution.
Overview
Last week, we found out ways to examine differences between a measure taken on two
groups (two-sample test situation) as well as comparing that measure to a standard (a one-sample
test situation). We looked at the F test which let us test for variance equality. We also looked at
the t-test which focused on testing for mean equality. We noted that the t-test had three distinct
versions, one for groups that had equal variances, one for groups that had unequal variances, and
one for data that was paired (two measures on the same subject, such as salary and midpoint for
each employee). We also looked at how the 2-sample unequal t-test could be used to use Excel
to perform a one-sample mean test against a standard or constant value. This week we expand
our tool kit to let us compare multiple groups for similar mean values.
A second tool will let us look at how data values are distributed – if graphed, would they
look the same? Different shapes or patterns often means the data sets differ in significant ways
that can help explain results.
Multiple Groups
As interesting as comparing two groups is, often it is a bit limiting as to what it tells us.
One obvious issue that we are missing in the comparisons made last week was equal work. This
idea is still somewhat hard to get a clear handle on. Typically, as we look at this issue, questions
arise about things such as performance appraisal ratings, education distribution, seniority impact,
etc.
Some of these can be tested with the tools introduced last week. We can see, for
example, if the performance rating average is the same for each gender. What we couldn’t do, at
this point however, is see if performance ratings differ by grade, do the more senior workers
perform relatively better? Is there a difference between ratings for each gender by grade level?
The same questions can be asked about seniority impact. This week will give us tools to expand
how we look at the clues hidden within the data set about equal pay for equal work.
ANOVA
So, let’s start taking a look at these questions. The first tool for this week is the Analysis
of Variance – ANOVA for short. ANOVA is often confusing for students; it says it analyzes
variance (which it does) but the purpose of an ANOVA test is to determine if the means of
different groups are the same! Now, so far, we have considered means and variance to be two
distinct characteristics of data sets; characteristics that are not related, yet here we are saying that
looking at one will give us insight into the other.
The reason is due to the way the variance is an.
Assessment 3 ContextYou will review the theory, logic, and a.docxgalerussel59292
Assessment 3 Context
You will review the theory, logic, and application of t-tests. The t-test is a basic inferential statistic often reported in psychological research. You will discover that t-tests, as well as analysis of variance (ANOVA), compare group means on some quantitative outcome variable.
Recall that null hypothesis tests are of two types: (1) differences between group means and (2) association between variables. In both cases there is a null hypothesis and an alternative hypothesis. In the group means test, the null hypothesis is that the two groups have equal means, and the alternative hypothesis is that the two groups do not have equal means. In the association between variables type of test, the null hypothesis is that the correlation coefficient between the two variables is zero, and the alternative hypothesis is that the correlation coefficient is not zero.
Notice in each case that the hypotheses are mutually exclusive. If the null is false, the alternative must be true. The purpose of null hypothesis statistical tests is generally to show that the null has a low probability of being true (the p value is less than .05) – low enough that the researcher can legitimately claim it is false. The reason this is done is to support the allegation that the alternative hypothesis is true.
In this context you will be studying the details of the first type of test. This is the test of difference between group means. In variations on this model, the two groups can actually be the same people under different conditions, or one of the groups may be assigned a fixed theoretical value. The main idea is that two mean values are being compared. The two groups each have an average score or mean on some variable. The null hypothesis is that the difference between the means is zero. The alternative hypothesis is that the difference between the means is not zero. Notice that if the null is false, the alternative must be true. It is first instructive to consider some of the details of groups. Means, and difference between them.
Null Hypothesis Significance Test
The most common forms of the Null Hypothesis Significance Test (NHST) are three types of t tests, and the test of significance of a correlation. The NHST also extends to more complex tests, such as ANOVA, which will be discussed separately. Below, the null hypothesis and the alternative hypothesis are given for each of the following tests. It would be a valuable use of your time to commit the information below to memory. Once this is done, then when we refer to the tests later, you will have some structure to make sense of the more detailed explanations.
1. One-sample t test: The question in this test is whether a single sample group mean is significantly different from some stated or fixed theoretical value - the fixed value is called a parameter.
· Null Hypothesis: The difference between the sample group mean and the fixed value is zero in the population.
· Alternative hypothesis: T.
In this presentation, you will differentiate the ANOVA and ANCOVA statistical methods, and identify real-world situations where the ANOVA and ANCOVA methods for statistical inference are applied.
Inferential statistics are techniques that allow us to use these samples to make generalizations about the populations from which the samples were drawn. ... The methods of inferential statistics are (1) the estimation of parameter(s) and (2) testing of statistical hypotheses.
Welcome to TechSoup New Member Orientation and Q&A (May 2024).pdfTechSoup
In this webinar you will learn how your organization can access TechSoup's wide variety of product discount and donation programs. From hardware to software, we'll give you a tour of the tools available to help your nonprofit with productivity, collaboration, financial management, donor tracking, security, and more.
We all have good and bad thoughts from time to time and situation to situation. We are bombarded daily with spiraling thoughts(both negative and positive) creating all-consuming feel , making us difficult to manage with associated suffering. Good thoughts are like our Mob Signal (Positive thought) amidst noise(negative thought) in the atmosphere. Negative thoughts like noise outweigh positive thoughts. These thoughts often create unwanted confusion, trouble, stress and frustration in our mind as well as chaos in our physical world. Negative thoughts are also known as “distorted thinking”.
Read| The latest issue of The Challenger is here! We are thrilled to announce that our school paper has qualified for the NATIONAL SCHOOLS PRESS CONFERENCE (NSPC) 2024. Thank you for your unwavering support and trust. Dive into the stories that made us stand out!
Instructions for Submissions thorugh G- Classroom.pptxJheel Barad
This presentation provides a briefing on how to upload submissions and documents in Google Classroom. It was prepared as part of an orientation for new Sainik School in-service teacher trainees. As a training officer, my goal is to ensure that you are comfortable and proficient with this essential tool for managing assignments and fostering student engagement.
2024.06.01 Introducing a competency framework for languag learning materials ...Sandy Millin
http://sandymillin.wordpress.com/iateflwebinar2024
Published classroom materials form the basis of syllabuses, drive teacher professional development, and have a potentially huge influence on learners, teachers and education systems. All teachers also create their own materials, whether a few sentences on a blackboard, a highly-structured fully-realised online course, or anything in between. Despite this, the knowledge and skills needed to create effective language learning materials are rarely part of teacher training, and are mostly learnt by trial and error.
Knowledge and skills frameworks, generally called competency frameworks, for ELT teachers, trainers and managers have existed for a few years now. However, until I created one for my MA dissertation, there wasn’t one drawing together what we need to know and do to be able to effectively produce language learning materials.
This webinar will introduce you to my framework, highlighting the key competencies I identified from my research. It will also show how anybody involved in language teaching (any language, not just English!), teacher training, managing schools or developing language learning materials can benefit from using the framework.
The French Revolution, which began in 1789, was a period of radical social and political upheaval in France. It marked the decline of absolute monarchies, the rise of secular and democratic republics, and the eventual rise of Napoleon Bonaparte. This revolutionary period is crucial in understanding the transition from feudalism to modernity in Europe.
For more information, visit-www.vavaclasses.com
This is a presentation by Dada Robert in a Your Skill Boost masterclass organised by the Excellence Foundation for South Sudan (EFSS) on Saturday, the 25th and Sunday, the 26th of May 2024.
He discussed the concept of quality improvement, emphasizing its applicability to various aspects of life, including personal, project, and program improvements. He defined quality as doing the right thing at the right time in the right way to achieve the best possible results and discussed the concept of the "gap" between what we know and what we do, and how this gap represents the areas we need to improve. He explained the scientific approach to quality improvement, which involves systematic performance analysis, testing and learning, and implementing change ideas. He also highlighted the importance of client focus and a team approach to quality improvement.
Unit 8 - Information and Communication Technology (Paper I).pdfThiyagu K
This slides describes the basic concepts of ICT, basics of Email, Emerging Technology and Digital Initiatives in Education. This presentations aligns with the UGC Paper I syllabus.
1. t(ea) for Two:
Test between the Means of Different Groups
When you want to know if there is a
‘difference’ between the two groups in the
mean
Use “t-test”.
Why can’t we just use the “difference” in
score?
Because we have to take the ‘variability’ into
account.
T = difference between group means
sampling variability
2. One-Sample T Test
Evaluates whether the mean on a test
variable is significantly different from a
constant (test value).
Test value typically represents a neutral
point. (e.g. midpoint on the test variable,
the average value of the test variable
based on past research)
3. Example of One-sample T-test
Is the starting salary of company A
($17,016.09) the same as the average
of the starting salary of the national
average ($20,000)?
Null Hypothesis:
Starting salary of company A = National average
Alternative Hypothesis:
Starting salary of company A = National average
4. SPSS demo (“employee data”)
Review:
Standard deviation: Measure of dispersion or
spread of scores in a distribution of scores.
Standard error of the mean: Standard deviation
of sampling distribution. How much the mean
would be expected to vary if the differences
were due only to error variance.
Significance test: Statistical test to determine
how likely it is that the observed
characteristics of the samples have occurred
by chance alone in the population from which
the samples were selected.
5. z and t
Z score : standardized scores
Z distribution : normal curve with mean value
z=0
95% of the people in the given sample (or
population) have
z-scores between –1.96 and 1.96.
T distribution is adjustment of z distribution for
sample size (smaller sampling distribution
has flatter shape with small samples).
T = difference between group means
sampling variability
6. Confidence Interval
A range of values of a sample statistic that
is likely (at a given level of probability, i.e.
confidence level) to contain a population
parameter.
The interval that will include that
population parameter a certain percentage
(= confidence level) of the time.
7. Confidence Interval for difference
and Hypothesis Test
When the value 0 is not included in the
interval, that means 0 (no difference) is not a
plausible population value.
It appears unlikely that the true difference
between Company A’s salary average and the
national salary average is 0.
Therefore, Company A’s salary average is
significantly different from the national salary
average.
8. Independent-Sample T test
Evaluates the difference between the
means of two independent groups.
Also called “Between Groups T test”
Ho: 1= 2
H1: 1= 2
9. Paired-Sample T test
Evaluates whether the mean of the difference
between the paired variables is significantly
different than zero.
Applicable to 1) repeated measures and 2)
matched subjects.
Also called “Within Subject T test” “Repeated
Measures T test”.
Ho: d= 0
H1: d= 0
11. Analysis of Variance (ANOVA)
An inferential statistical procedure used
to test the null hypothesis that the
means of two or more populations are
equal to each other.
The test statistic for ANOVA is the F-test
(named for R. A. Fisher, the creator of
the statistic).
12. T test vs. ANOVA
T-test
Compare two groups
Test the null hypothesis that two populations
has the same average.
ANOVA:
Compare more than two groups
Test the null hypothesis that two populations
among several numbers of populations has the
same average.
13. ANOVA example
Example: Curricula A, B, C.
You want to know what the average score on the
test of computer operations would have been
if the entire population of the 4th graders in the school
system had been taught using Curriculum A;
What the population average would have been had they
been taught using Curriculum B;
What the population average would have been had they
been taught using Curriculum C.
Null Hypothesis: The population averages would have
been identical regardless of the curriculum used.
Alternative Hypothesis: The population averages differ for
at least one pair of the population.
14. ANOVA: F-ratio
The variation in the averages of these samples, from one
sample to the next, will be compared to the variation
among individual observations within each of the samples.
Statistic termed an F-ratio will be computed. It will
summarize the variation among sample averages,
compared to the variation among individual observations
within samples.
This F-statistic will be compared to tabulated critical
values that correspond to selected alpha levels.
If the computed value of the F-statistic is larger than the
critical value, the null hypothesis of equal population
averages will be rejected in favor of the alternative that the
population averages differ.
15. Interpreting Significance
p<.05
The probability of observing an F-statistic
at least this large, given that the null
hypothesis was true, is less than .05.
16. Logic of ANOVA
If 2 or more populations have identical averages,
the averages of random samples selected from
those populations ought to be fairly similar as well.
Sample statistics vary from one sample to the next,
however, large differences among the sample
averages would cause us to question the
hypothesis that the samples were selected from
populations with identical averages.
17. Logic of ANOVA cont.
How much should the sample averages differ
before we conclude that the null hypothesis of
equal population averages should be rejected.
In ANOVA, the answer to this question is obtained
by comparing the variation among the sample
averages to the variation among observations
within each of the samples.
Only if variation among sample averages is
substantially larger than the variation within the
samples, do we conclude that the populations must
have had different averages.
19. Sources of Variation
Three sources of variation:
1) Total, 2) Between groups, 3) Within groups
Sum of Squares (SS): Reflects variation. Depend on
sample size.
Degrees of freedom (df): Number of population averages
being compared.
Mean Square (MS): SS adjusted by df. MS can be
compared with each other. (SS/df)
F statistic: used to determine whether the population
averages are significantly different. If the computed F
static is larger than the critical value that corresponds to a
selected alpha level, the null hypothesis is rejected.
20. Computing F-ratio
SS Total: Total variation in the data
df total: Total sample size (N) -1
MS total: SS total/ df total
SS between: Variation among the groups compared.
df between: Number of groups -1
MS between : SS between/df between
SS within: Variation among the scores who are in the
same group.
df within: Total sample size - number of groups -1
MS within: SS within/df within
F ratio = MS between / MS within
21. Formula for One-way ANOVA
Formula Name How To
S
um of S
quare Total S
ubtract each of the scoresfrom
the mean of the entire sample.
S
quare each of those deviations.
Add those up for each group,
then add the two groups
together.
S
um of S
quaresAmong Each group mean issubtracted
from the overall sample mean,
squared, multiplied by how
many are in that group, then
those are summed up. For two
groups, we just sum together
two numbers.
S
um of S
quaresWithin Here'sa shortcut. Just find the
S
S
T and the S
S
A and find the
difference. What'sleft over isthe
S
S
W.
22. Alpha inflation
Conducting multiple ANOVAs, will incur a large
risk that at least one of them would be statistically
significant just by chance.
The risk of committee Type I error is very large
for the entire set of ANOVAs.
Example: 2 tests .05 Alpha
Probability of not having Type I error .95
.95x.95 = .9025
Probability of at least one Type I error is
1-9025= .0975. Close to 10 %.
Use more stringent criteria. e.g. .001
23. Relation between t-test and F-test
When two groups are compared both t-test
and F-test will lead to the same answer.
t2 = F.
So by squaring t you’ll get F
(or square root of t is F)
24. Follow-up test
Conducted to see specifically which means are
different from which other means.
Instead of repeating t-test for each combination
(which can lead to an alpha inflation) there are
some modified versions of t-test that adjusts for
the alpha inflation.
Most recommended: Tukey HSD test
Other popular tests: Bonferroni test , Scheffe test
25. Within-Subject (Repeated
Measures) ANOVA
SS tr : Sum of Squares Treatment
SS block : Sum of Squares Block
SS error = SS total - SS block - SS tr
MS tr = SS tr/k-1
MSE = SS error/(n-1)(k-1)
F = MS tr/MSE
26. Within-Subject (Repeated
Measures) ANOVA
Examine differences on a dependent
variable that has been measured at more
than two time points for one or more
independent categorical variables.
27. Within-Subject (Repeated
Measures) ANOVA
Formula Name Description
Sum of Squares
Treatment
Representsvariation
due to treatment
effect
Sum of SquaresBlock Representsvariation
within an individual
(within block)
Sum of SquaresError Representserror
variation
Sum of SquaresTotal Representstotal
variation
28. Factorial ANOVA
T-test and One way ANOVA
1 independent variable (e.g. Gender), 1
dependent variable (e.g. Test score)
Two-way ANOVA (Factorial ANOVA)
2 (or more) independent variables (e.g.
Gender and Academic Standing), 1
dependent variable (e.g. Test score)
30. Main Effects and
Interaction Effects
Main Effects
The effects for each independent variable on the dependent
variable.
Differences between the group means for each
independent variable on the dependent variable.
Interaction Effect
When the relationship between the dependent variable and
one independent variable differs according to the level of a
second independent variable.
When the effect of one independent variable on the
dependent variable differs at various levels of second
independent variable.
31. T-distribution
A family of theoretical probability distributions used in
hypothesis testing.
As with normal distributions (or z-distributions), t
distributions are unimodal, symmetrical and bell shaped.
Important for interpreting data gather on small samples
when the population variance is unknown.
The larger the sample, the more closely the t approximates
the normal distribution. For sample greater than 120, they
are practically equivalent.