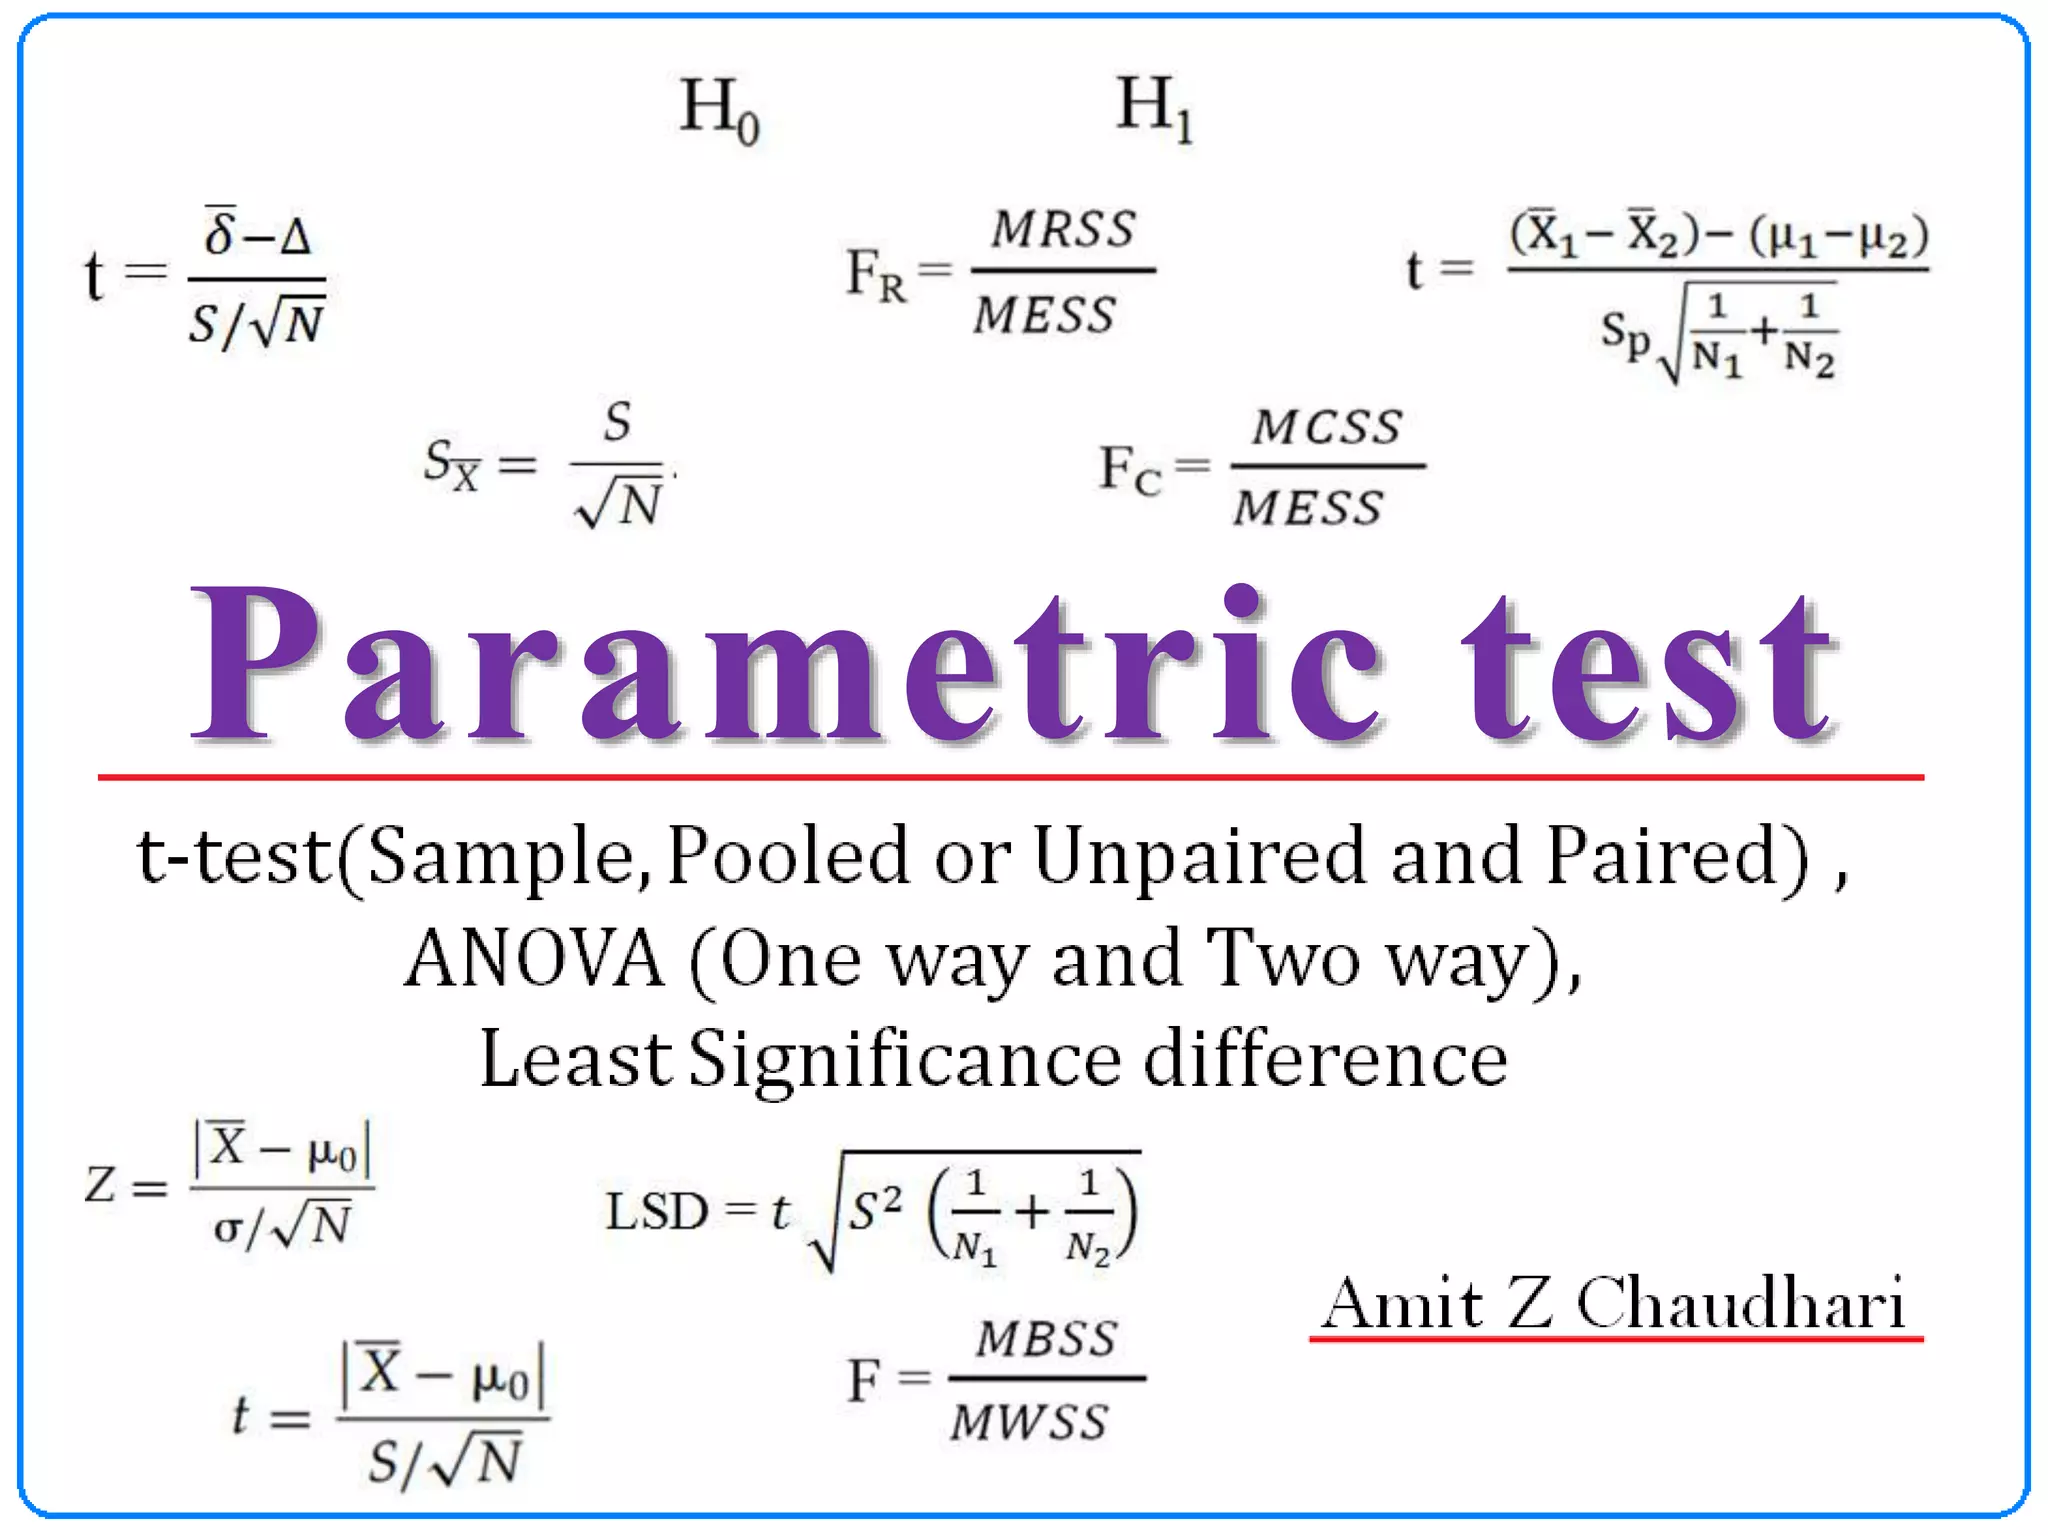
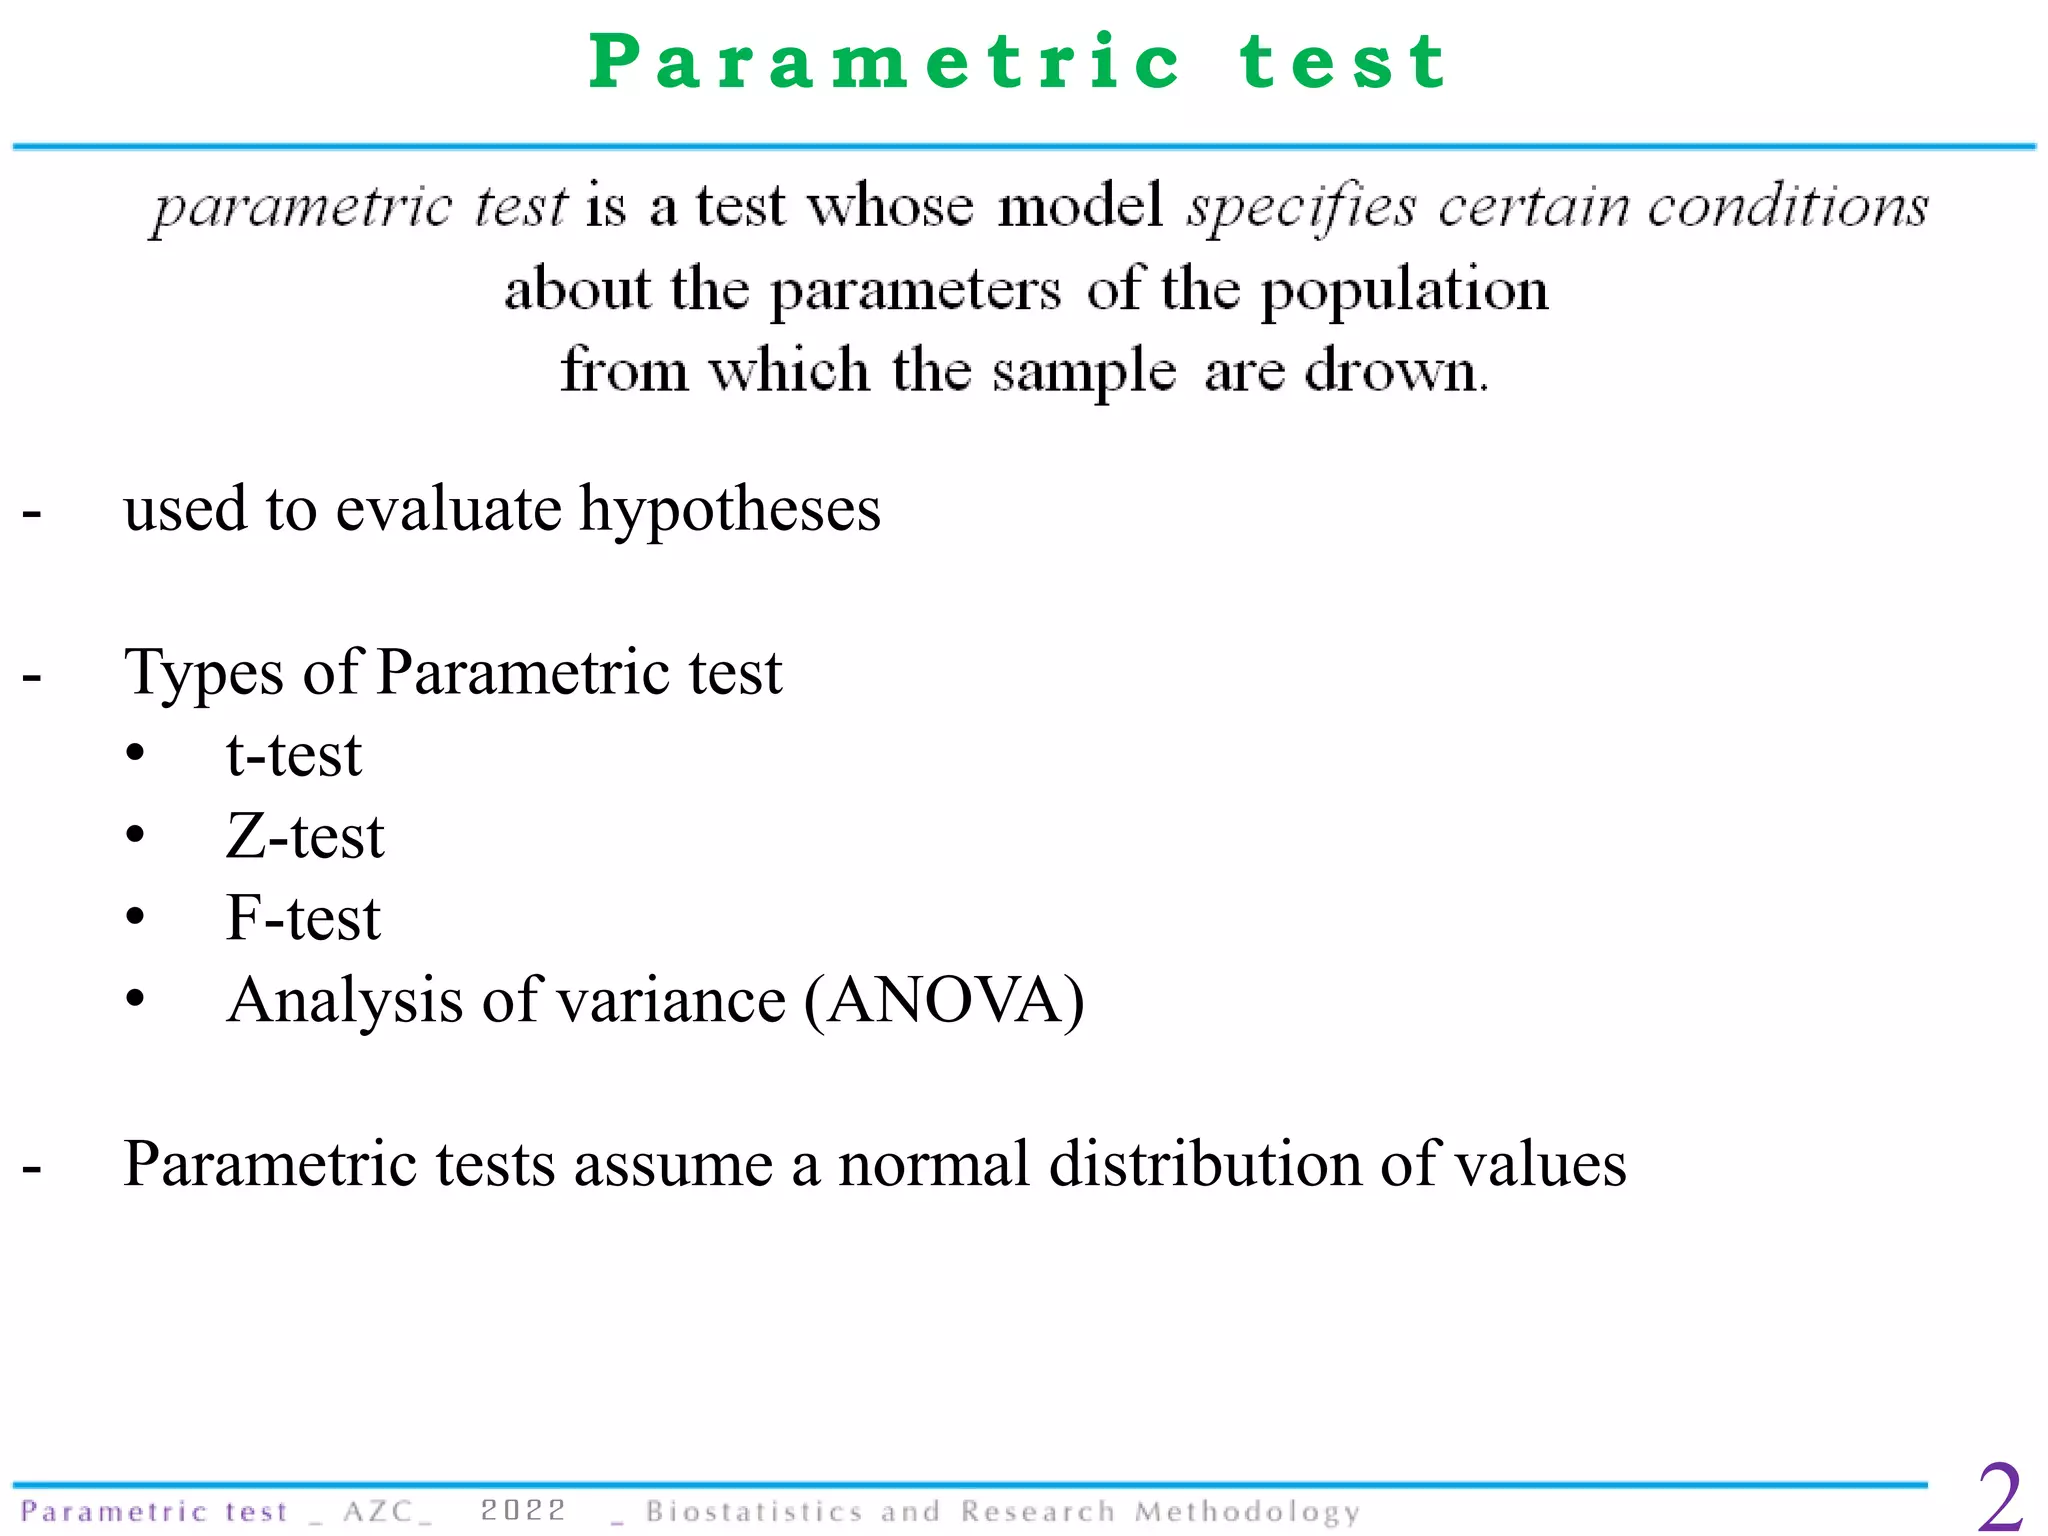
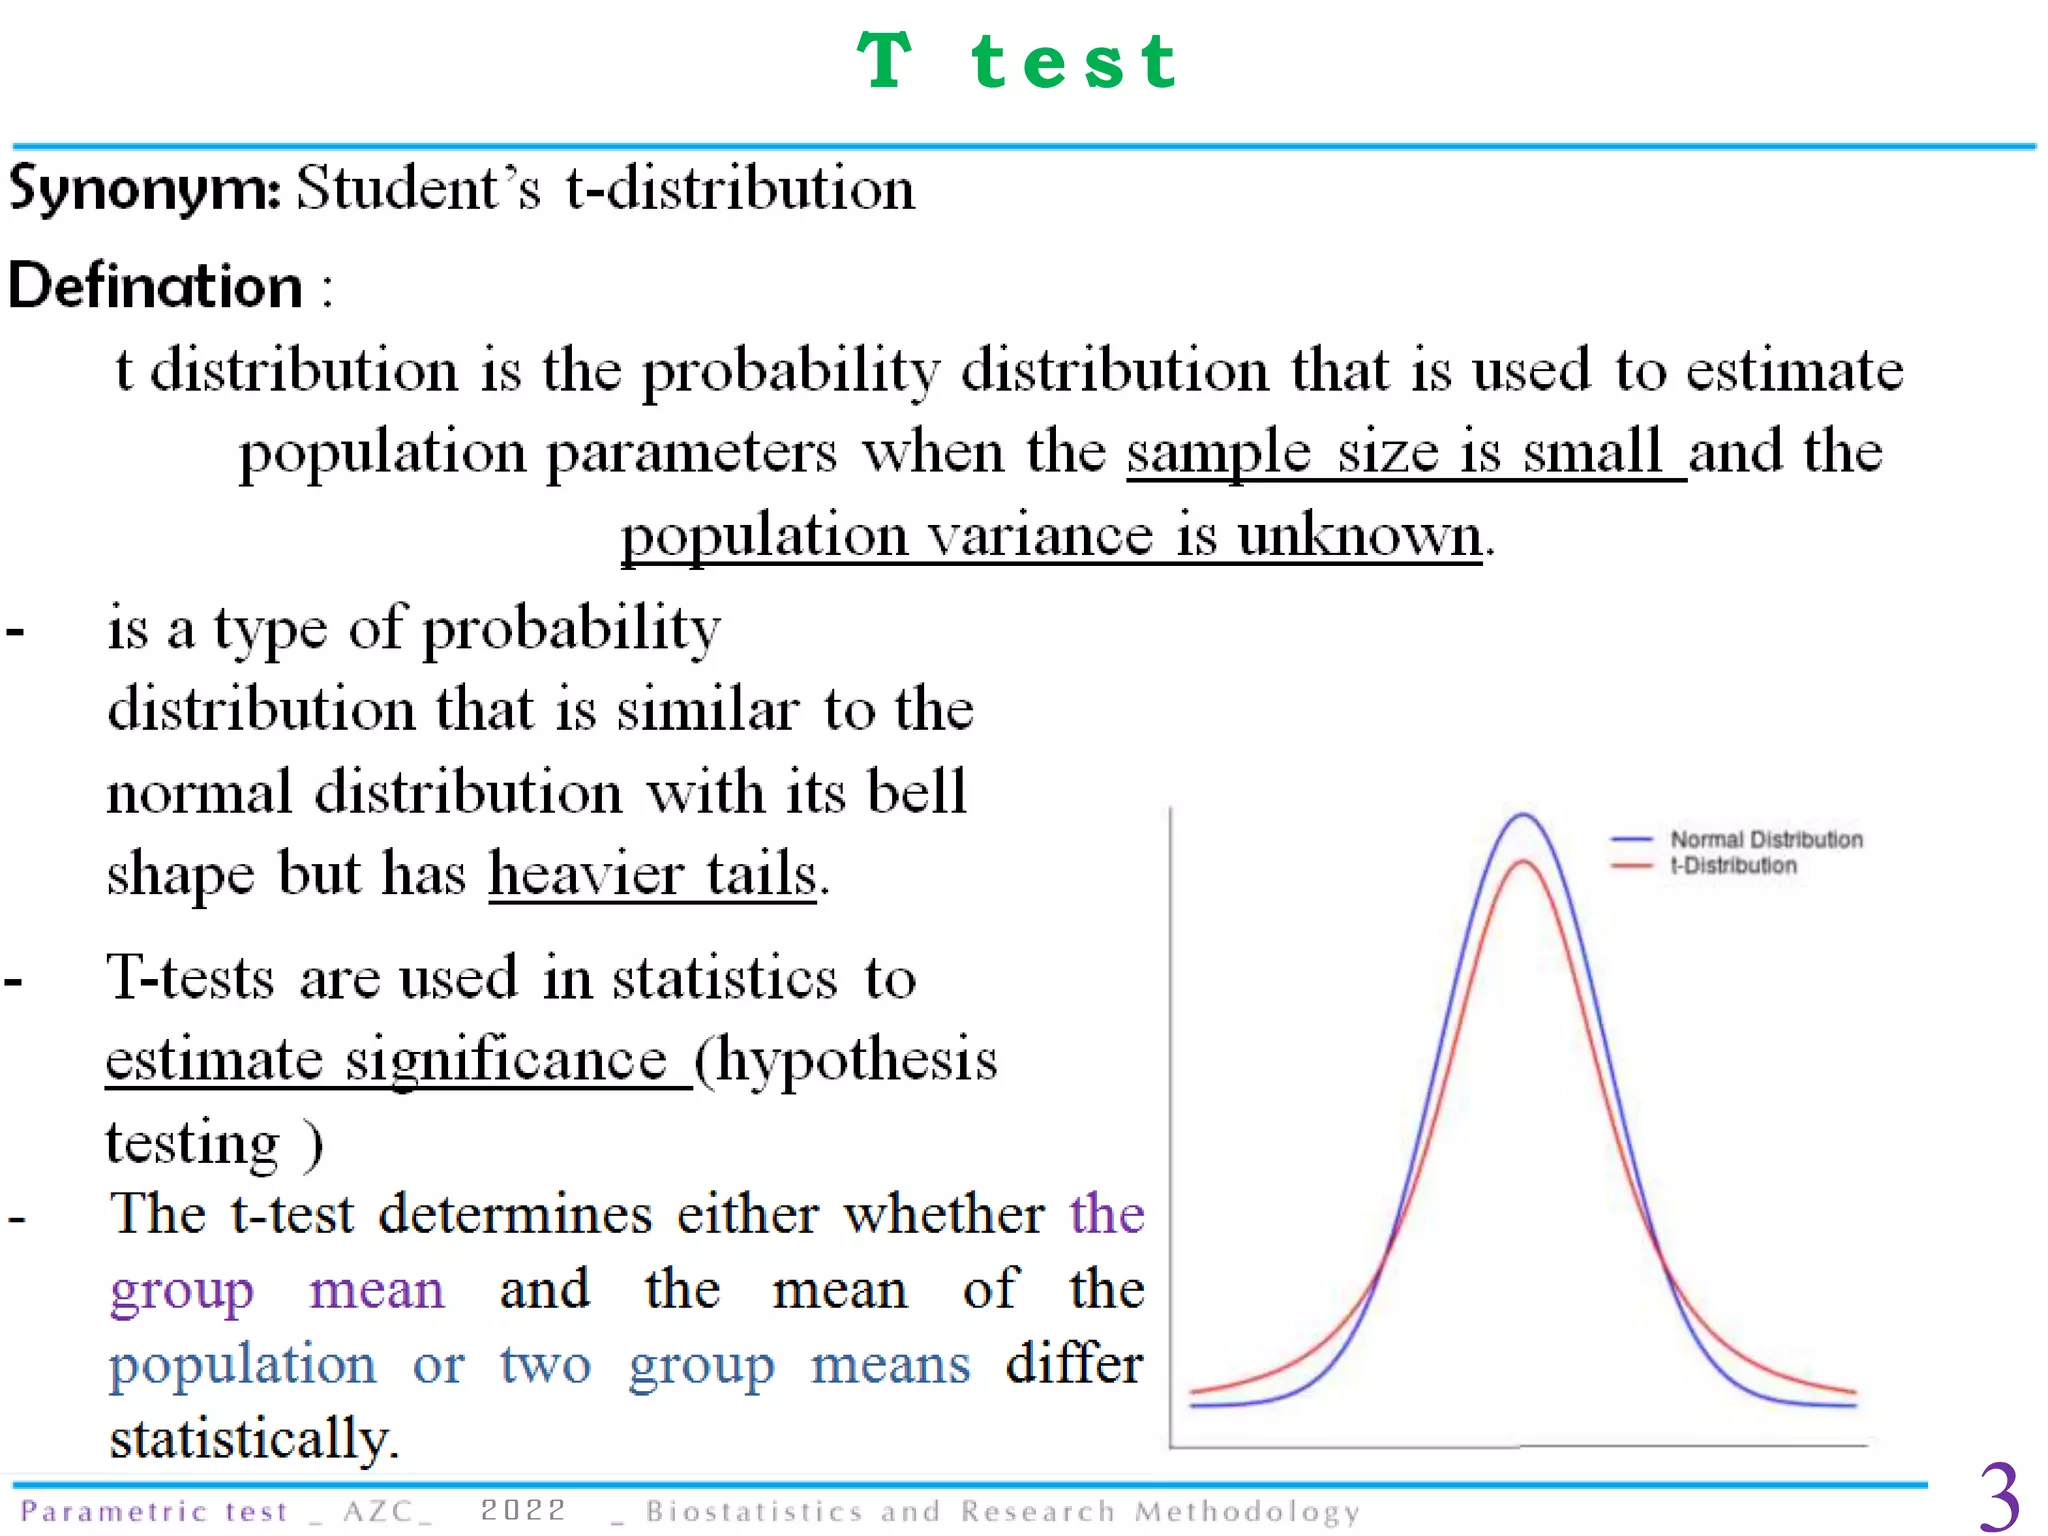
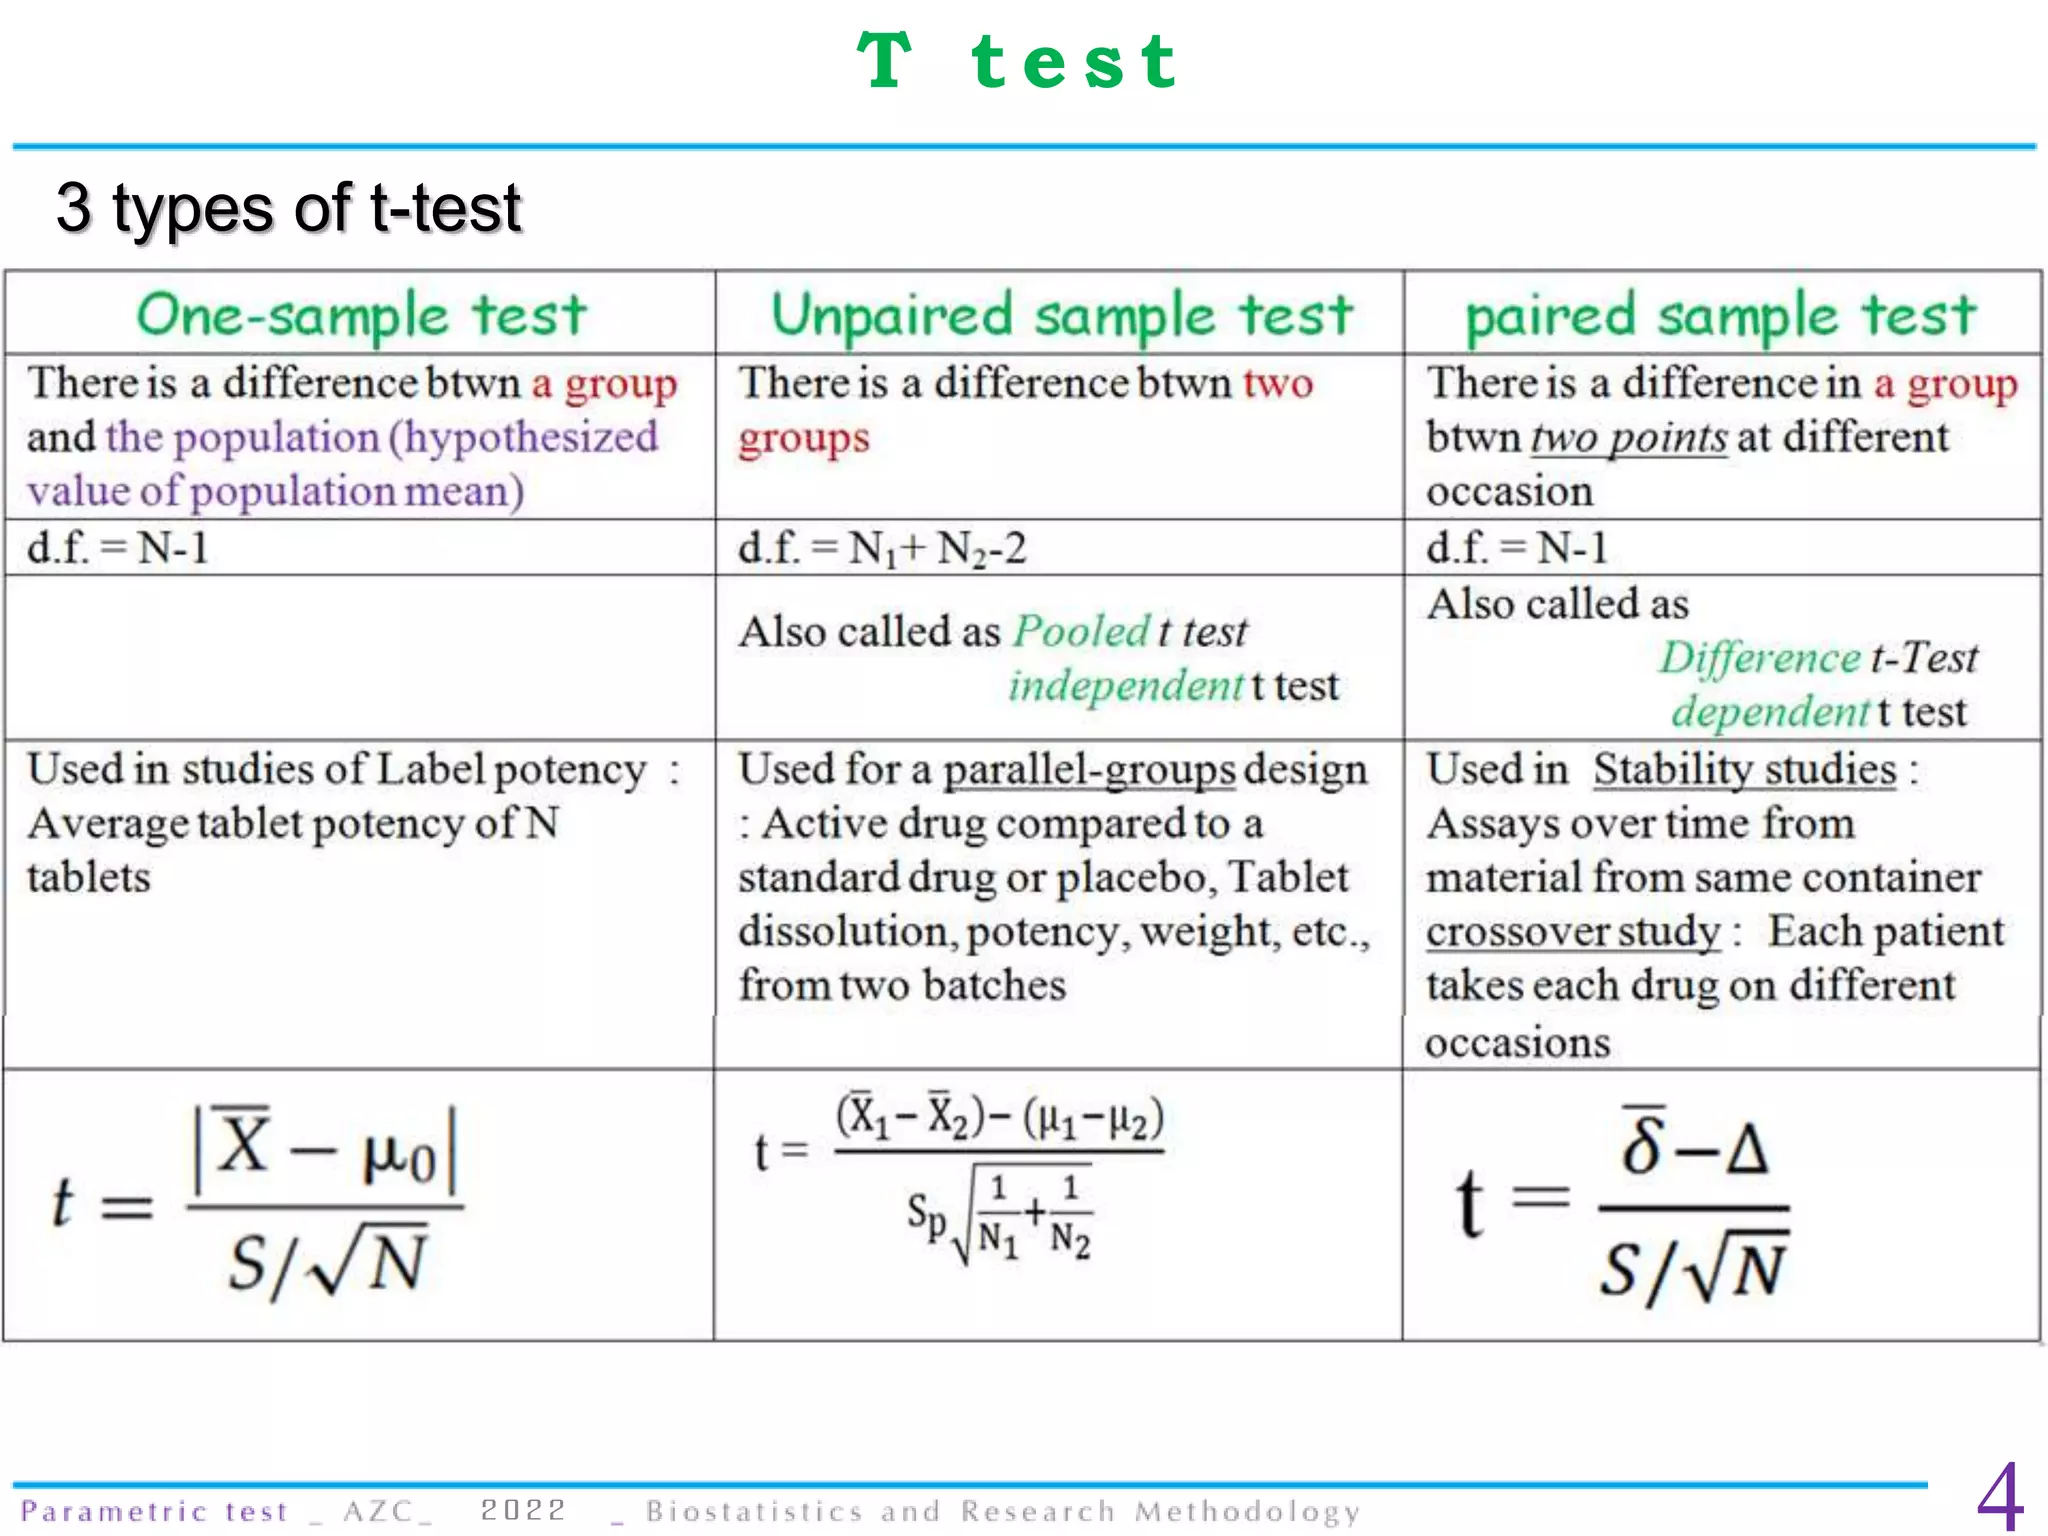
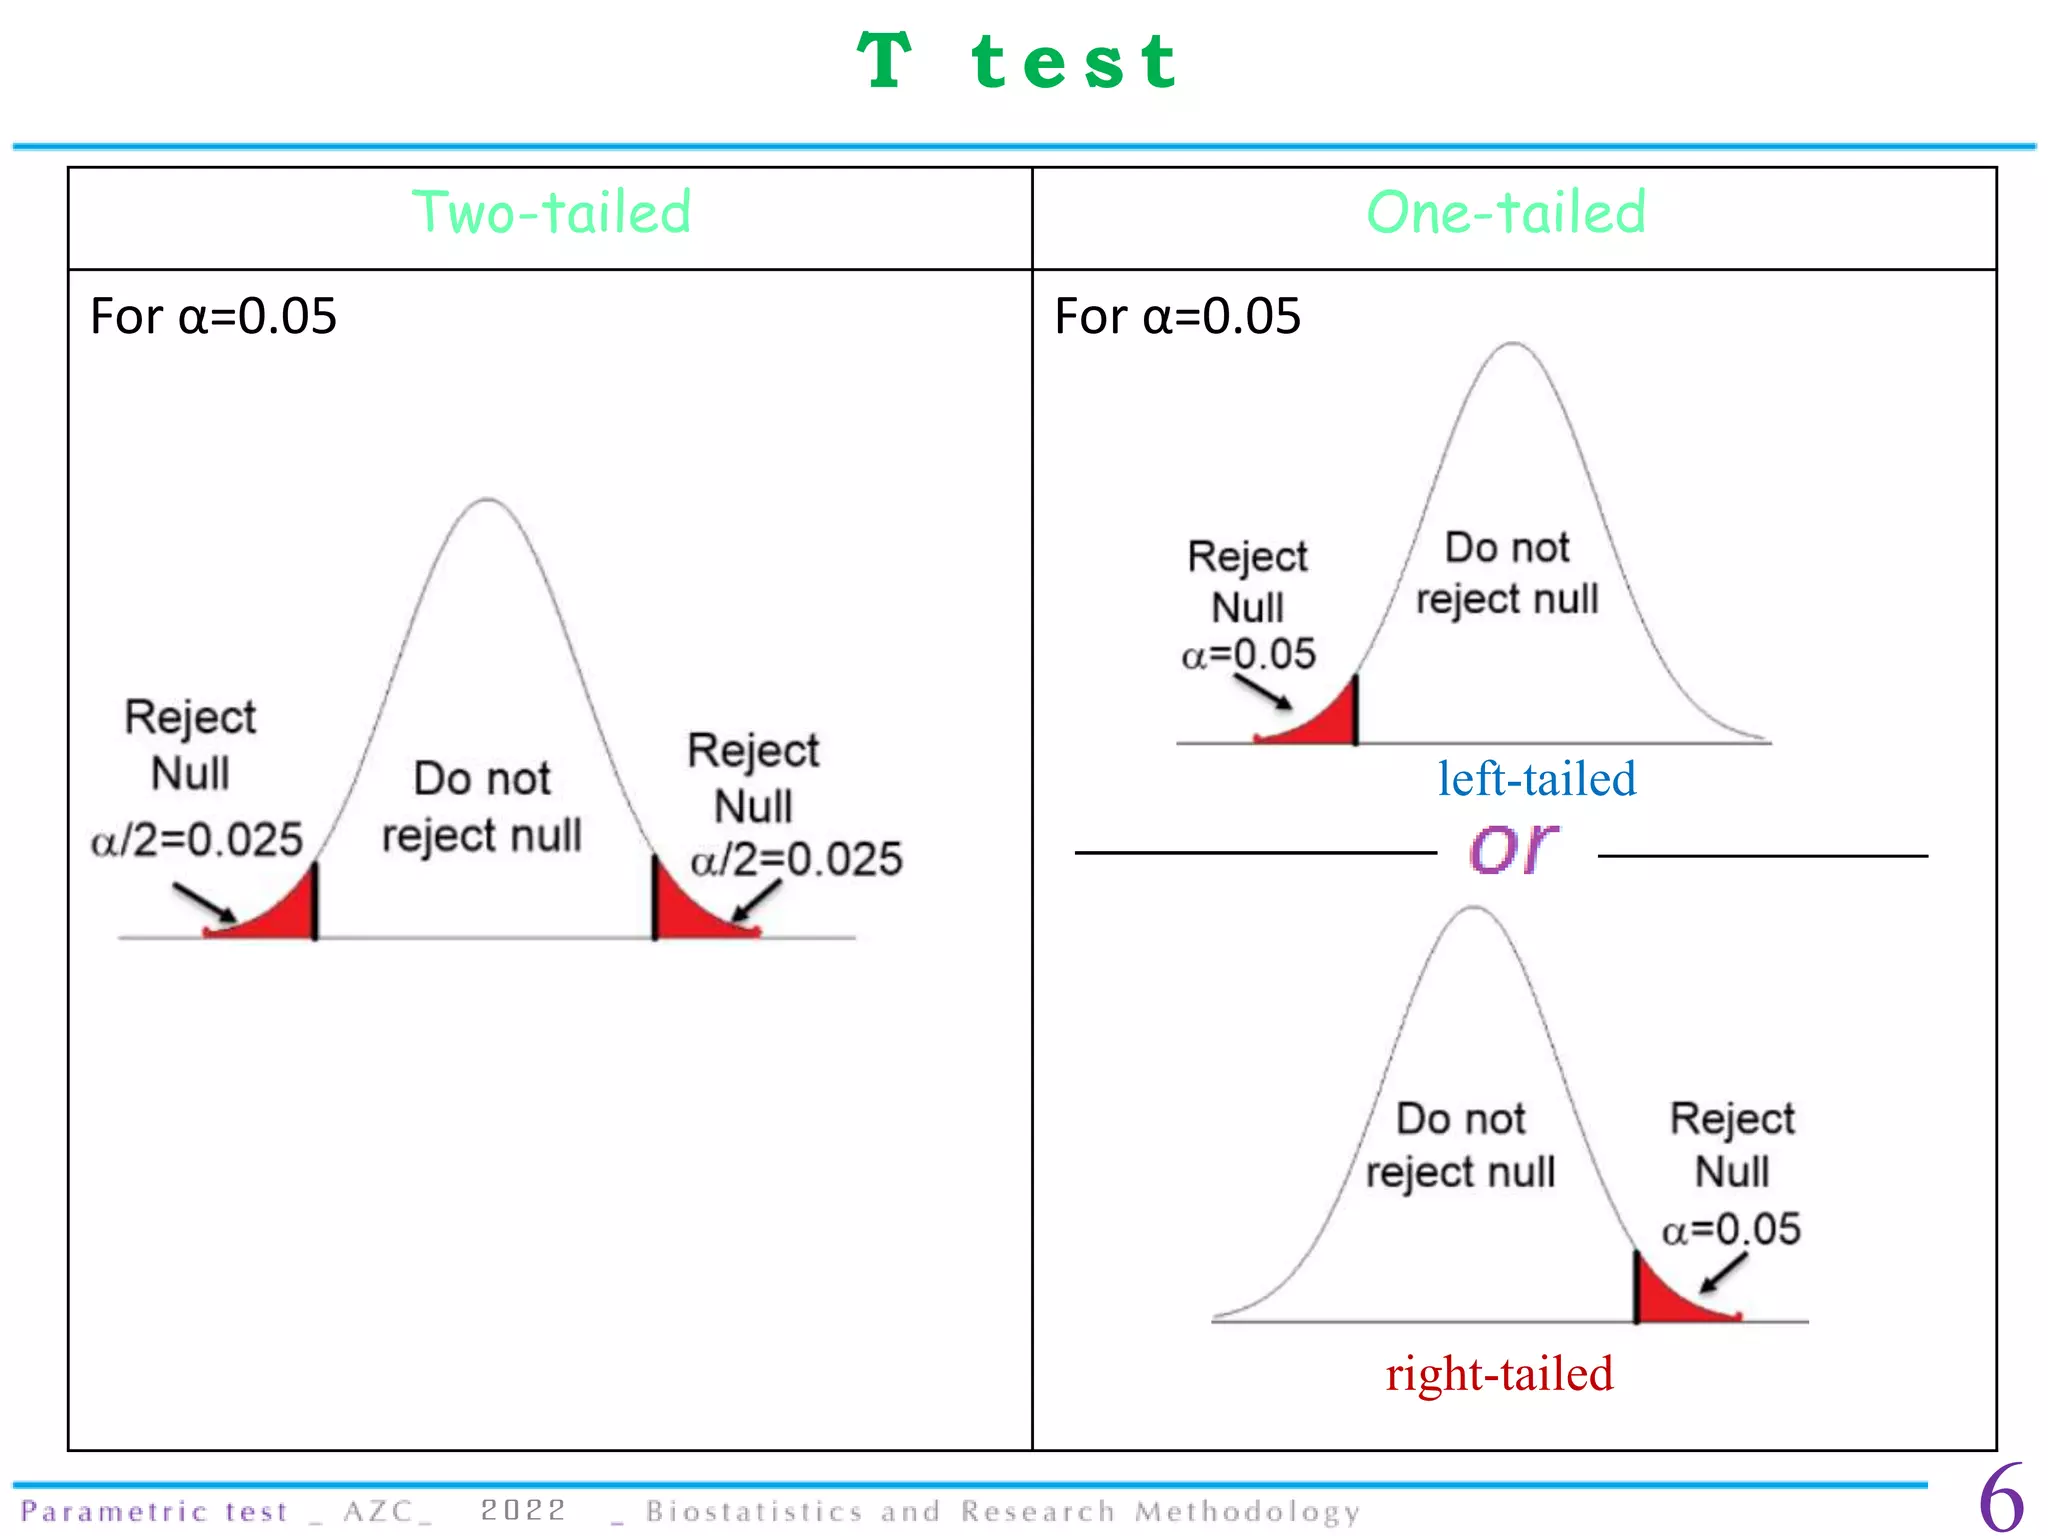
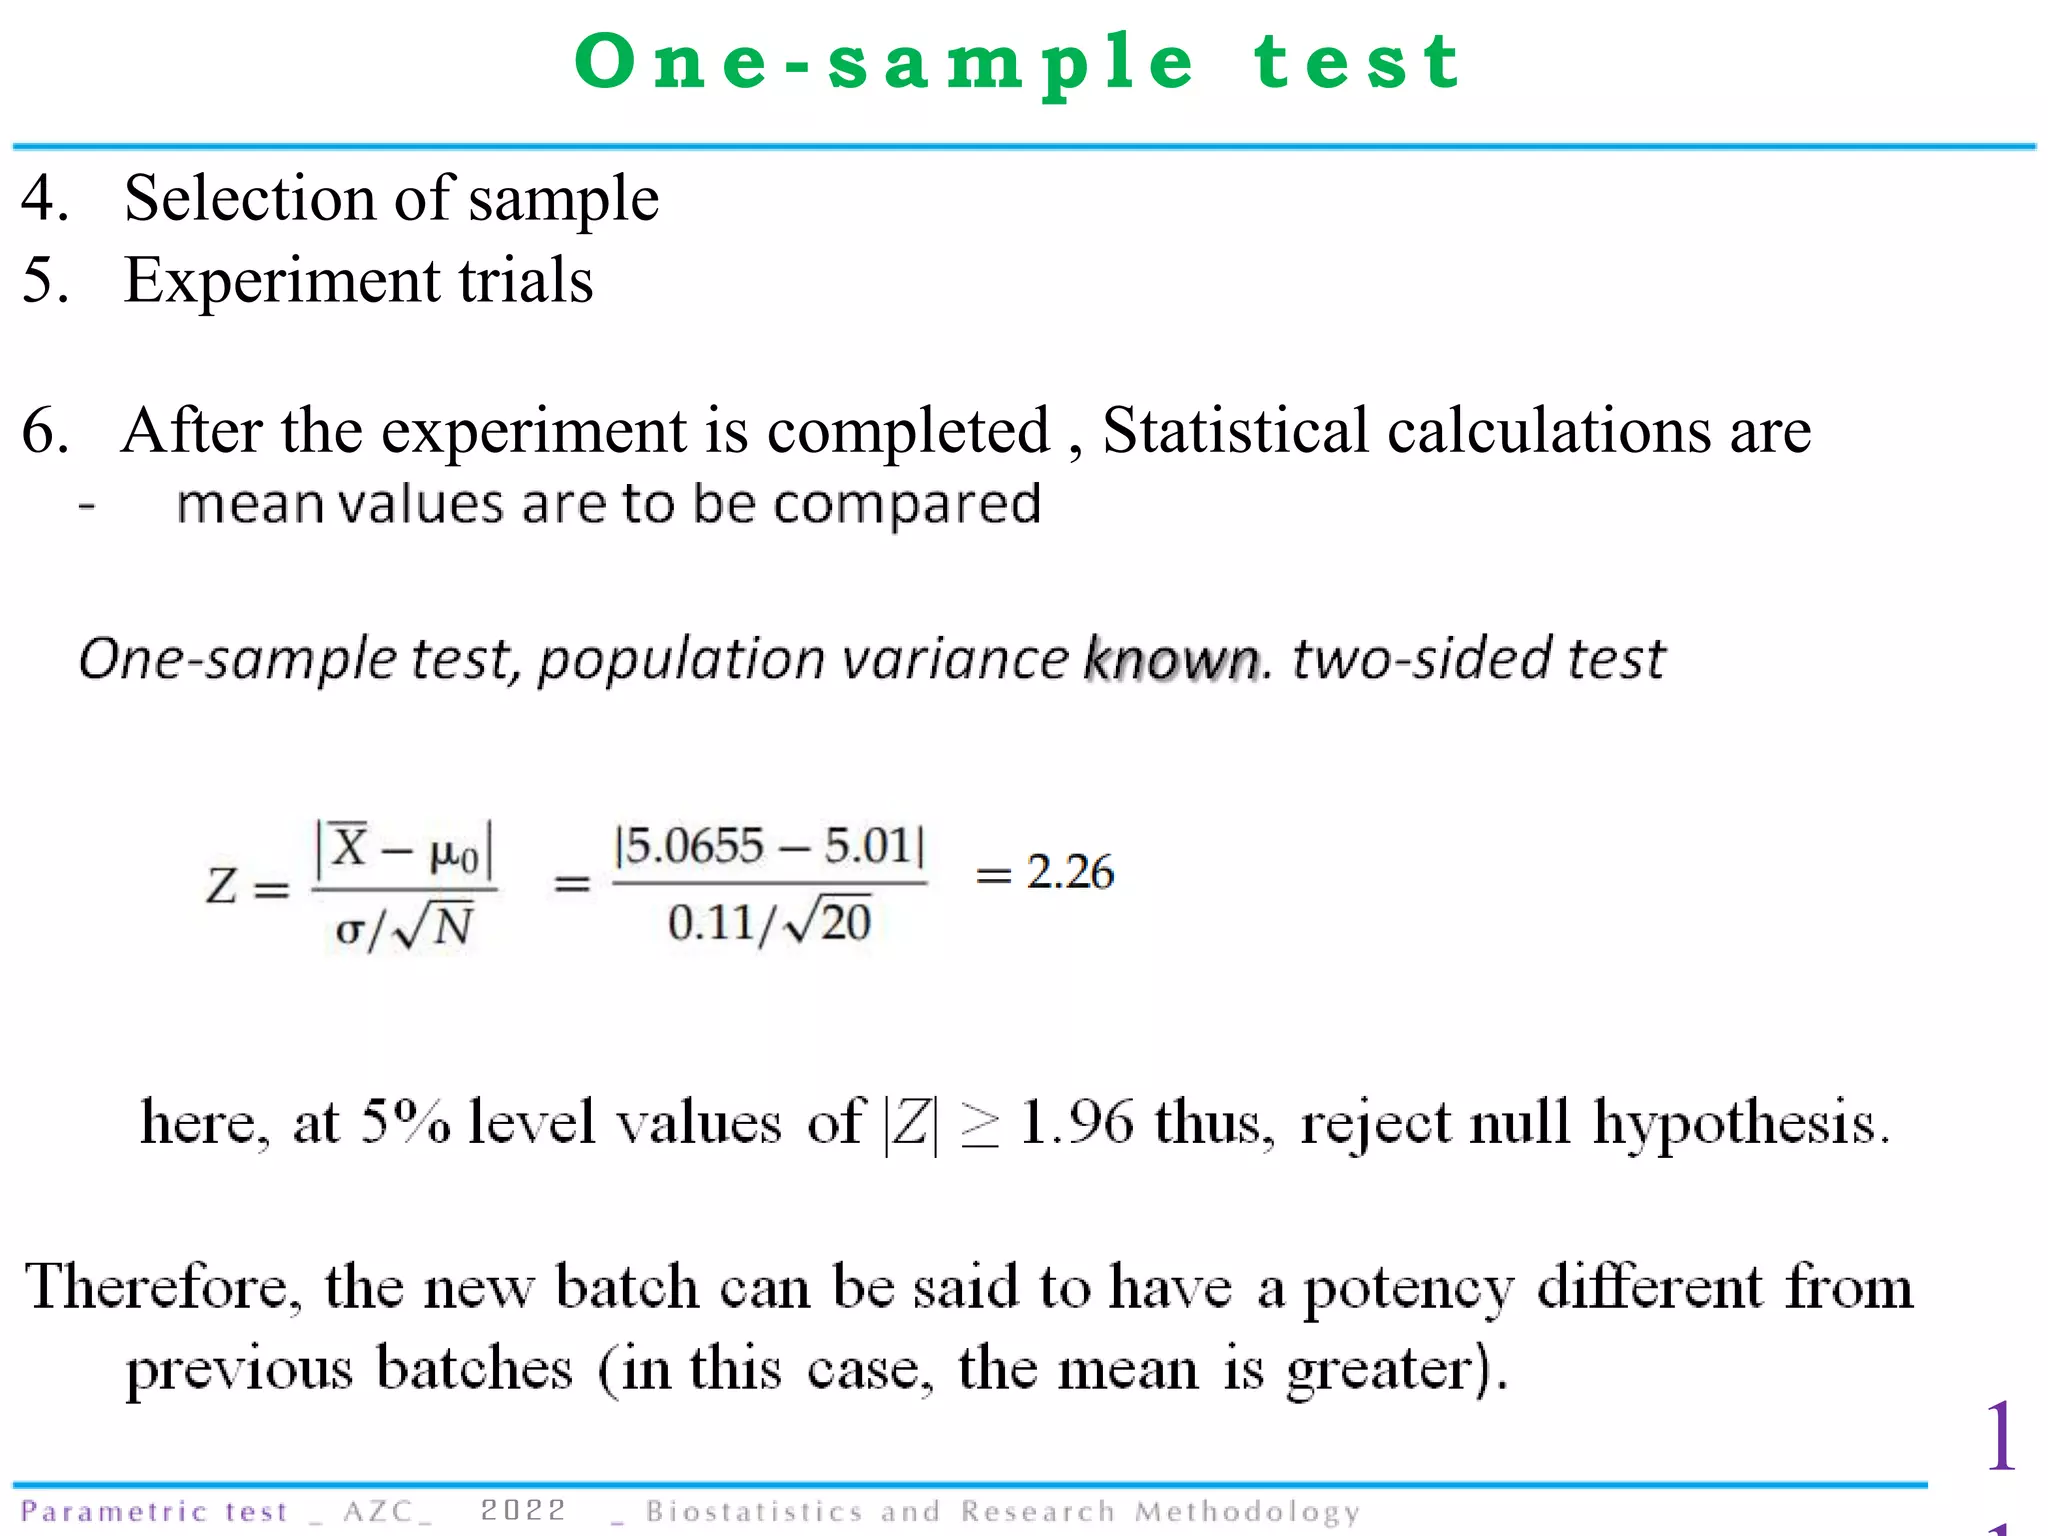
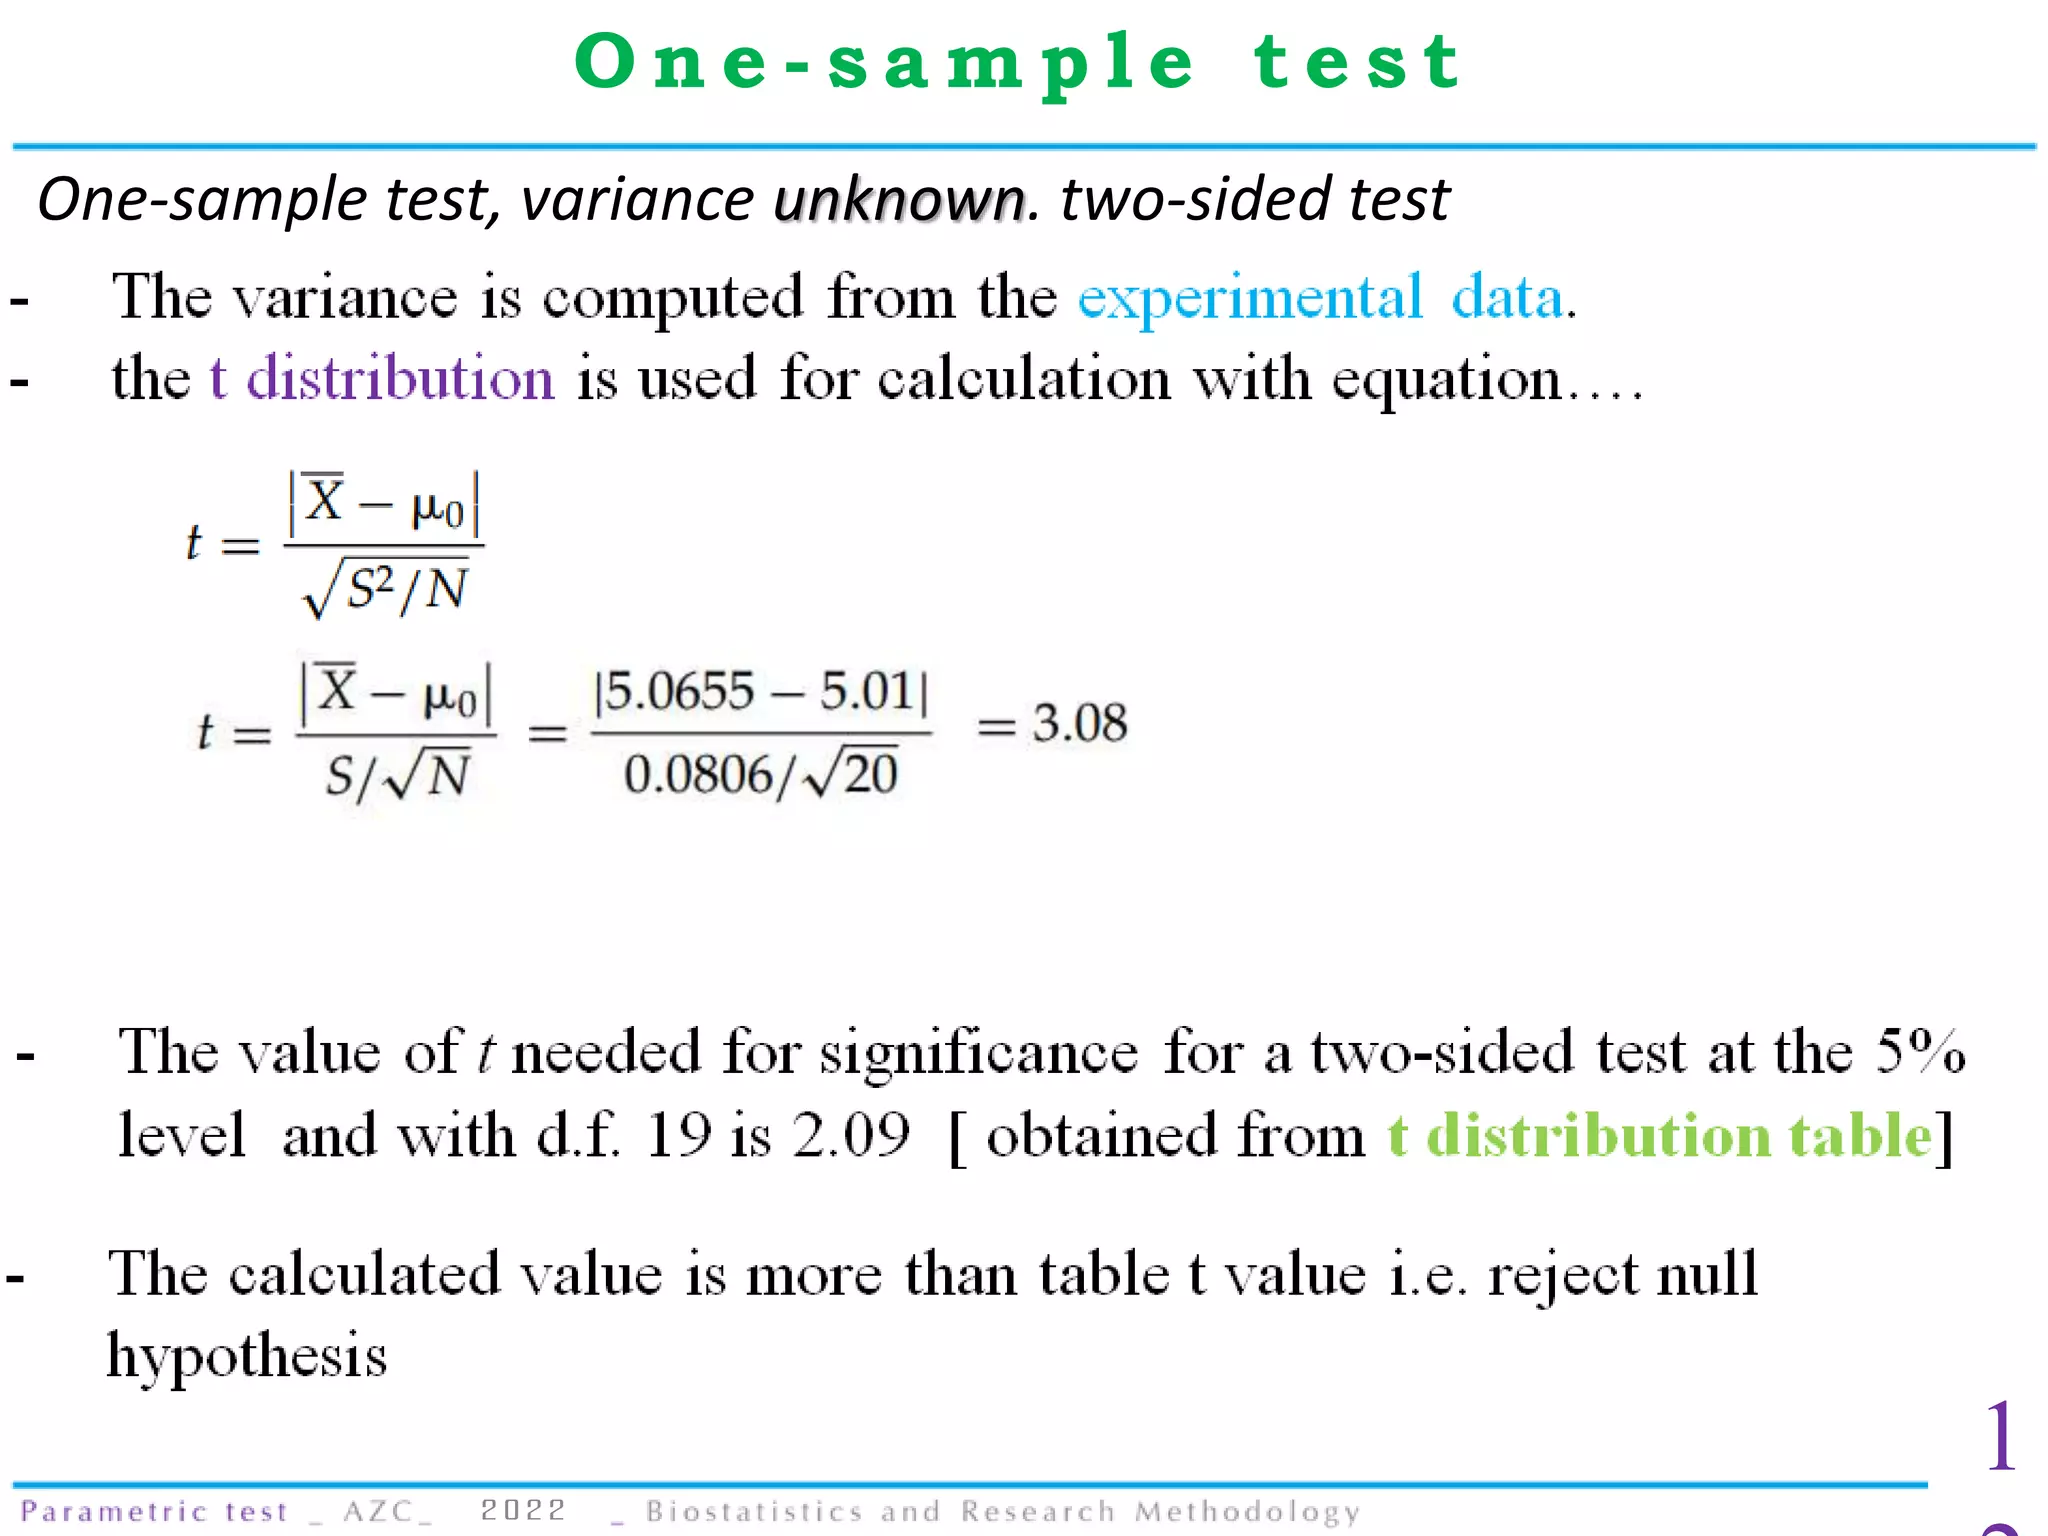
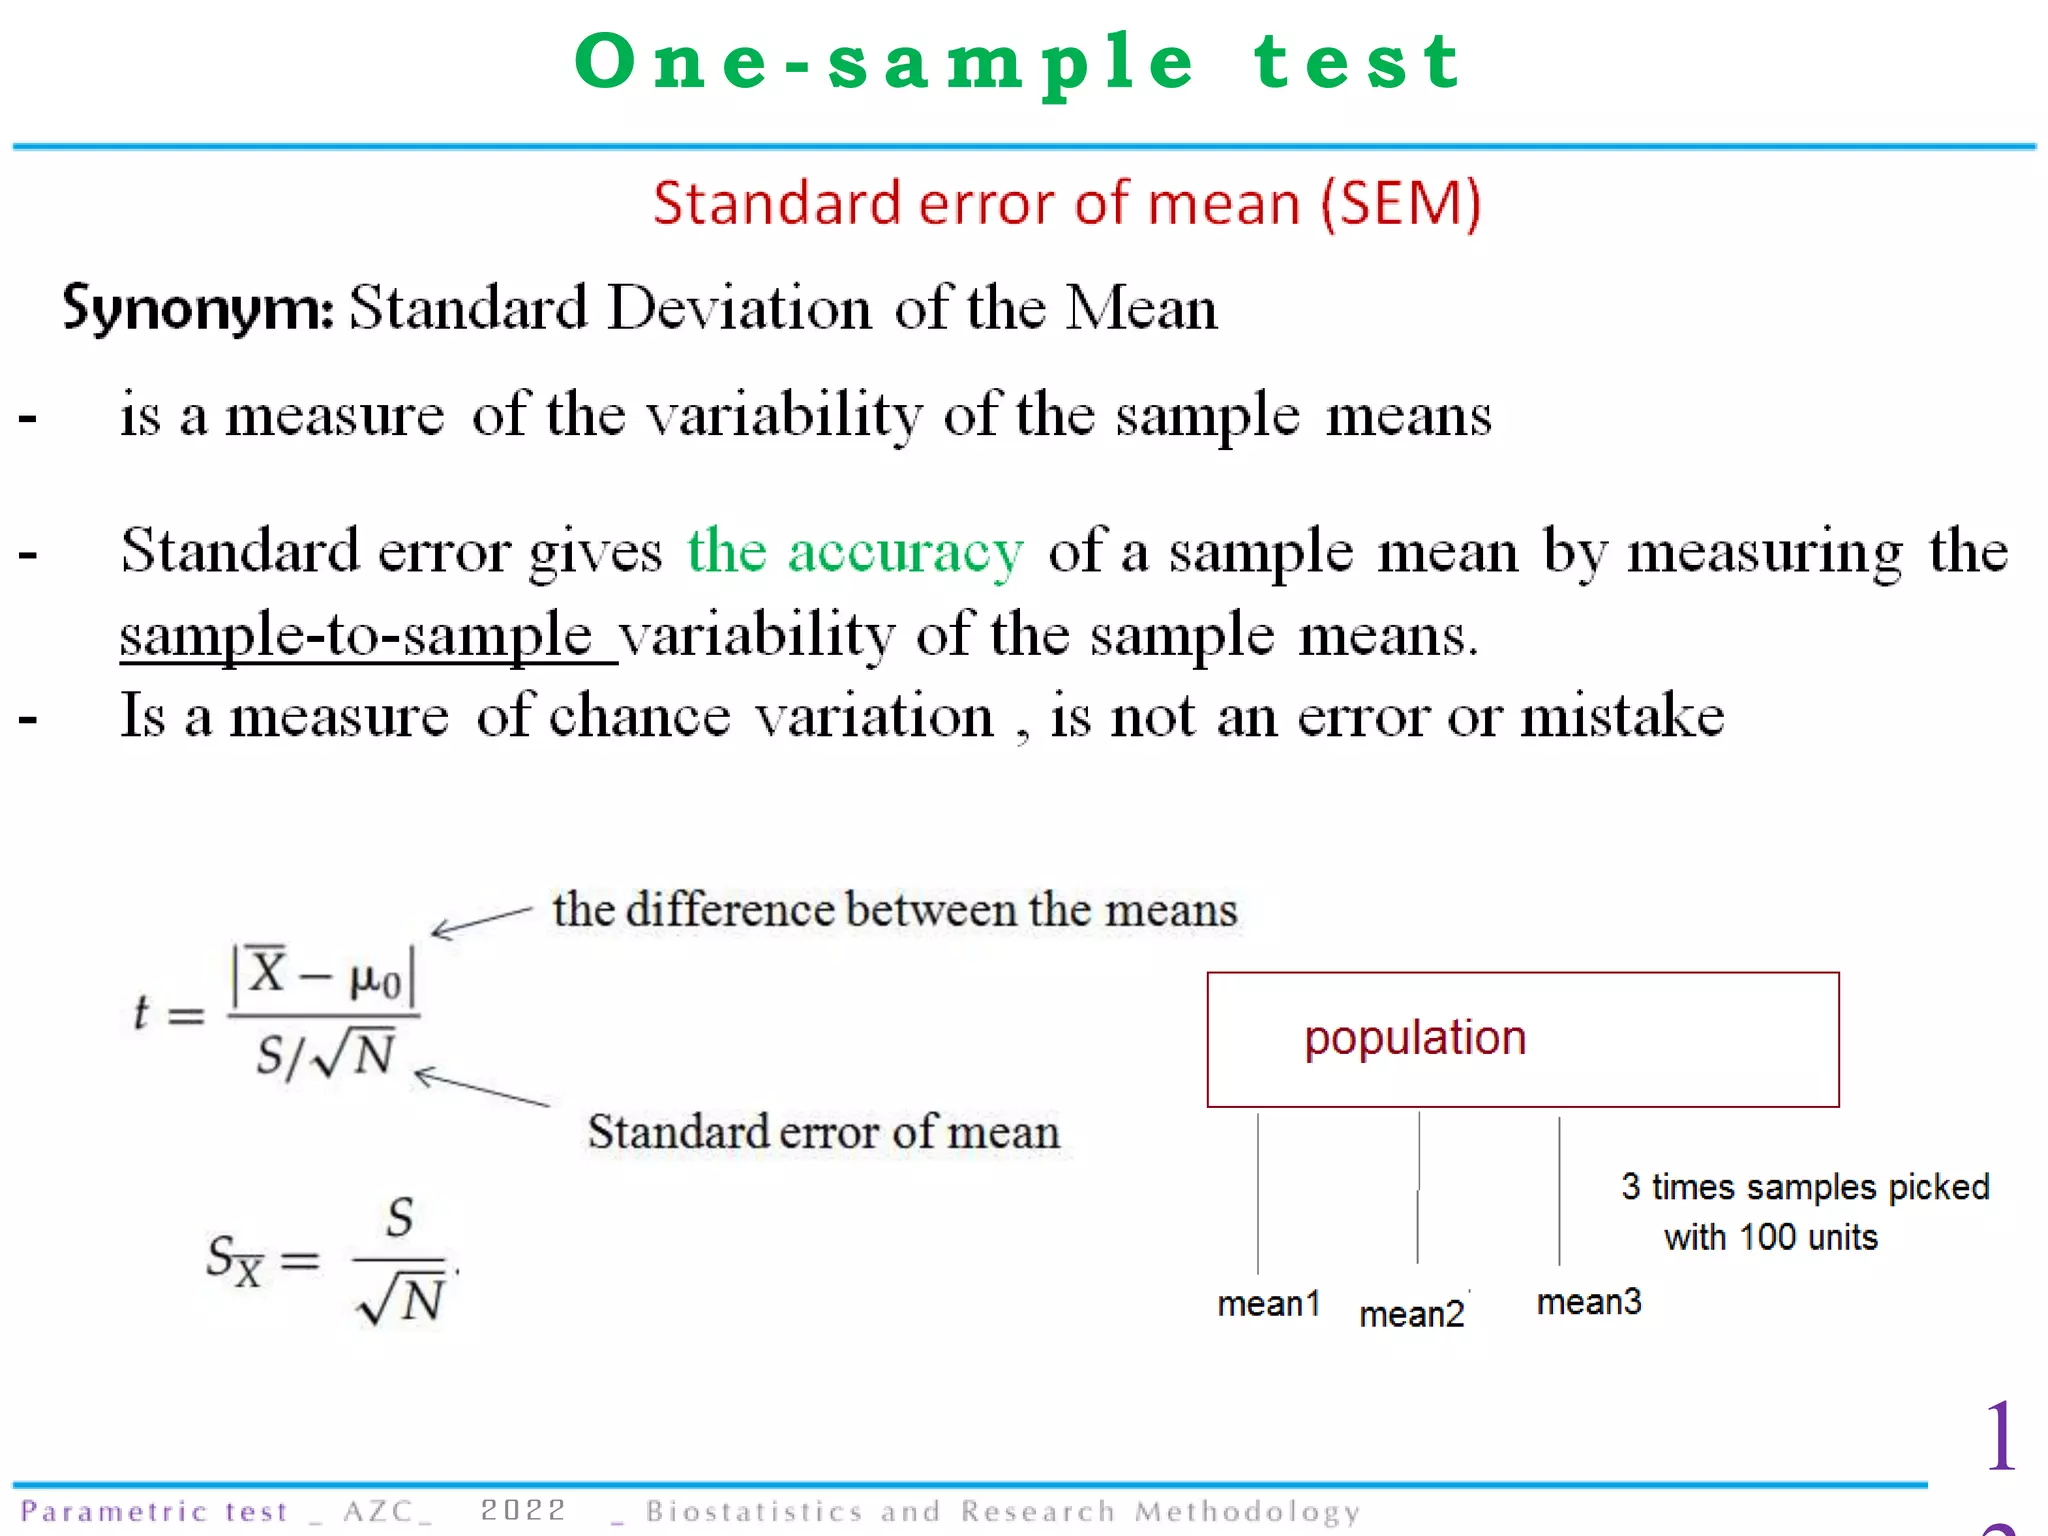
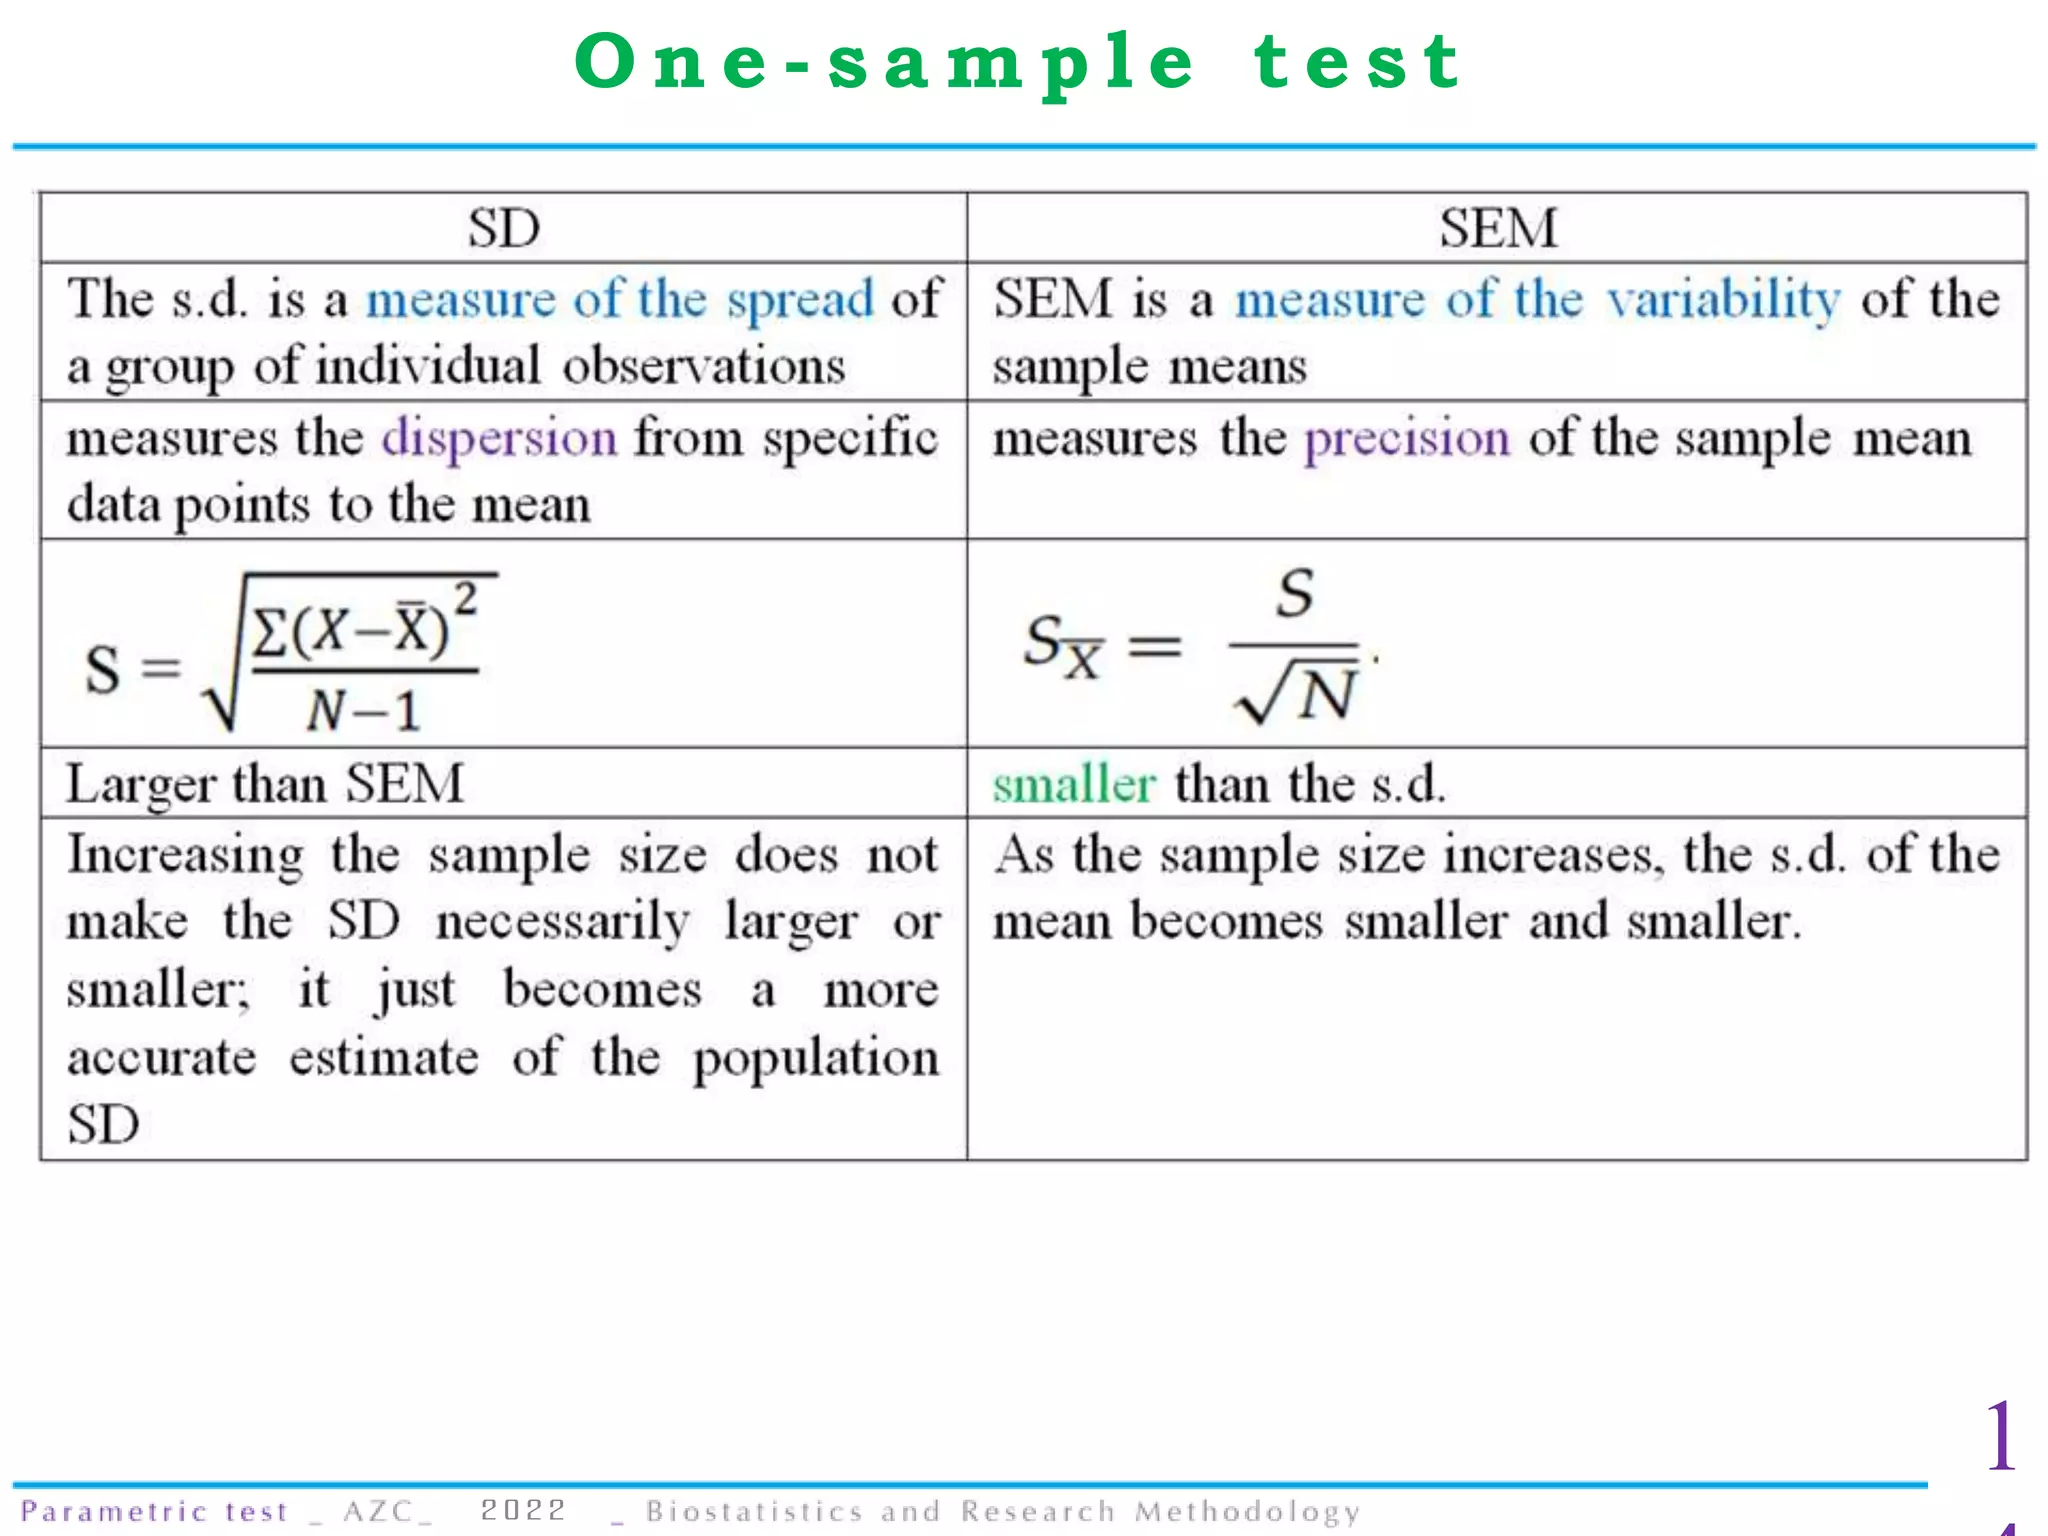
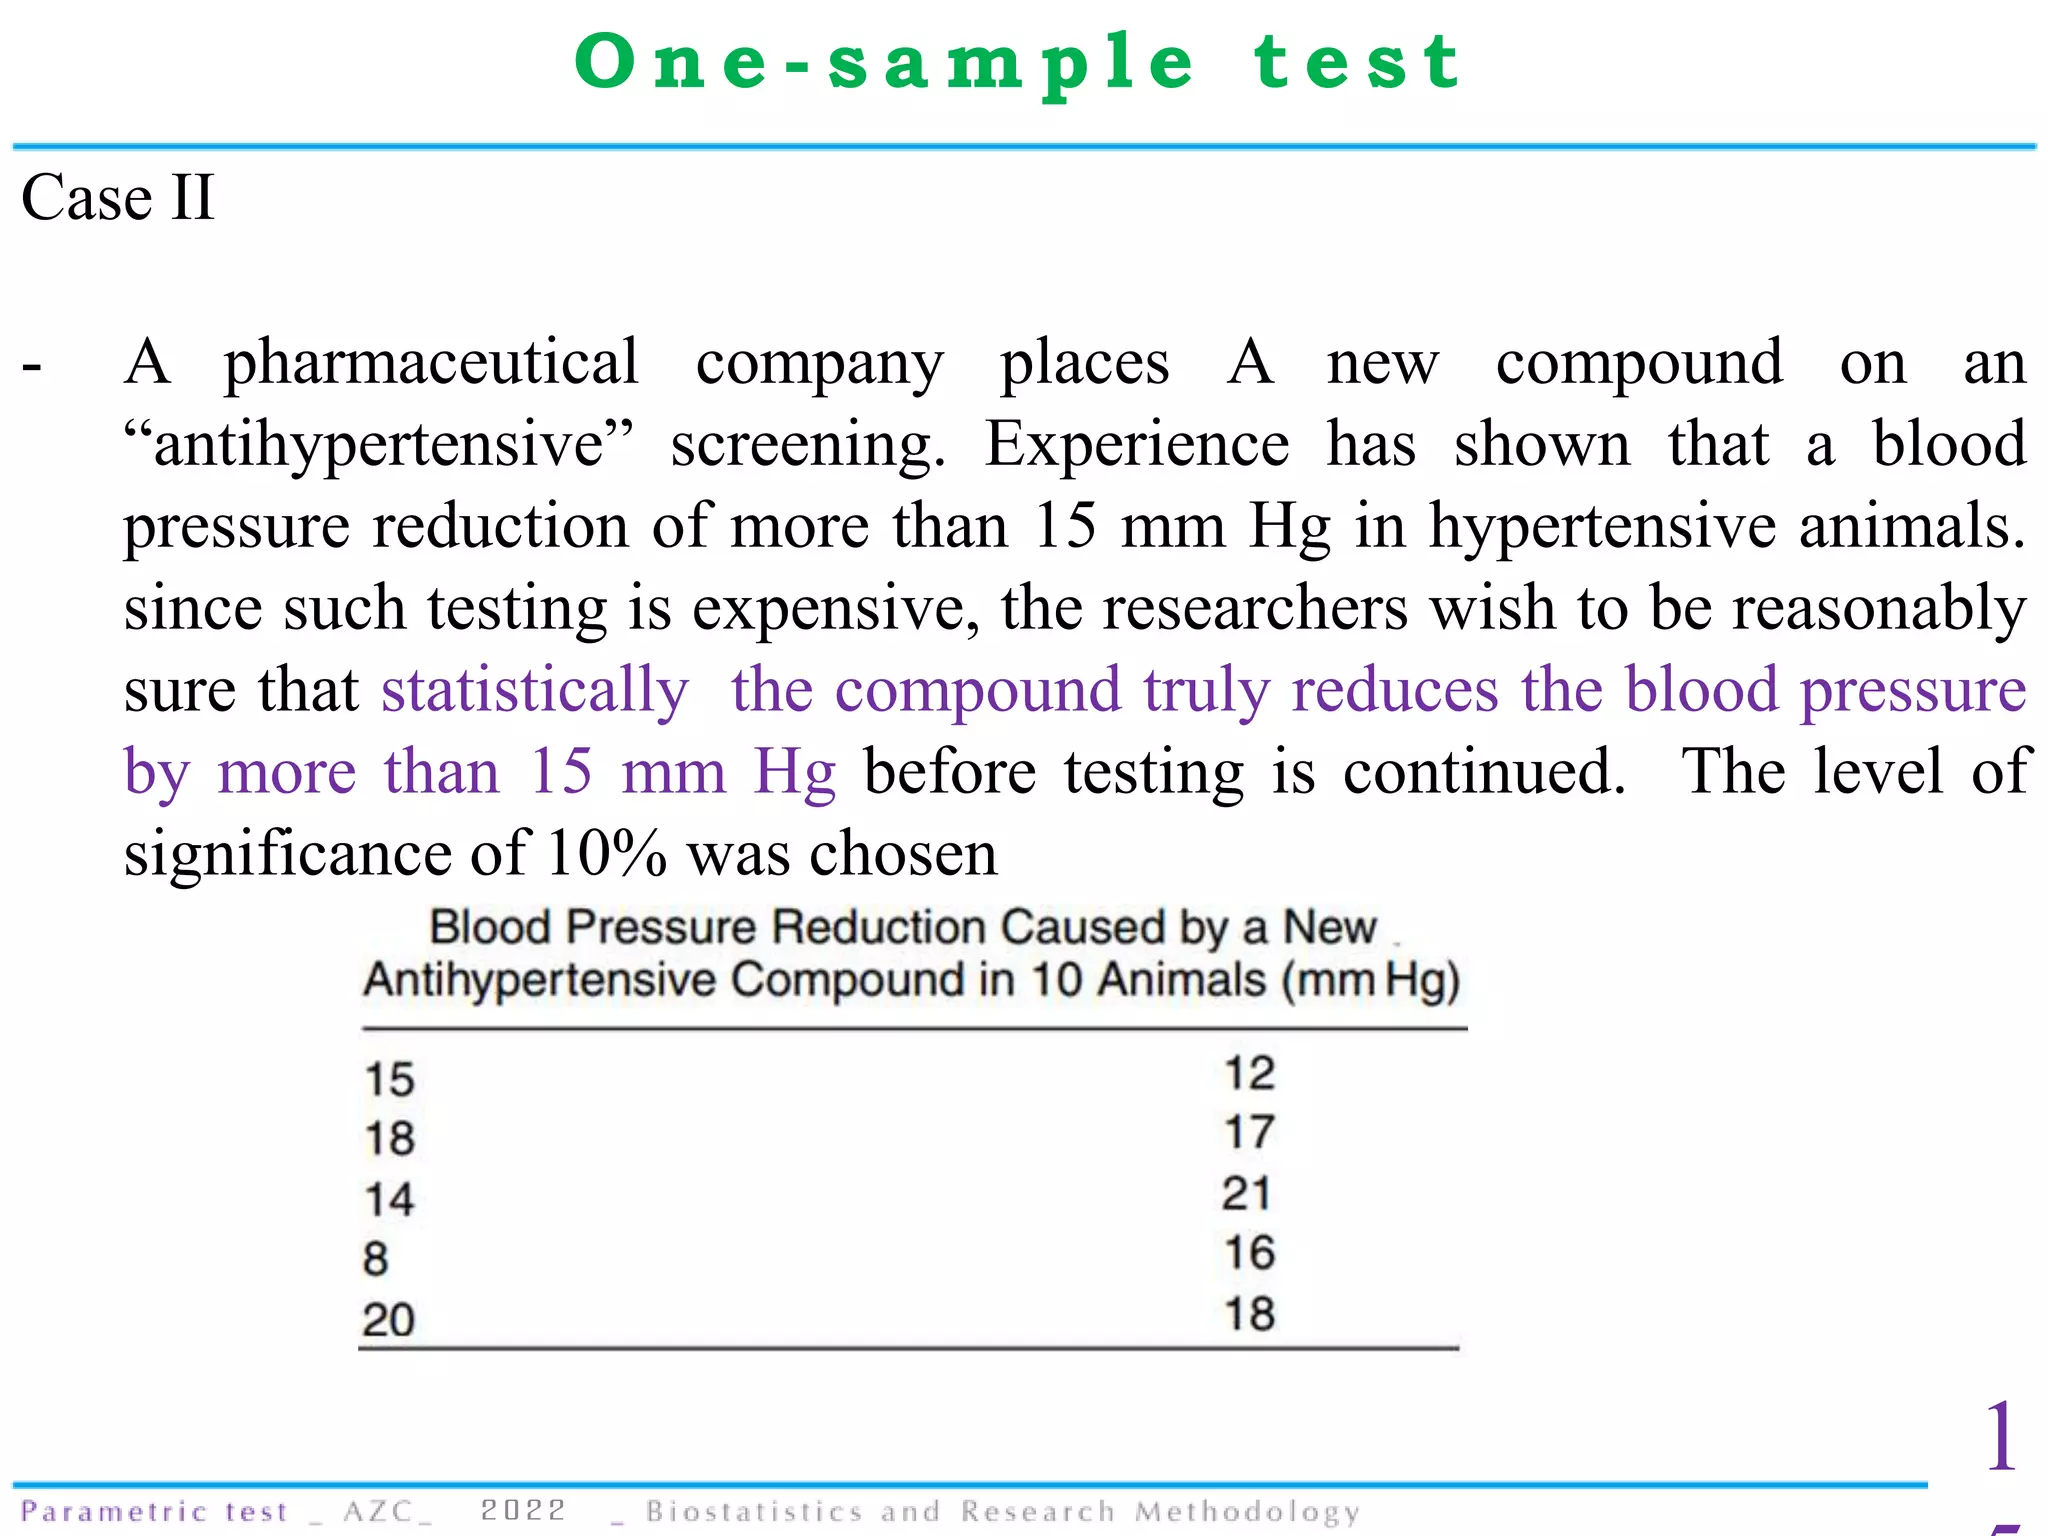
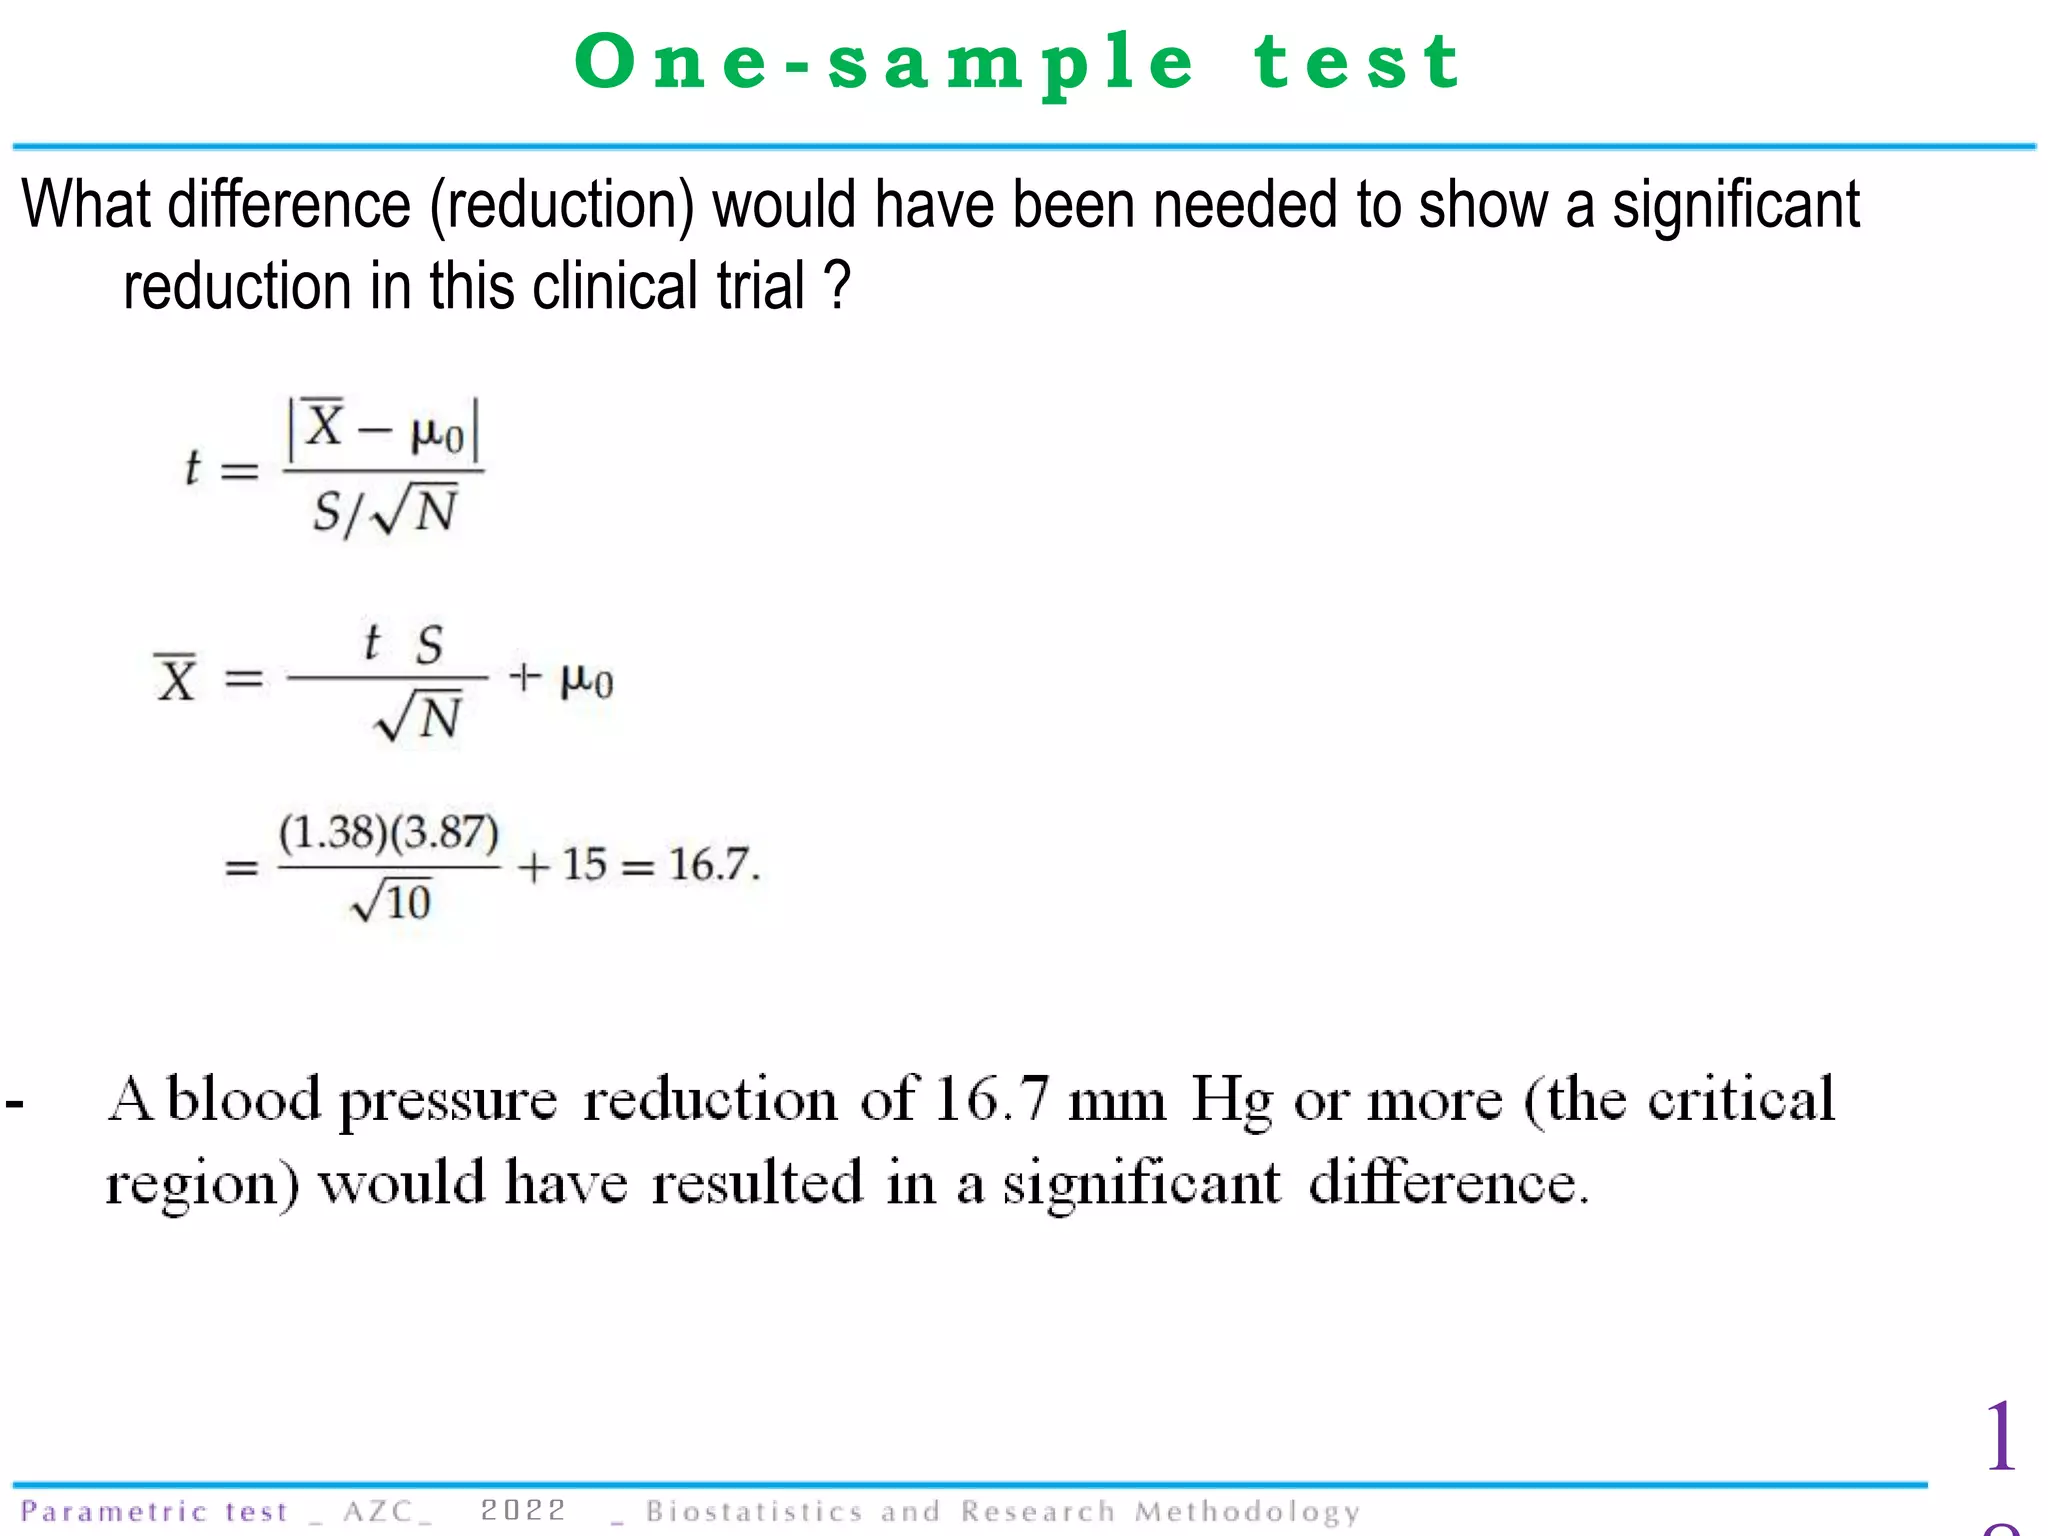
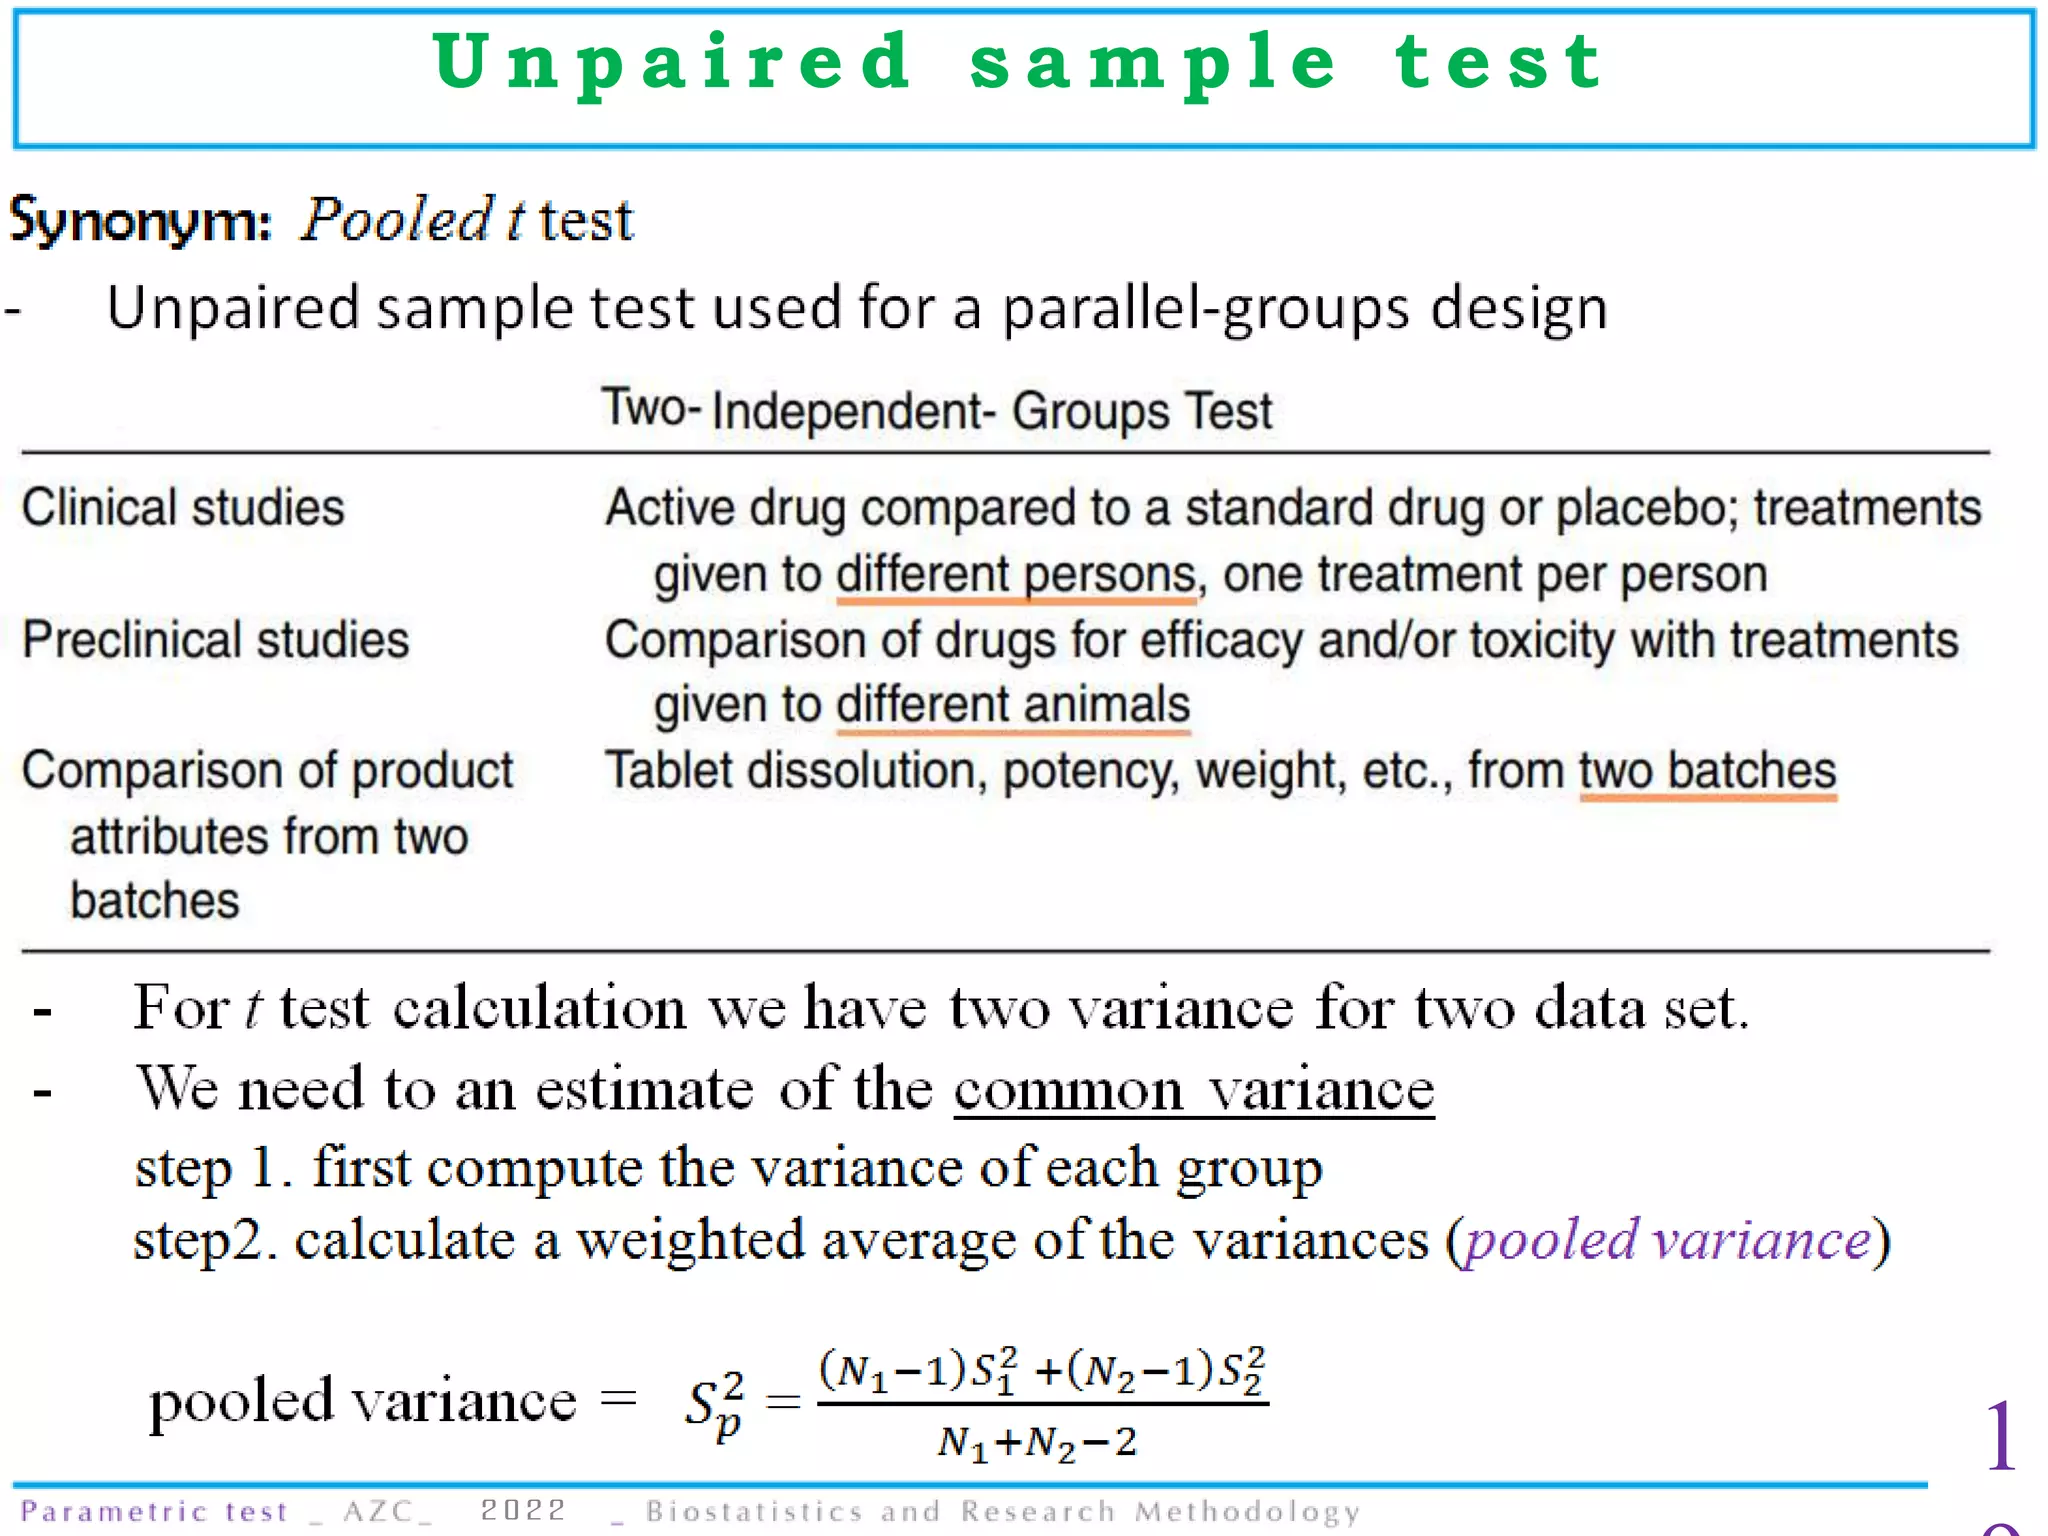
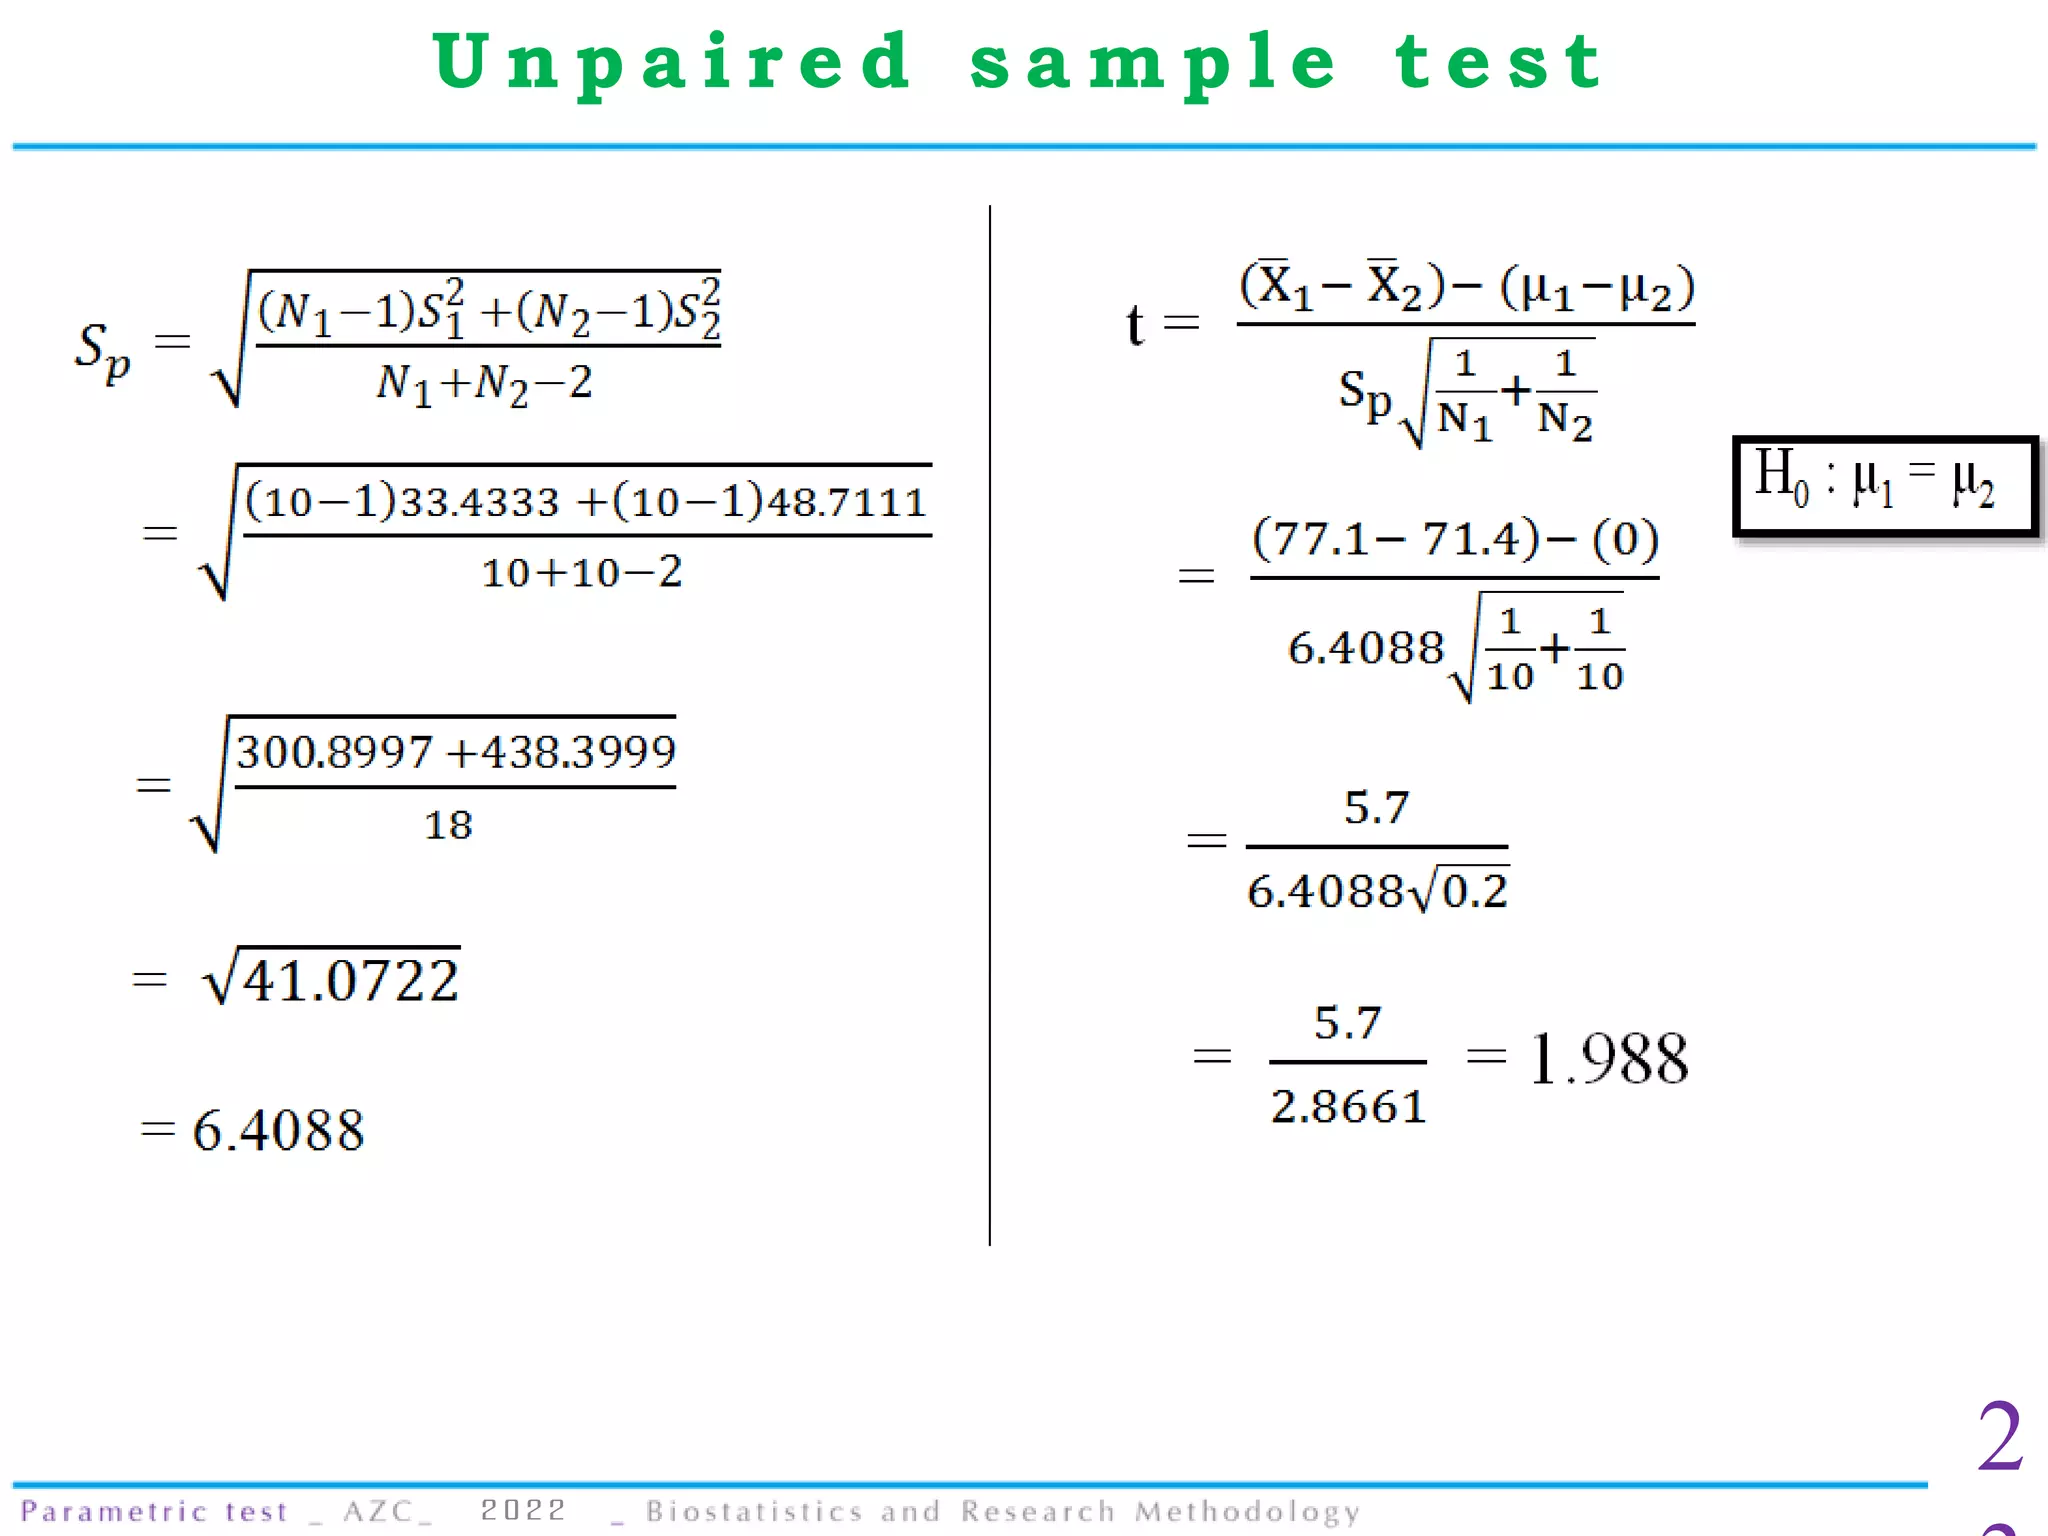
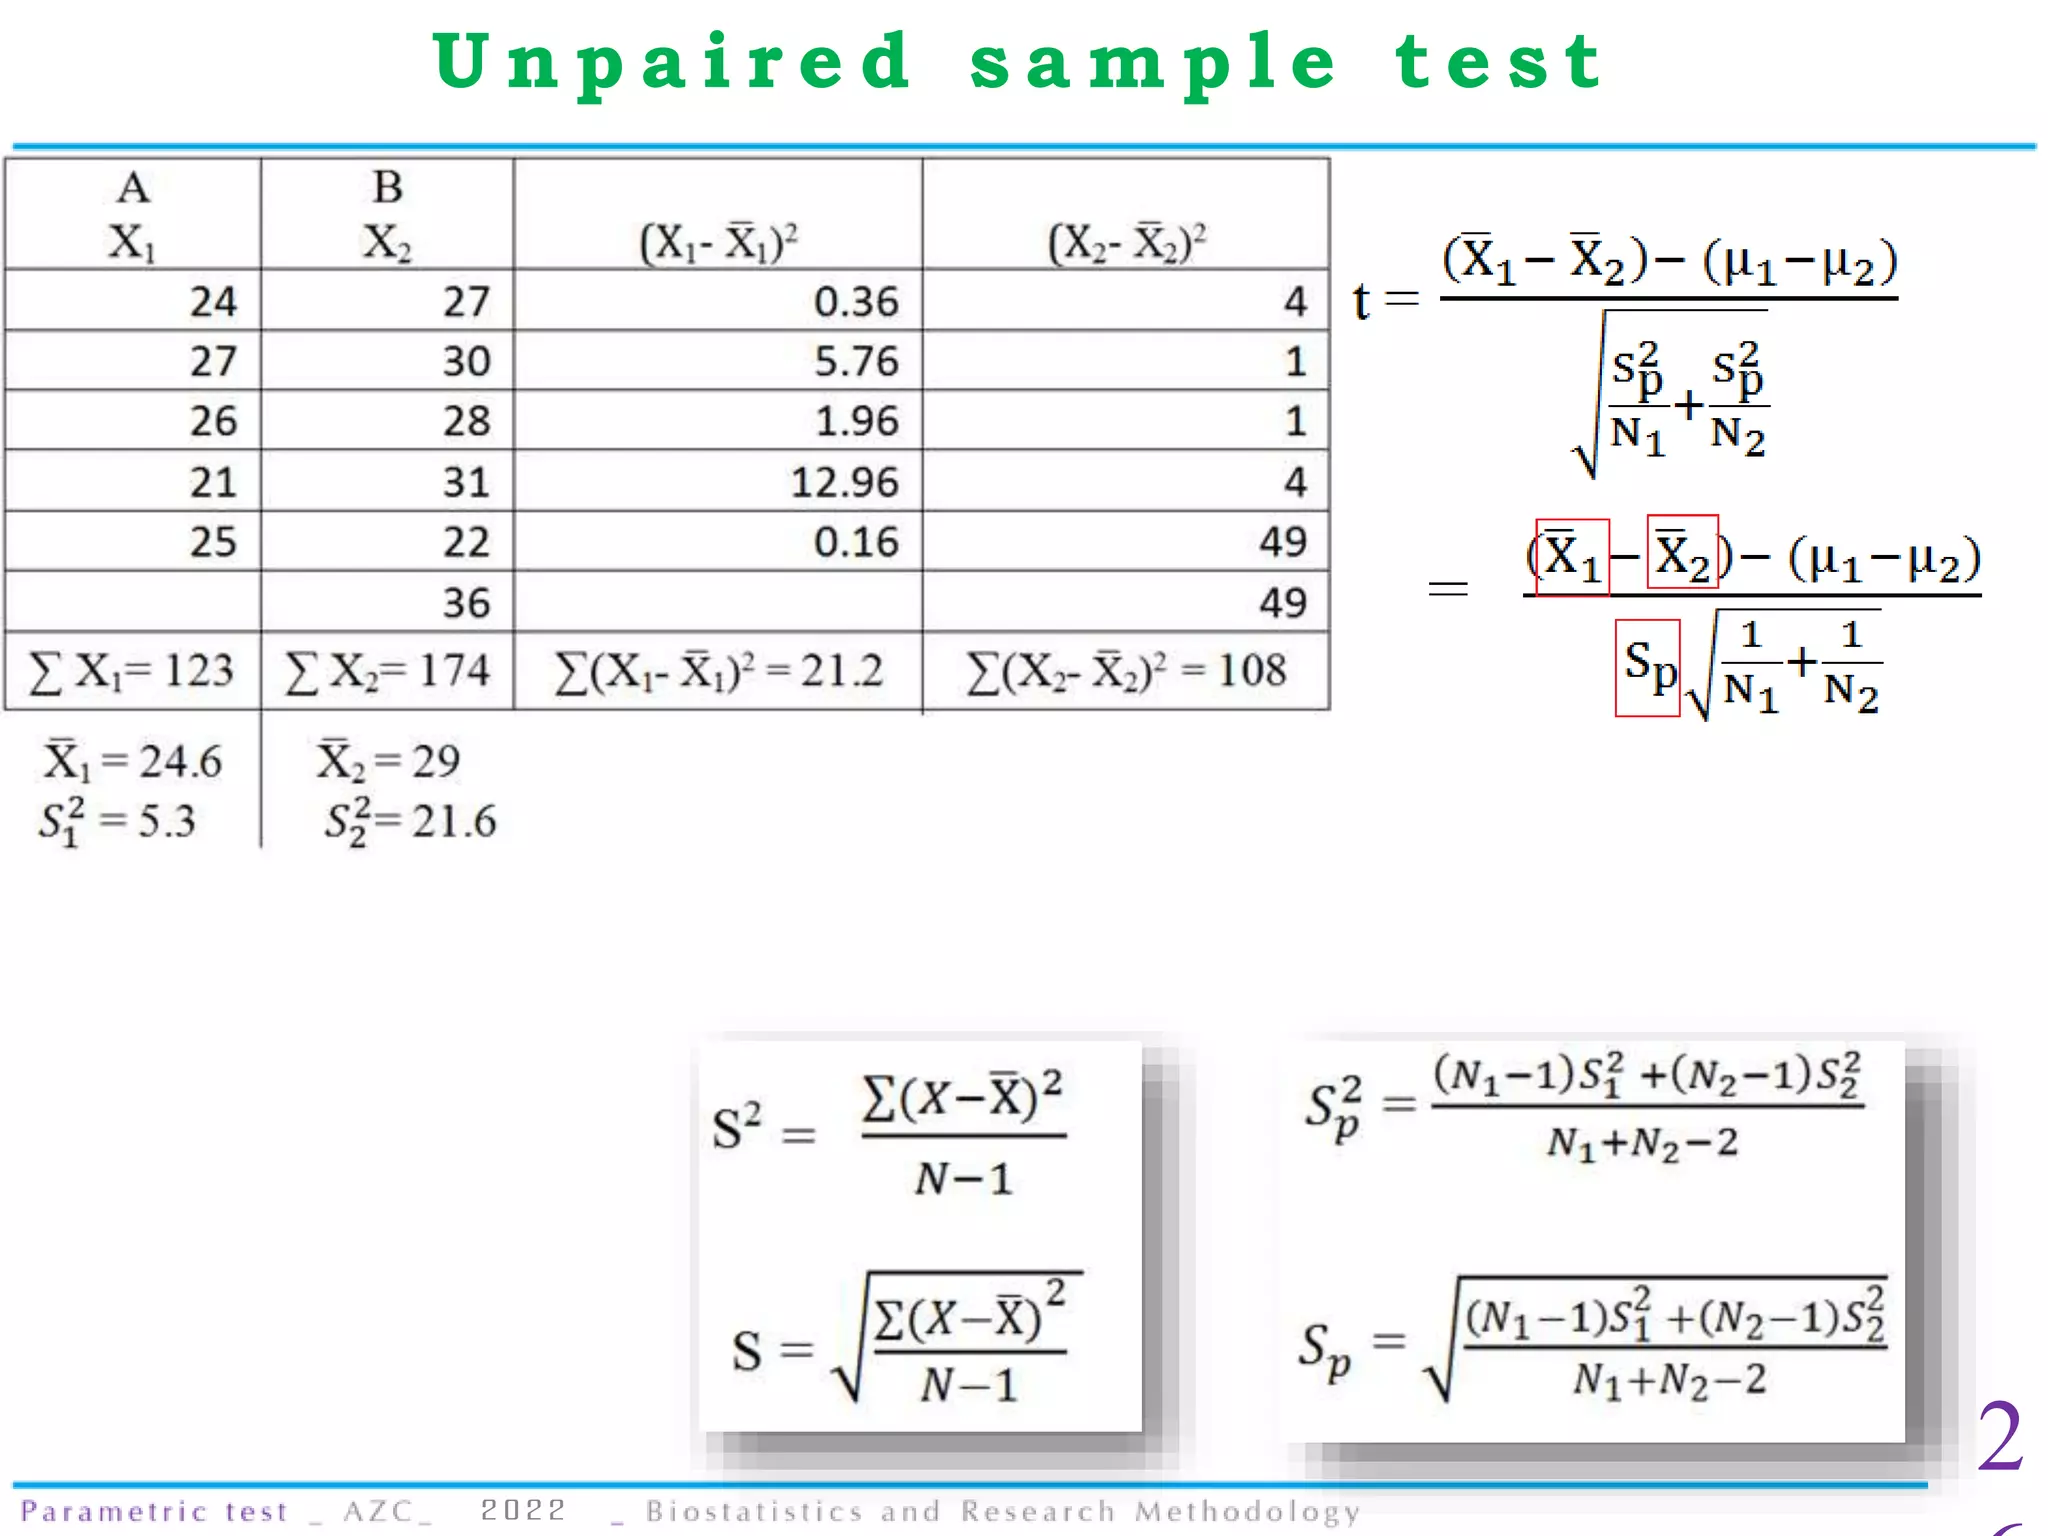
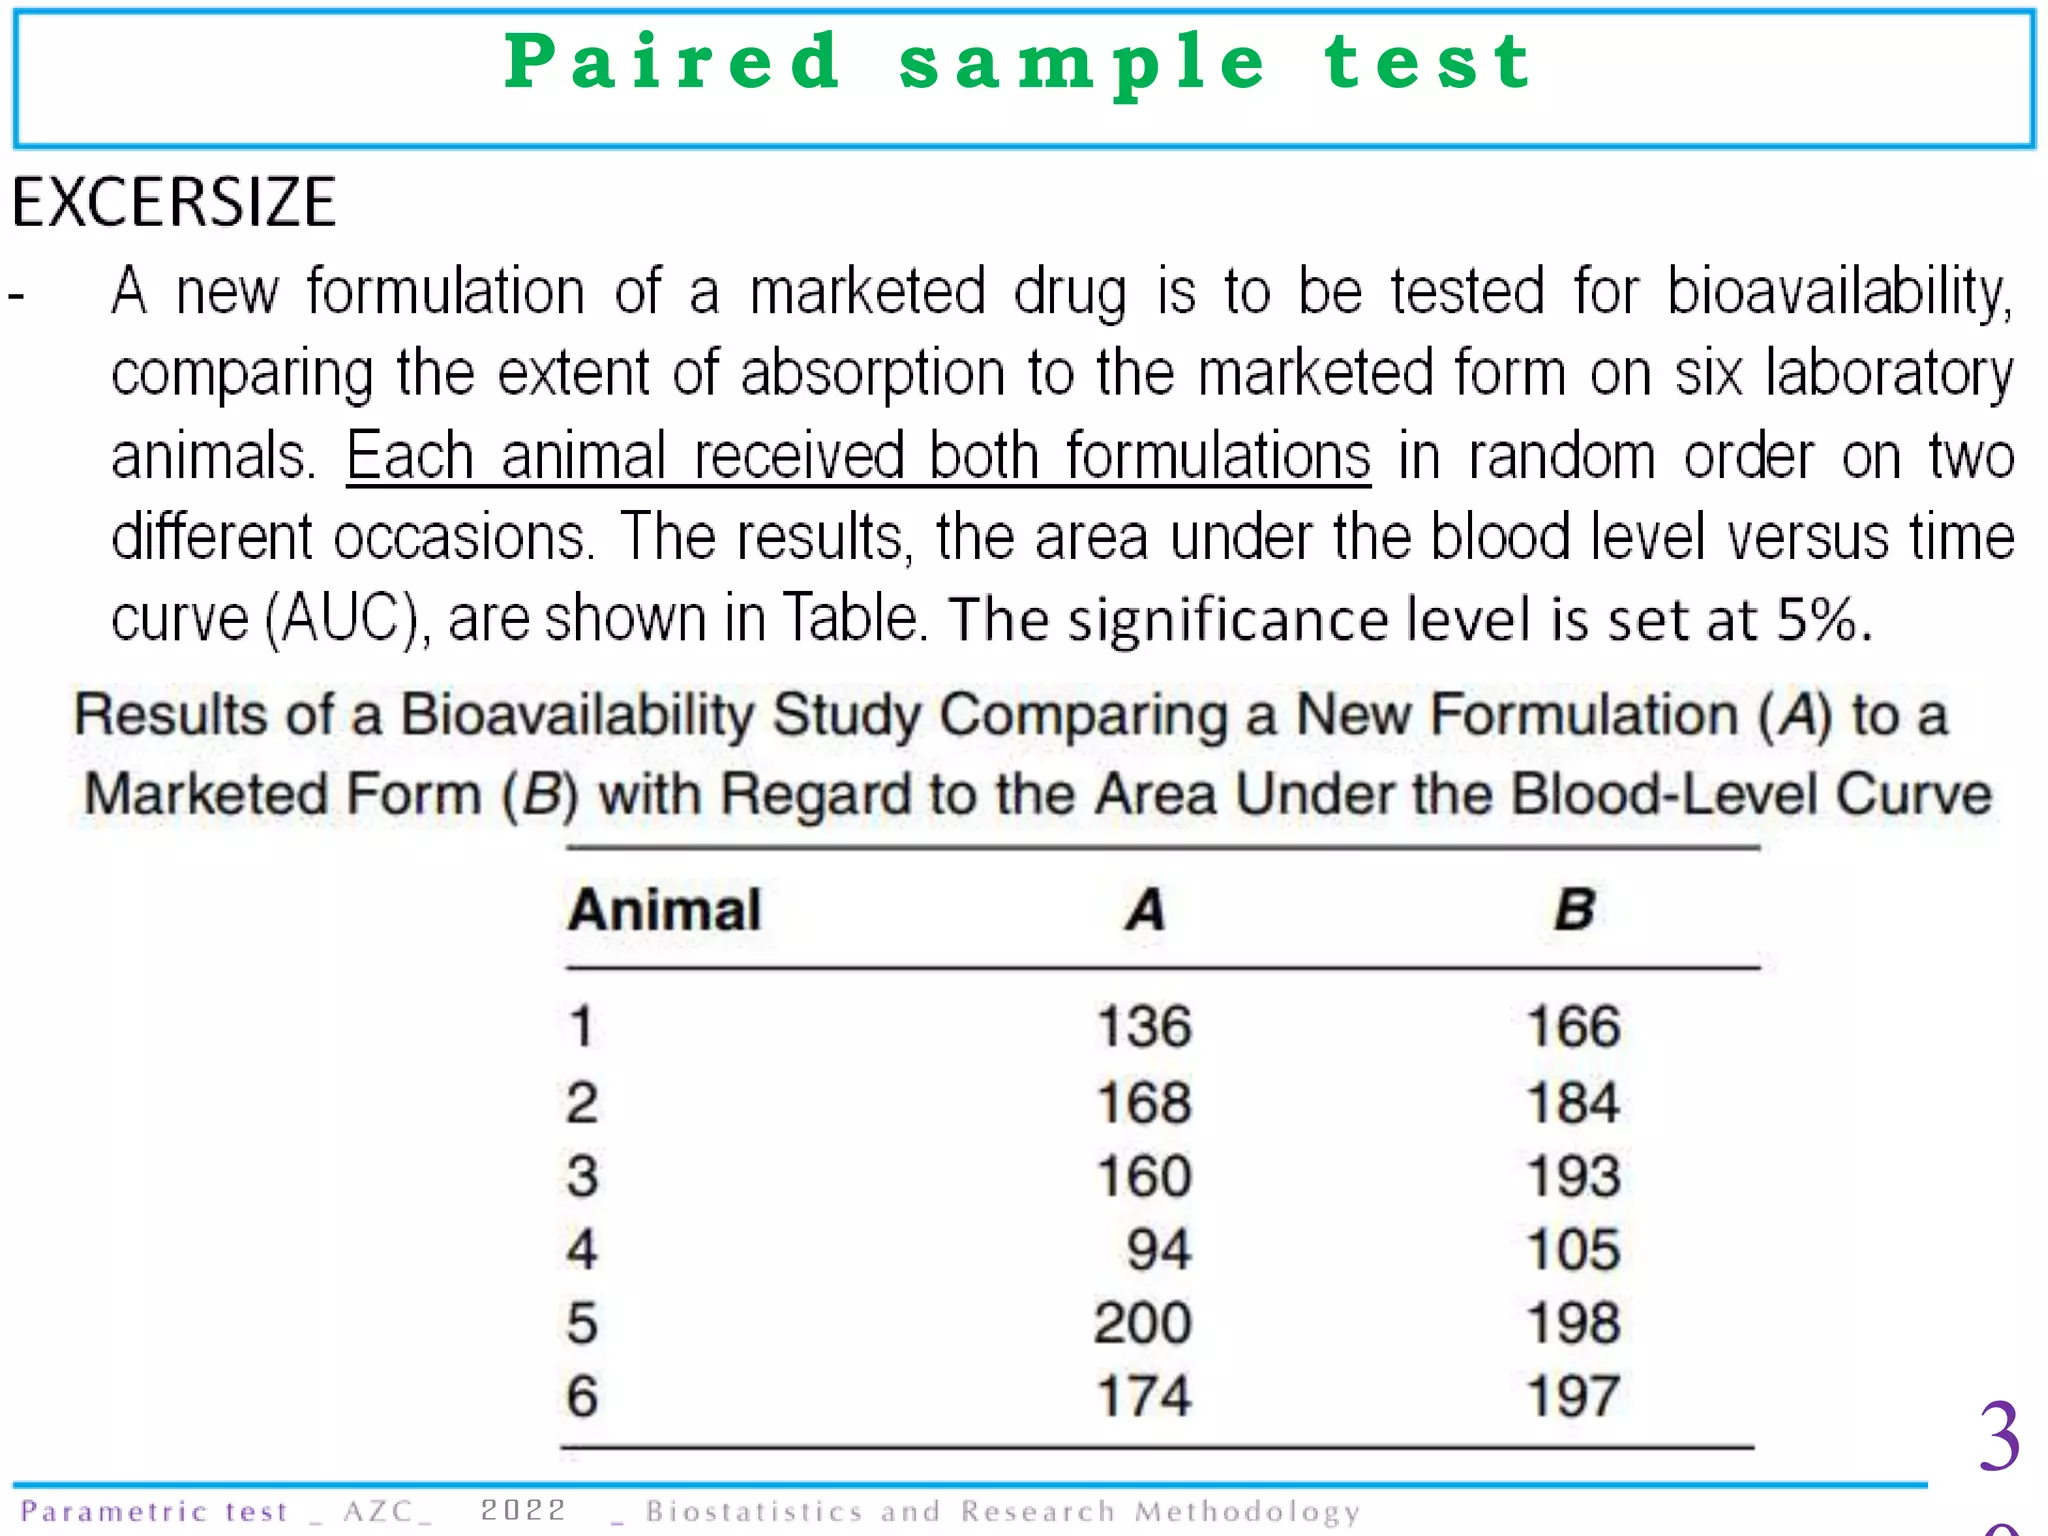
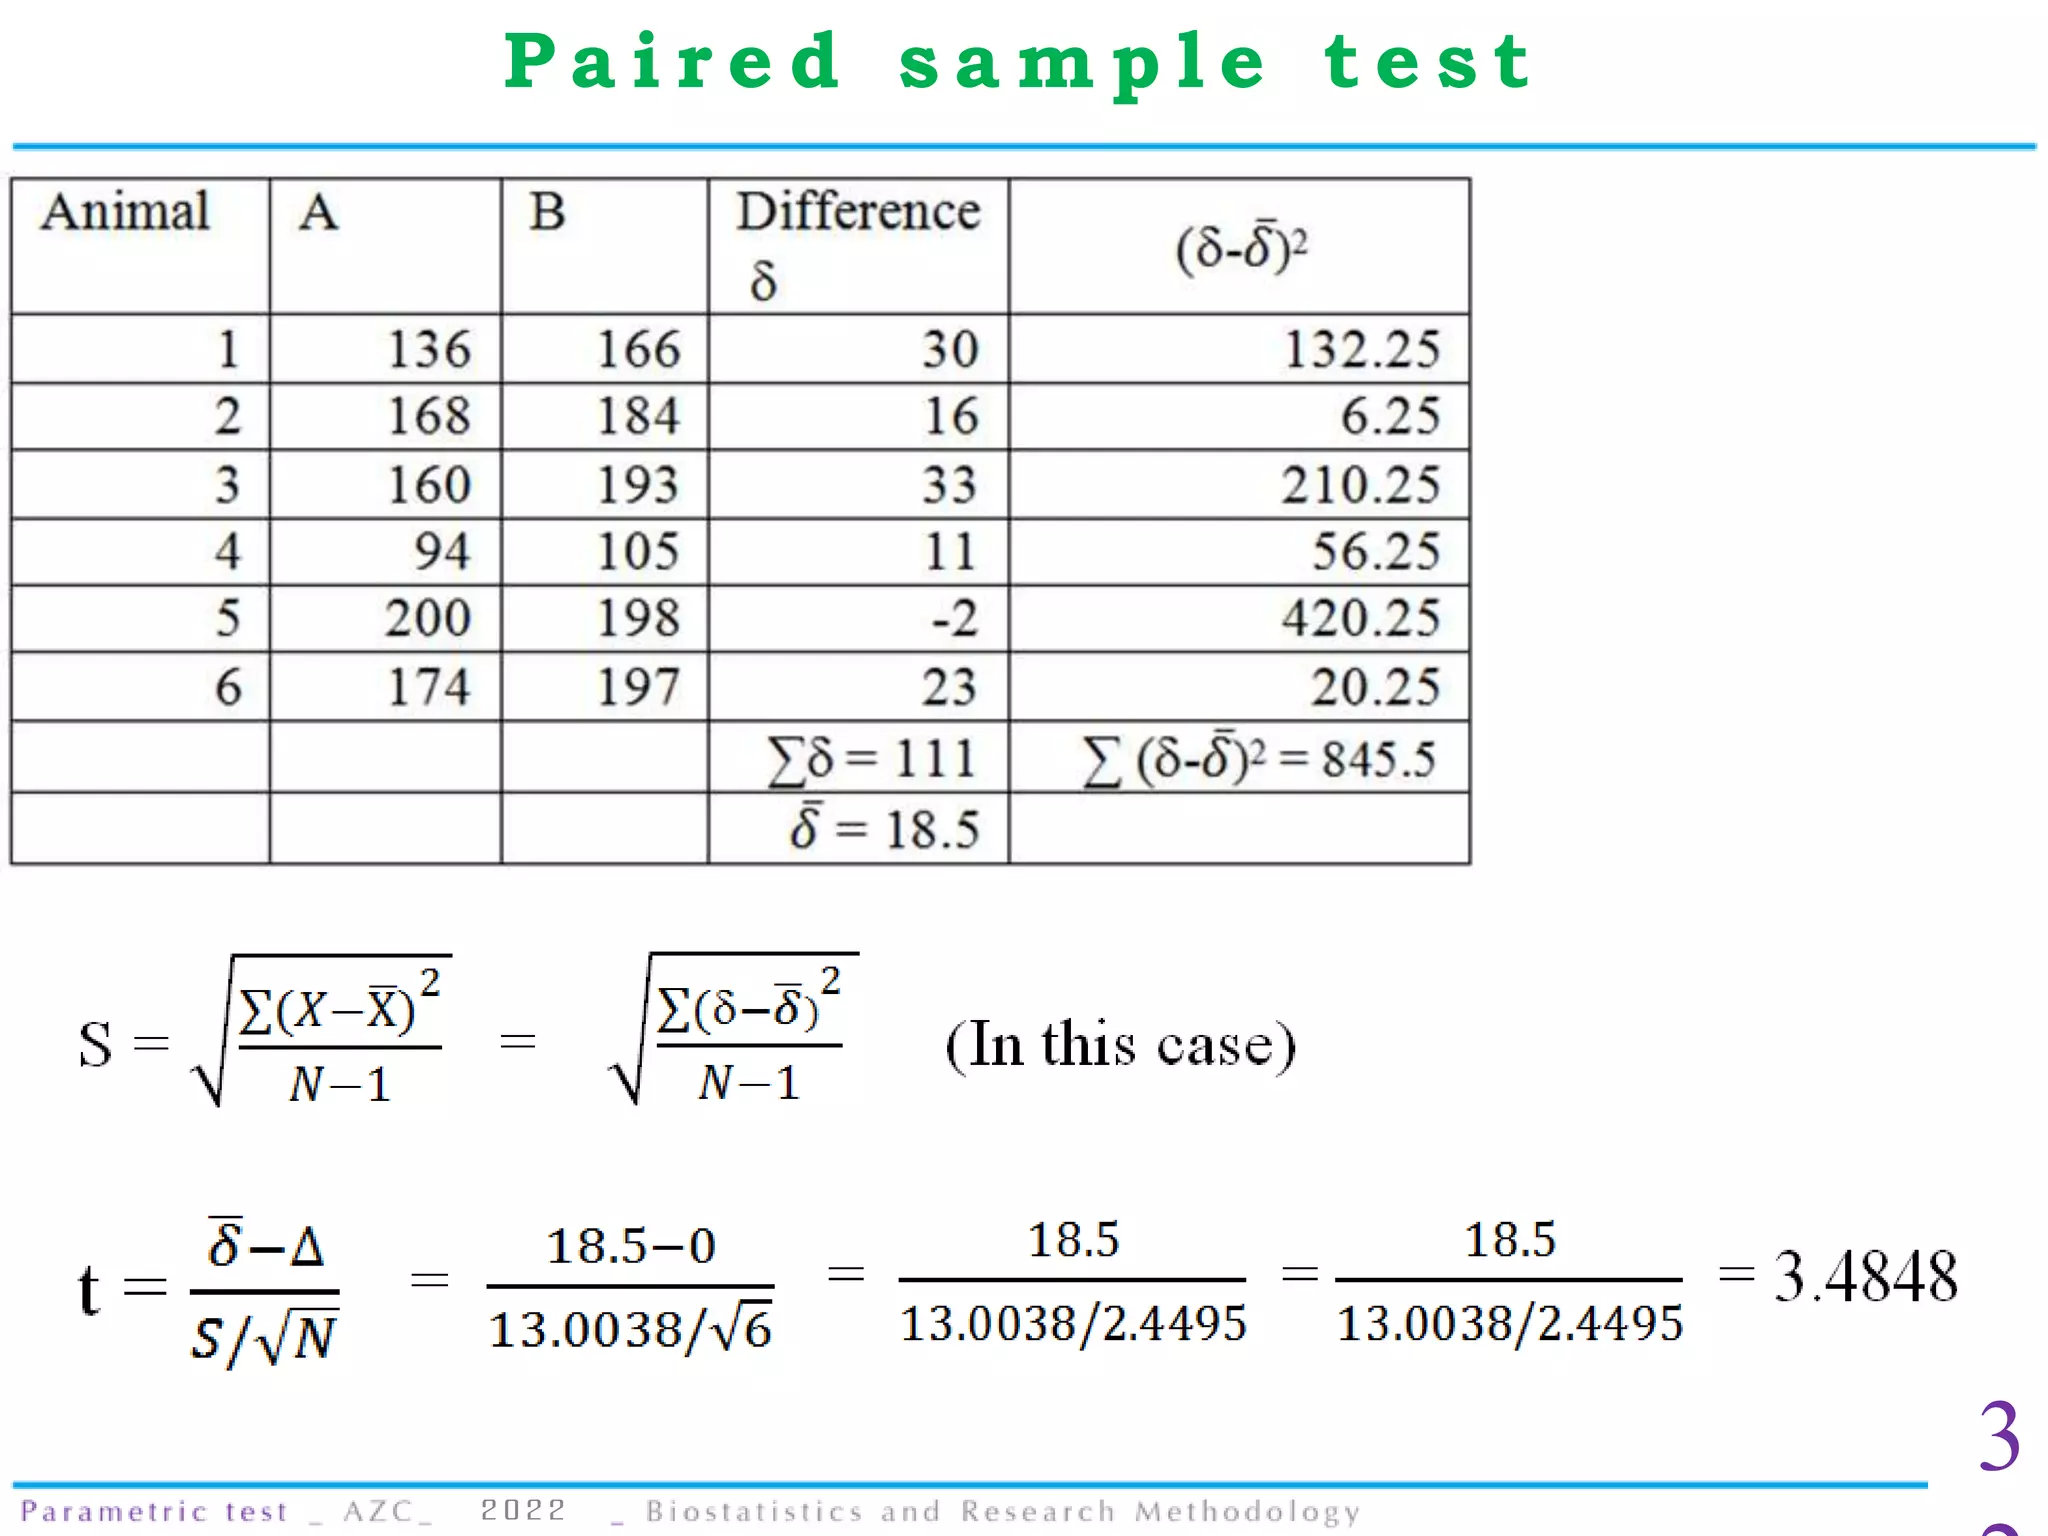
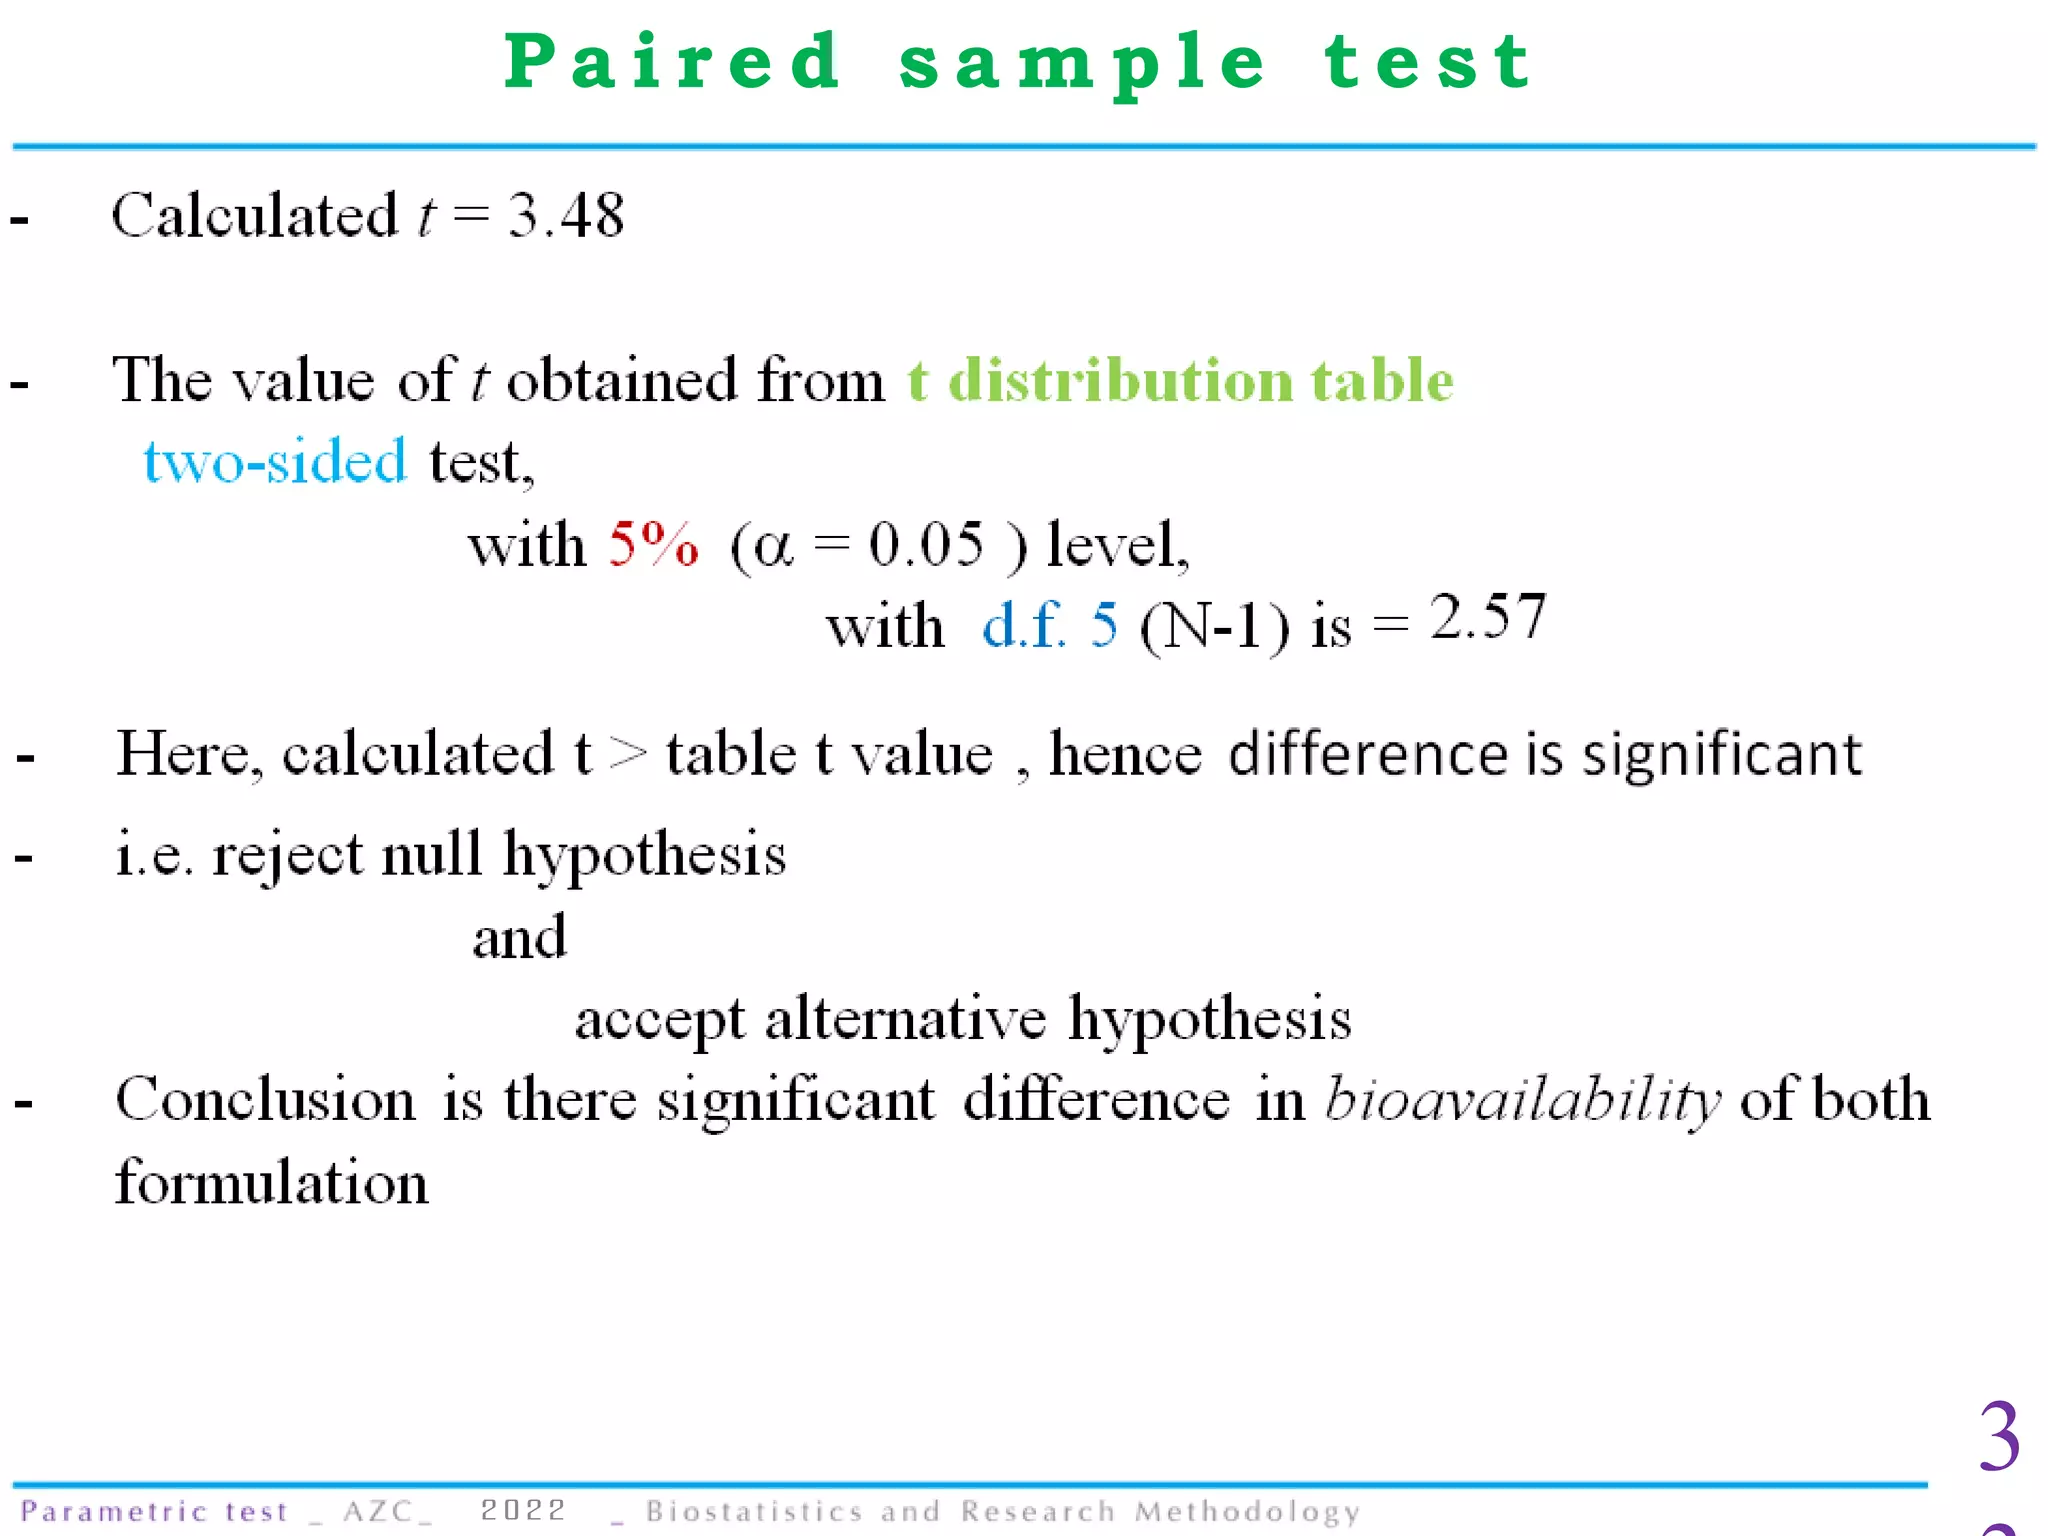
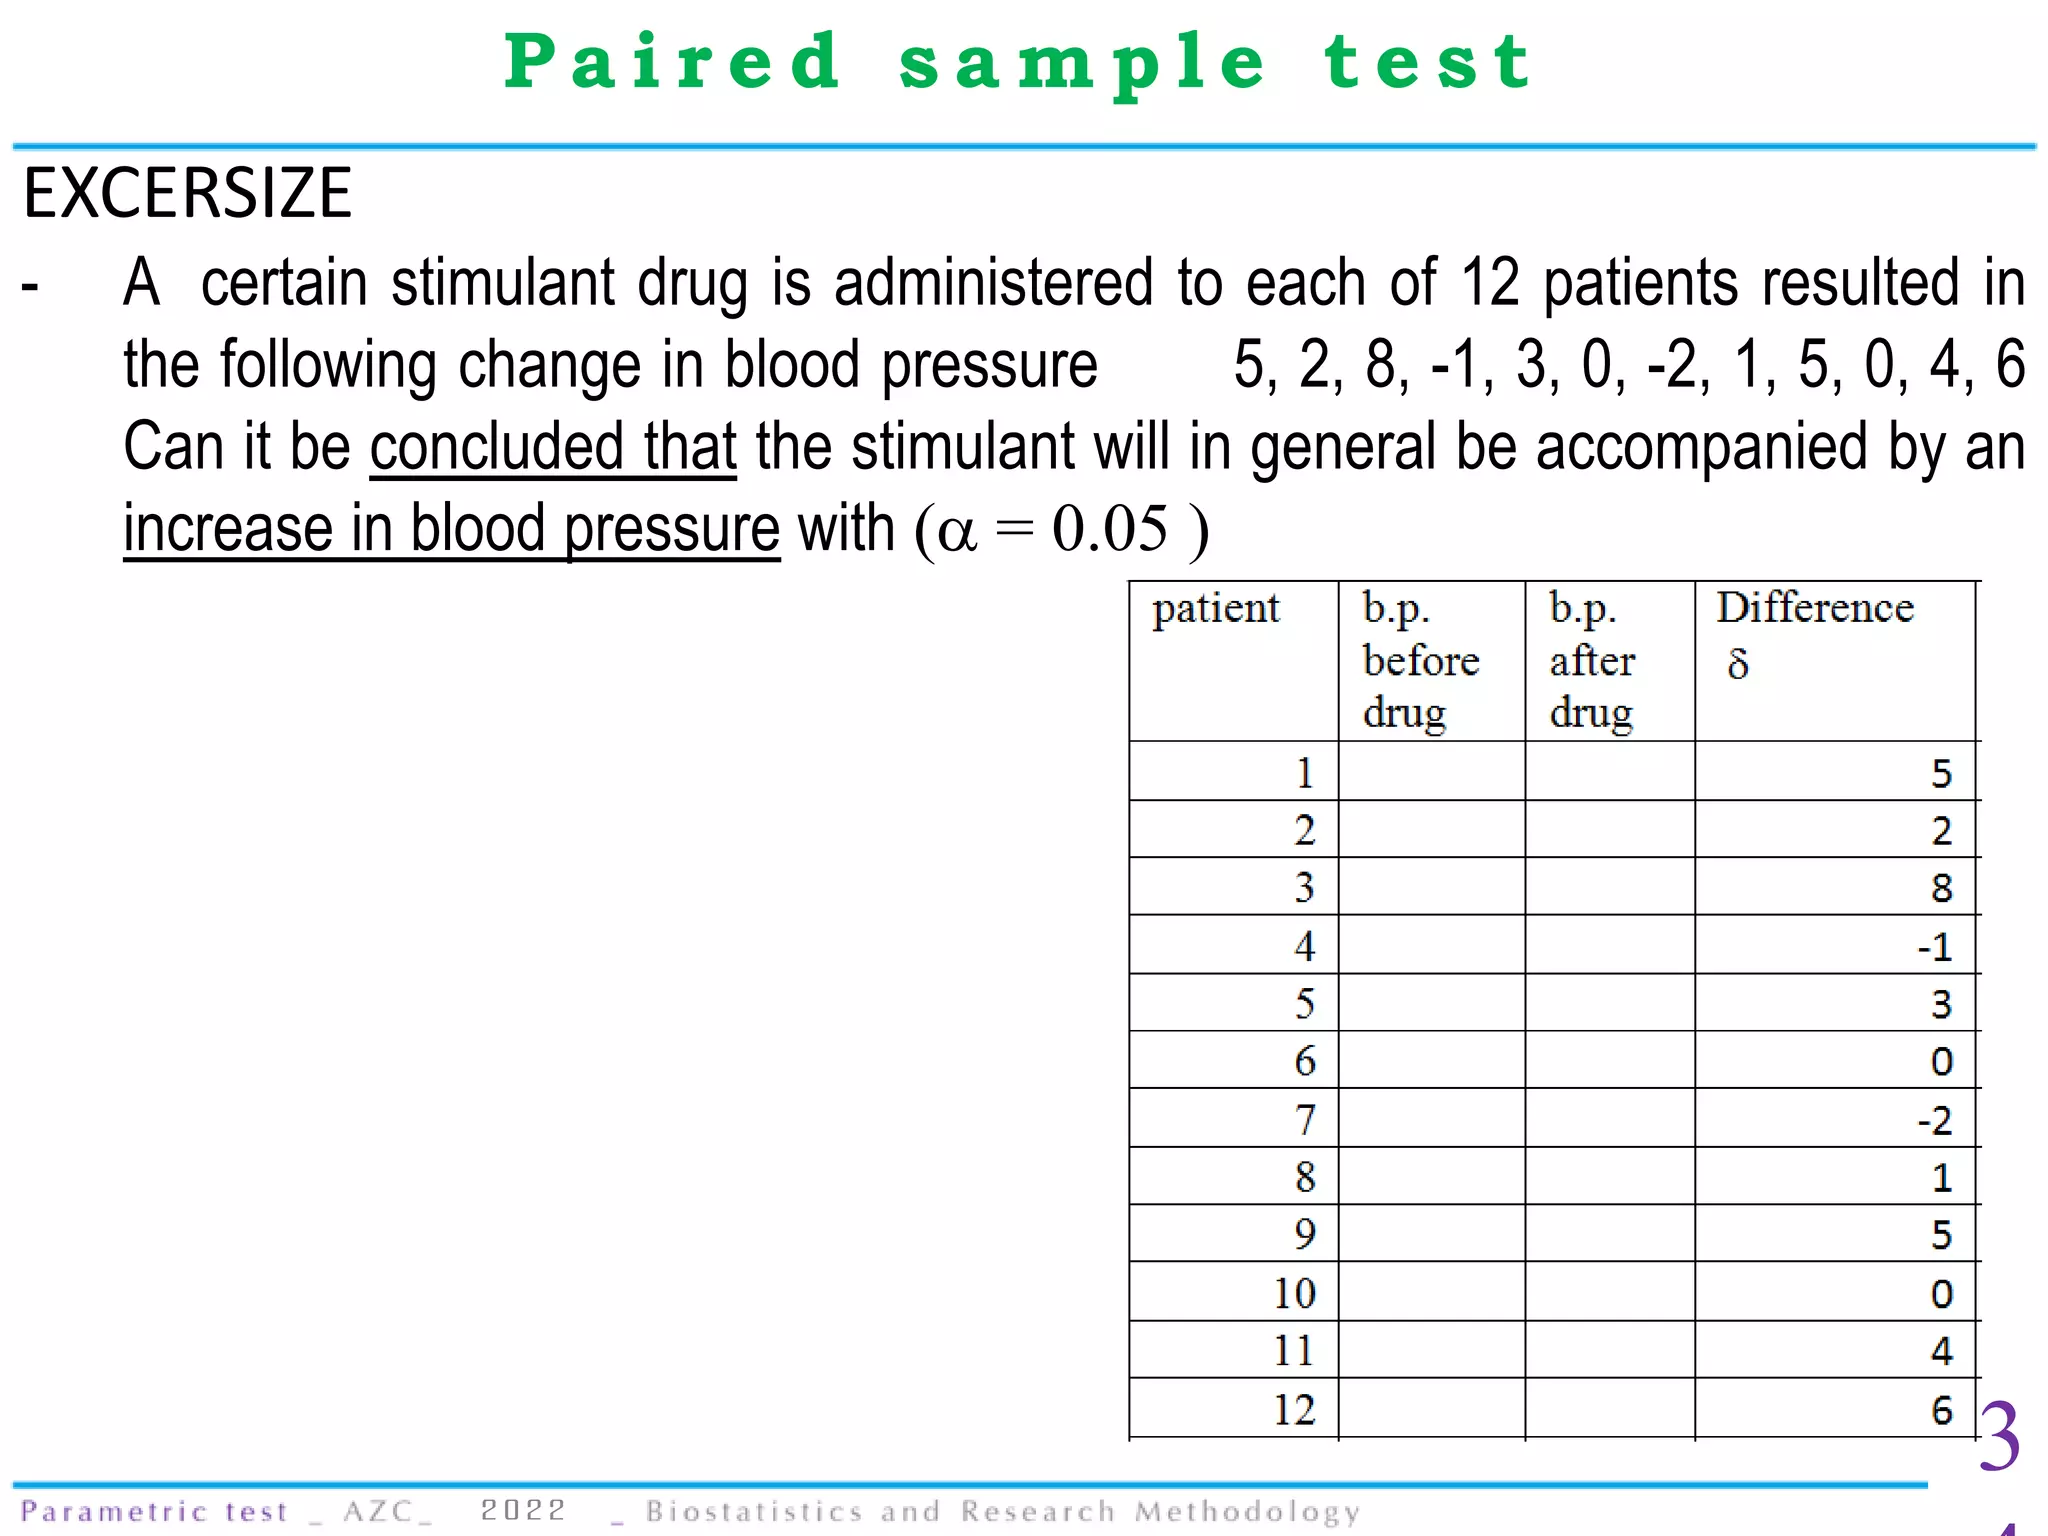
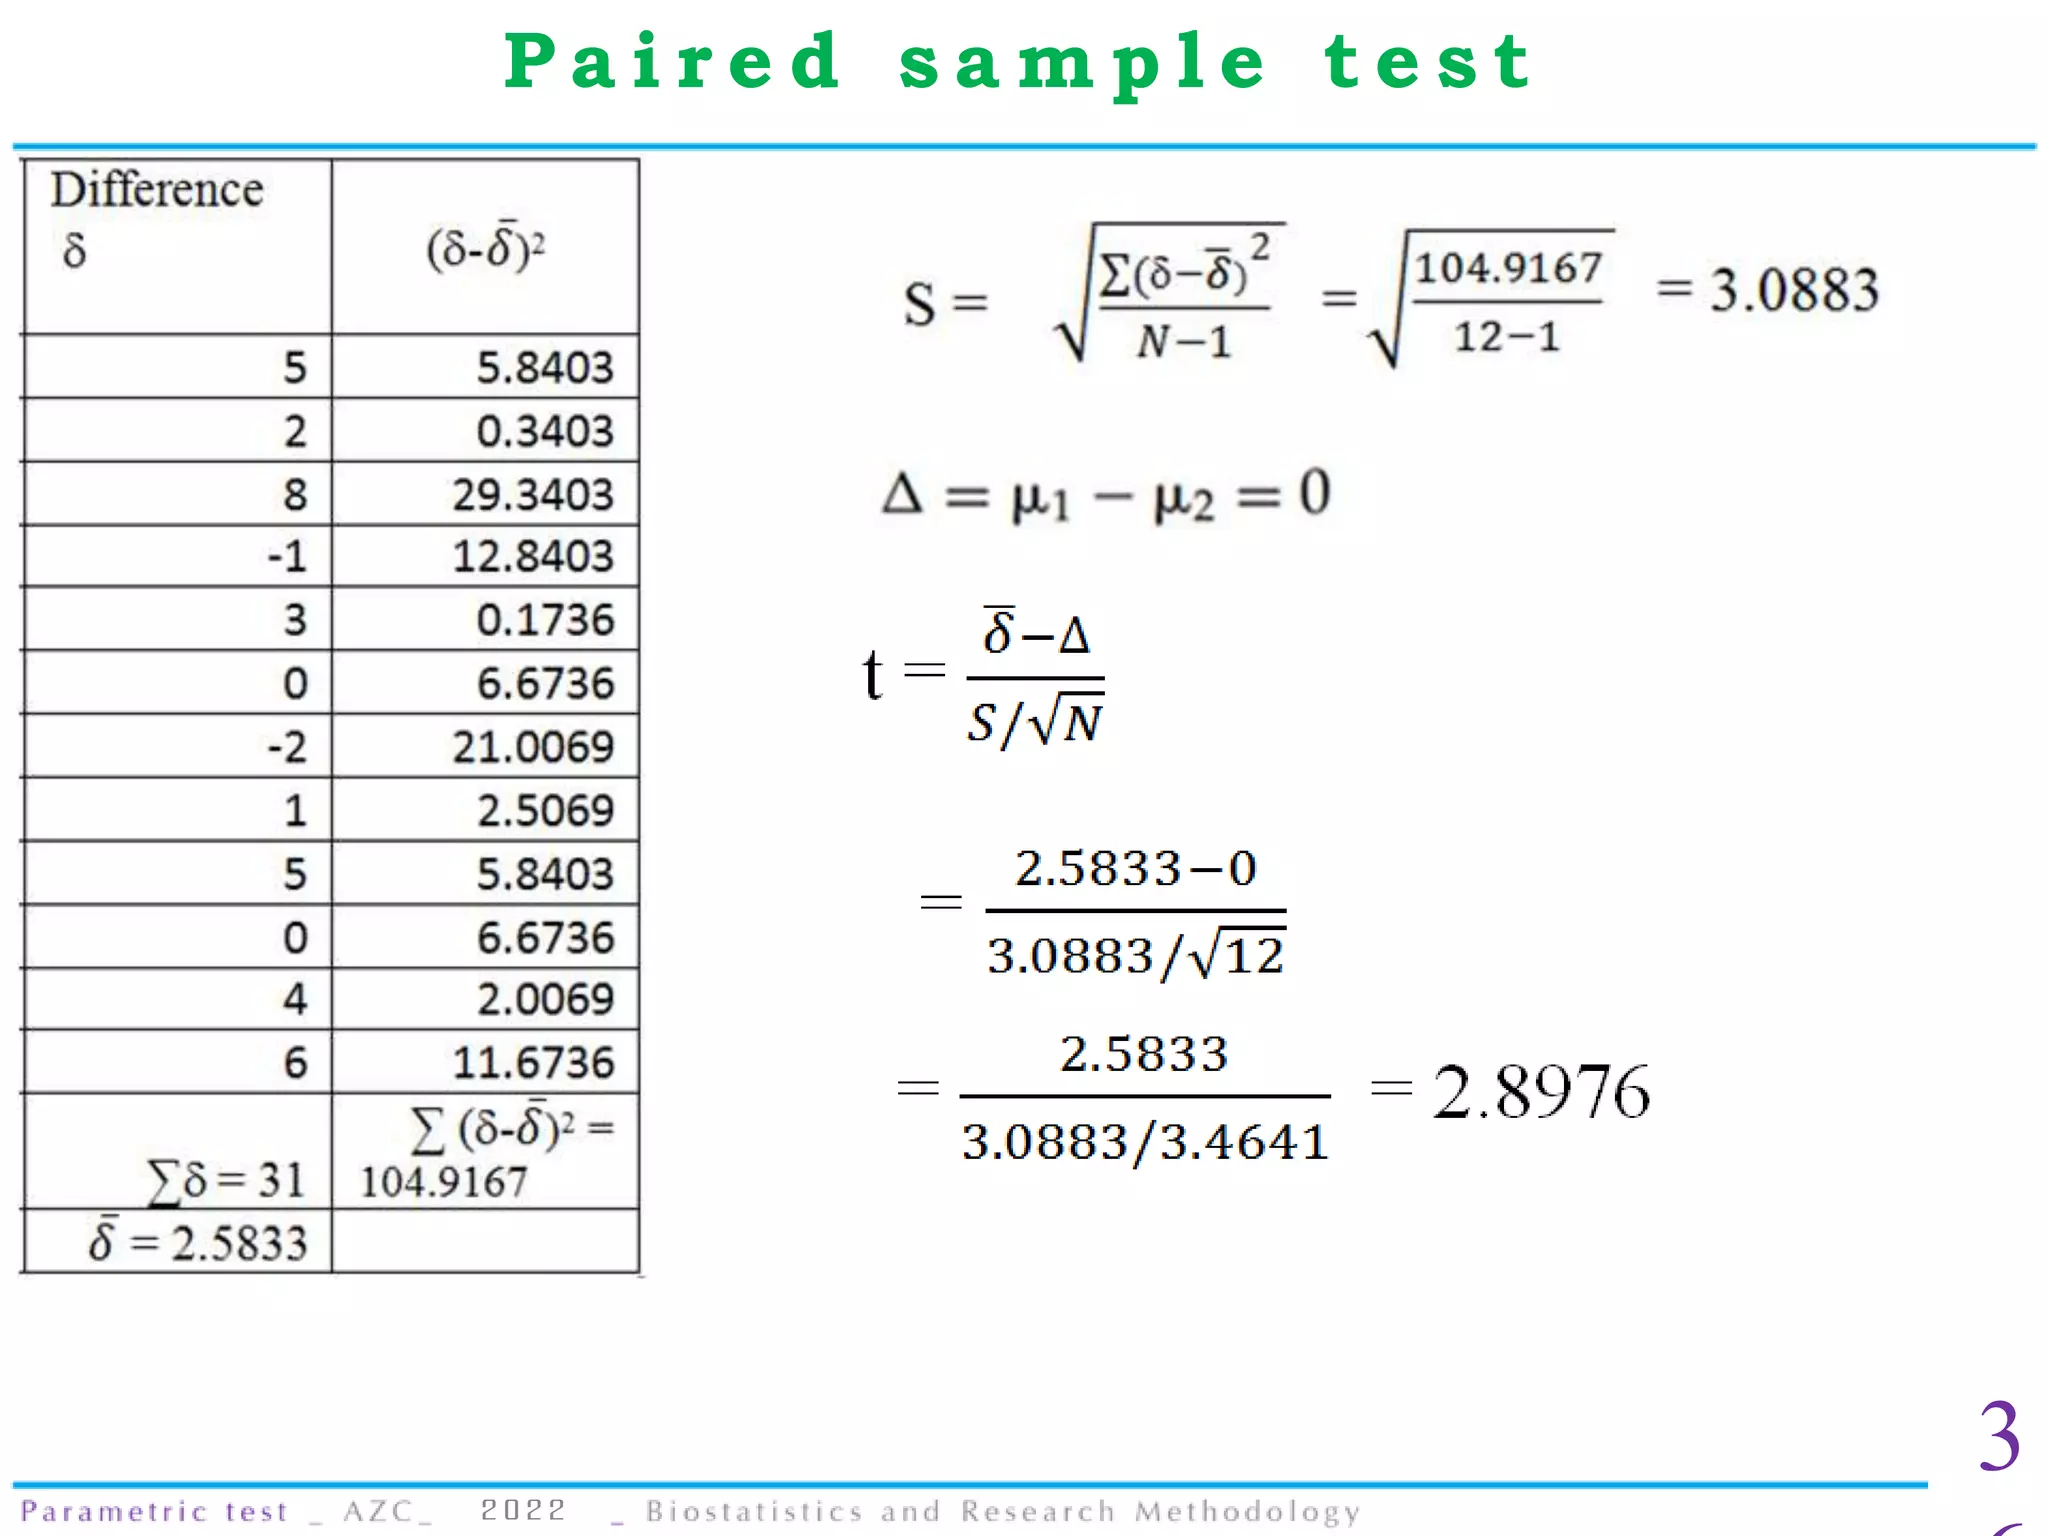
Parametric test with t test and ANOVA on the bases of Biostatistics subject. The slide contains definition of particular test with their sums. Comparison of tests and some terminologies used in hypothesis testing. Useful for Pharmacy students.
Unit-III Non Parametric tests: Wilcoxon Rank Sum Test, Mann-Whitney U test, Kruskal-Wallis
test, Friedman Test. BP801T. BIOSTATISITCS AND RESEARCH METHODOLOGY (Theory)
BP801T. BIOSTATISITCS AND RESEARCH METHODOLOGY (Theory), Unit-II, Regression: Curve fitting by the method of least squares, fitting the lines y= a + bx and x
= a + by, Multiple regression, standard error of regression– Pharmaceutical Examples, • Regression: how well a certain independent variable
predict dependent variable?
• Regression: a measure of the relation between
the mean value of one variable (e.g. output) and
corresponding values of other variables (e.g.
time and cost).
Introduction to Research - Biostatistics and Research methodology 8th Sem Uni...Himanshu Sharma
This slide contains B.Pharm Biostatistics and Research methodology 8th Sem. Unit-3 L2 topic- "Introduction to Research"
It contains topics:
1. Introduction to Research
2. Need for Research
3. Need for Design Experiments
4. Experimental Design Techniques
5. Plagiarism
Through this ppt you could learn what is Wilcoxon Signed Ranked Test. This will teach you the condition and criteria where it can be run and the way to use the test.
This slide contains B.Pharm 8th Sem Biostatistics and research methodology, Unit-3.
Topic covered: Designing the methodology, Sample size determination and Power of a study, Report writing
and presentation of data, Protocol, Cohorts studies, Observational studies, Experimental studies,
Designing clinical trial, various phases.
Probability ,Binomial distribution, Normal distribution, Poisson’s distributi...AZCPh
Definition of probability, Binomial distribution, Normal distribution Poisson’s distribution, properties – problems .
Mathematical / classical probability equation , The multiplicative law of probability when are not mutually exclusive, THE BINOMIAL DISTRIBUTION – with continuous data, The standard normal probability curve
Regression Analysis is simplified in this presentation. Starting with simple linear to multiple regression analysis, it covers all the statistics and interpretation of various diagnostic plots. Besides, how to verify regression assumptions and some advance concepts of choosing best models makes the slides more useful SAS program codes of two examples are also included.
Graphs(Biostatistics and Research Methodology) B.pharmacy(8th sem.)Pranjal Saxena
This slides contains the description about the Graphs(Histograms, Pie-Chart, Cubic Graph, Response surface Plot, Counter surface plot ) mainly Histograms with advantages, disadvantages and examples, Pie-chart with advantages, disadvantages and examples, Cubic Graph with examples, Response surface plot and Counter plot with examples and uses.
Introduction to Research, Biostatistics, Introduction to Research: Need for research, Need for design of Experiments,
Experiential Design Technique, plagiarism
CROSSOVER STUDY DESIGN, DESIGN OF PHARMACOKINETIC STUDIES, FACTORS INFLUENCING BIOAVAILABILITY STUDIES, STUDY DESIGN, PARALLEL DESIGN, CROSS-OVER STUDIES, LATIN SQUARE DESIN, TWO-PERIOD CROSSOVER STUDY DESIGN, BALANCED INCOMPLETE BLOCK DESIGN (BIBD), REPLICATE CROSSOVER STUDY DESIGN , DIFFERENCE BETWEEN PARALLEL AND CROSSOVER STUDY DESIGN.
DESIGN OF EXPERIMENTS (DOE)
DOE is invented by Sir Ronald Fisher in 1920’s and 1930’s.
The following designs of experiments will be usually followed:
Completely randomised design(CRD)
Randomised complete block design(RCBD)
Latin square design(LSD)
Factorial design or experiment
Confounding
Split and strip plot design
FACTORIAL DESIGN
When a several factors are investigated simultaneously in a single experiment such experiments are known as factorial experiments. Though it is not an experimental design, indeed any of the designs may be used for factorial experiments.
For example, the yield of a product depends on the particular type of synthetic substance used and also on the type of chemical used.
ADVANTAGES OF FACTORIAL DESIGN.
Factorial experiments are advantageous to study the combined effect of two or more factors simultaneously and analyze their interrelationships. Such factorial experiments are economic in nature and provide a lot of relevant information about the phenomenon under study. It also increases the efficiency of the experiment.
It is an advantageous because a wide range of factor combination are used. This will give us an idea to predict about what will happen when two or more factors are used in combination.
DISADVANTAGES
It is disadvantageous because the execution of the experiment and the statistical analysis becomes more complex when several treatments combinations or factors are involved simultaneously.
It is also disadvantageous in cases where may not be interested in certain treatment combinations but we are forced to include them in the experiment. This will lead to wastage of time and also the experimental material.
2(square) FACTORIAL EXPERIMENT
A special set of factorial experiment consist of experiments in which all factors have 2 levels such experiments are referred to generally as 2n factorials.
If there are four factors each at two levels the experiment is known as 2x2x2x2 or 24 factorial experiment. On the other hand if there are 2 factors each with 3 levels the experiment is known as 3x3 or 32 factorial experiment. In general if there are n factors each with p levels then it is known as pn factorial experiment.
The calculation of the sum of squares is as follows:
Correction factor (CF) = (𝐺𝑇)2/𝑛
GT = grand total
n = total no of observations
Total sum of squares = ∑▒〖𝑥2−𝐶𝐹〗
Replication sum of squares (RSS) = ((𝑅1)2+(𝑅2)2+…+(𝑅𝑛)2)/𝑛 - CF
Or
1/𝑛 ∑▒𝑅2−𝐶𝐹
2(Cube) FACTORIAL DESIGN
In this type of design, one independent variable has 2 levels, and the other independent variable has 3 levels.
Estimating the effect:
In a factorial design the main effect of an independent variable is its overall effect averaged across all other independent variable.
Effect of a factor A is the average of the runs where A is at the high level minus the average of the runs
when you can measure what you are speaking about and express it in numbers, you know something about it but when you cannot measure, when you cannot express it in numbers, your knowledge is of meagre and unsatisfactory kind.”
The NDA application is the vehicle through which drug sponsors, such as biotech and pharmaceutical companies, formally propose that the FDA approve a new pharmaceutical for sale and marketing
This presentation contains information about Mann Whitney U test, what is it, when to use it and how to use it. I have also put an example so that it may help you to easily understand it.
Formalization and automated computation of diabetes quality indicators with C...Kathrin Dentler
Clinical quality indicators are often used to measure the quality of healthcare services and can be classified into structure-related, process-related and outcome-related indicators. The objective of this study is to investigate whether the electronic medical record (EMR) data in Chinese hospitals can be used for the automated computation of di- abetes quality indicators, especially the process-related indicators. The clinical quality indicators formalization (CLIF) tool and SNOMED CT terminology were adopted to formalize some selected diabetes indicators into executable queries and patient data were collected from the EMR of a Chinese diabetes specialty hospital. The formalized indicators were run on the patient data to test the feasibility of the automated computation of formalized indicators. In this study, all of the 38 indicators can be for- malized and 32 of them can be computed based on the EMR data. The results indicated that Chinese EMRs can be used for the computation of most diabetes indicators, including some process-related indicators, and it also can be improved to better support the computation of more indicators.
1.What would be the appropriate statistical procedure to test t.docxhyacinthshackley2629
1. What would be the appropriate statistical procedure to test the following hypothesis: “Triglyceride values are a good predictor of weight in obese adults.”
__________________________________________________________________
2. What is (are) the function(s) of parametric statistical procedures?
__________________________________________________________________
3. What is Type I Error?
__________________________________________________________________
__________________________________________________________________
4. What are the assumptions underlying the use of parametric, statistical procedures?
__________________________________________________________________
__________________________________________________________________
__________________________________________________________________
__________________________________________________________________
5. If a critical value is greater than the test statistic, would you accept or reject the null hypothesis?
__________________________________________________________________
6. Under what circumstance(s) is it appropriate to use a 2-tailed test of significance?
__________________________________________________________________
__________________________________________________________________
7. What is the appropriate statistical procedure to use when your interest is in detecting a bivariate, curvilinear association?
__________________________________________________________________
8. For a study comparing outcomes under alternate treatment conditions, when the null hypothesis is rejected, the researcher concludes that a difference among groups exists.
_____True
_____False
9. A researcher, for reasons passing understanding, wishes to assess the association between gender and total cholesterol values. What would be the appropriate statistical procedure?
__________________________________________________________________
10. An HIV educator wishes to determine whether the method of delivering teaching influences adherence with antiretroviral therapy. She decides to measure adherence as viral load (a ratio measure). She teaches one group using lecture-discussion techniques. She adapts the information for access on the internet and gives another group the information using this medium. For yet another group, she decides to give a CD Rom for home study and then meets with individuals to answer any questions. She obtains viral loads for all clients for comparison. What procedure will determine the significance of any differences?
__________________________________________________________________
Items 11-15 relate to the following study results:
Study AStudy BStudy C
2 = 1.683 F = 7.357 r = .83
df = 4 df = 3/203 df = 98
p > .05 p < .05 p < .01
11. What statistical procedure was used to analyze data in study B?
__________________________________________________________________
12. How many groups were compared in stu.
Normal Labour/ Stages of Labour/ Mechanism of LabourWasim Ak
Normal labor is also termed spontaneous labor, defined as the natural physiological process through which the fetus, placenta, and membranes are expelled from the uterus through the birth canal at term (37 to 42 weeks
Read| The latest issue of The Challenger is here! We are thrilled to announce that our school paper has qualified for the NATIONAL SCHOOLS PRESS CONFERENCE (NSPC) 2024. Thank you for your unwavering support and trust. Dive into the stories that made us stand out!
A Strategic Approach: GenAI in EducationPeter Windle
Artificial Intelligence (AI) technologies such as Generative AI, Image Generators and Large Language Models have had a dramatic impact on teaching, learning and assessment over the past 18 months. The most immediate threat AI posed was to Academic Integrity with Higher Education Institutes (HEIs) focusing their efforts on combating the use of GenAI in assessment. Guidelines were developed for staff and students, policies put in place too. Innovative educators have forged paths in the use of Generative AI for teaching, learning and assessments leading to pockets of transformation springing up across HEIs, often with little or no top-down guidance, support or direction.
This Gasta posits a strategic approach to integrating AI into HEIs to prepare staff, students and the curriculum for an evolving world and workplace. We will highlight the advantages of working with these technologies beyond the realm of teaching, learning and assessment by considering prompt engineering skills, industry impact, curriculum changes, and the need for staff upskilling. In contrast, not engaging strategically with Generative AI poses risks, including falling behind peers, missed opportunities and failing to ensure our graduates remain employable. The rapid evolution of AI technologies necessitates a proactive and strategic approach if we are to remain relevant.
Biological screening of herbal drugs: Introduction and Need for
Phyto-Pharmacological Screening, New Strategies for evaluating
Natural Products, In vitro evaluation techniques for Antioxidants, Antimicrobial and Anticancer drugs. In vivo evaluation techniques
for Anti-inflammatory, Antiulcer, Anticancer, Wound healing, Antidiabetic, Hepatoprotective, Cardio protective, Diuretics and
Antifertility, Toxicity studies as per OECD guidelines
Francesca Gottschalk - How can education support child empowerment.pptxEduSkills OECD
Francesca Gottschalk from the OECD’s Centre for Educational Research and Innovation presents at the Ask an Expert Webinar: How can education support child empowerment?
Acetabularia Information For Class 9 .docxvaibhavrinwa19
Acetabularia acetabulum is a single-celled green alga that in its vegetative state is morphologically differentiated into a basal rhizoid and an axially elongated stalk, which bears whorls of branching hairs. The single diploid nucleus resides in the rhizoid.
Safalta Digital marketing institute in Noida, provide complete applications that encompass a huge range of virtual advertising and marketing additives, which includes search engine optimization, virtual communication advertising, pay-per-click on marketing, content material advertising, internet analytics, and greater. These university courses are designed for students who possess a comprehensive understanding of virtual marketing strategies and attributes.Safalta Digital Marketing Institute in Noida is a first choice for young individuals or students who are looking to start their careers in the field of digital advertising. The institute gives specialized courses designed and certification.
for beginners, providing thorough training in areas such as SEO, digital communication marketing, and PPC training in Noida. After finishing the program, students receive the certifications recognised by top different universitie, setting a strong foundation for a successful career in digital marketing.
2. - used to evaluate hypotheses
- Types of Parametric test
• t-test
• Z-test
• F-test
• Analysis of variance (ANOVA)
- Parametric tests assume a normal distribution of values
2
P a r a m e t r i c t e s t
2022
7. Case I
- After A large amount of data was collected for the content of drug in the tablet formulation during
a period of several years , The manufacturing process showed an average
potency of 5.01 mg and a standard deviation of 0.11, both values
considered to be equal to the true process parameters.
- A new batch was made with a modification of the usual
manufacturing procedure. And assay of 20 tablets give bellow..
7
O n e - s a m p l e t e s t
2022
9. 2. The null hypothesis and alternative hypothesis
two sided hypothesis testing
- Alternative hypothesis suggest that the average drug potency of the
new batch can conceivably be smaller as well as greater than the
historical process average of 5.01 mg.
9
O n e - s a m p l e t e s t
2022
10. 3. The level of significance is specified
1
Z ≤ -1.96 or Z ≥ 1.96 then reject H0
O n e - s a m p l e t e s t
2022
11. 4. Selection of sample
5. Experiment trials
6. After the experiment is completed , Statistical calculations are
1
O n e - s a m p l e t e s t
2022
15. Case II
- A pharmaceutical company places A new compound on an
“antihypertensive” screening. Experience has shown that a blood
pressure reduction of more than 15 mm Hg in hypertensive animals.
since such testing is expensive, the researchers wish to be reasonably
sure that statistically the compound truly reduces the blood pressure
by more than 15 mm Hg before testing is continued. The level of
significance of 10% was chosen
1
O n e - s a m p l e t e s t
2022
34. EXCERSIZE
- A certain stimulant drug is administered to each of 12 patients resulted in
the following change in blood pressure 5, 2, 8, -1, 3, 0, -2, 1, 5, 0, 4, 6
Can it be concluded that the stimulant will in general be accompanied by an
increase in blood pressure with ( = 0.05 )
3
P a i r e d s a m p l e t e s t
2022
38. Full form : Analysis of variance
Defination :
ANOVA is a statistical technique specially designed to test whether the
means of more than 2 quantitative populations are equal.
3
A N O V A
2022