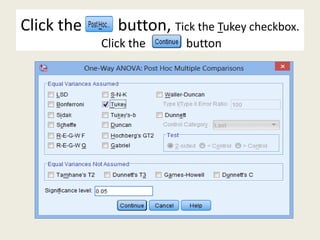
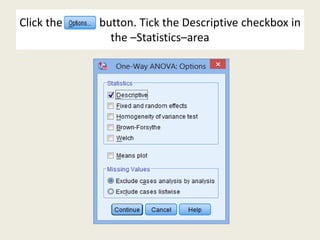
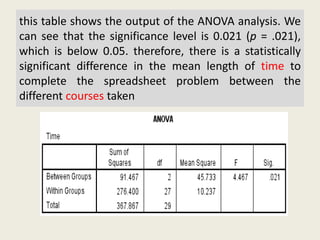
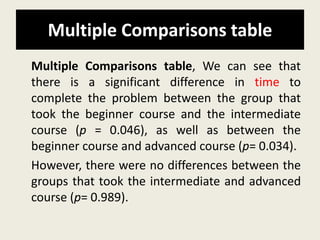
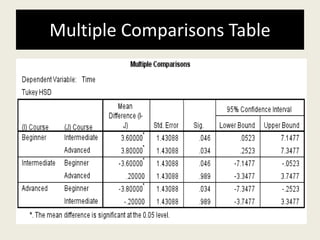
The document discusses a one-way ANOVA test, which compares the means of two or more independent groups on a continuous dependent variable. It outlines the assumptions of the test, how to set it up in SPSS, and how to interpret the output. Key outputs include an ANOVA table showing if group means are statistically significantly different, and a post-hoc test for determining the nature of differences between specific groups.
Today’s overwhelming number of techniques applicable to data analysis makes it extremely difficult to define the most beneficial approach while considering all the significant variables.
The analysis of variance has been studied from several approaches, the most common of which uses a linear model that relates the response to the treatments and blocks. Note that the model is linear in parameters but may be nonlinear across factor levels. Interpretation is easy when data is balanced across factors but much deeper understanding is needed for unbalanced data.
Analysis of variance (ANOVA) is a collection of statistical models and their associated estimation procedures (such as the "variation" among and between groups) used to analyze the differences among means. ANOVA was developed by the statistician Ronald Fisher. ANOVA is based on the law of total variance, where the observed variance in a particular variable is partitioned into components attributable to different sources of variation. In its simplest form, ANOVA provides a statistical test of whether two or more population means are equal, and therefore generalizes the t-test beyond two means. In other words, the ANOVA is used to test the difference between two or more means.Analysis of variance (ANOVA) is an analysis tool used in statistics that splits an observed aggregate variability found inside a data set into two parts: systematic factors and random factors. The systematic factors have a statistical influence on the given data set, while the random factors do not. Analysts use the ANOVA test to determine the influence that independent variables have on the dependent variable in a regression study.
Sir Ronald Fisher pioneered the development of ANOVA for analyzing results of agricultural experiments.1 Today, ANOVA is included in almost every statistical package, which makes it accessible to investigators in all experimental sciences. It is easy to input a data set and run a simple ANOVA, but it is challenging to choose the appropriate ANOVA for different experimental designs, to examine whether data adhere to the modeling assumptions, and to interpret the results correctly. The purpose of this report, together with the next 2 articles in the Statistical Primer for Cardiovascular Research series, is to enhance understanding of ANVOA and to promote its successful use in experimental cardiovascular research. My colleagues and I attempt to accomplish those goals through examples and explanation, while keeping within reason the burden of notation, technical jargon, and mathematical equations.
This presentation contains information about Mann Whitney U test, what is it, when to use it and how to use it. I have also put an example so that it may help you to easily understand it.
Please Subscribe to this Channel for more solutions and lectures
http://www.youtube.com/onlineteaching
Chapter 12: Analysis of Variance
12.2: Two-Way ANOVA
Through this ppt you could learn what is Wilcoxon Signed Ranked Test. This will teach you the condition and criteria where it can be run and the way to use the test.
Assumptions of parametric and non-parametric tests
Testing the assumption of normality
Commonly used non-parametric tests
Applying tests in SPSS
Advantages of non-parametric tests
Limitations
statistics/cf_choose_a_statistical_test (1) (1).pptx
Independent Variable [IV]
(number of groups)Dependent Variable [DV]
(measurement level) Two Groups
Three + Groups
Independent
(“unpaired”)Dependent
(“paired”)Independent
(“unpaired”)
Dependent
(“paired”)
CategoricalNon-parametric TestsChi-squareMcNemar’sChi-square
Cochran’s QOrdinal Mann-Whitney UWilcoxon Signed ranksKruskal Wallis HFriedman’sInterval / Ratio
(continuous)Parametric TestsIndependent
t-testDependent
t-testANOVARM-ANOVA
“What is the effect of TREATMENT (IV) on our OUTCOME (DV) of interest?”
Example: TREATMENT independent groups (placebo versus drug), OUTCOME interval/ratio (blood pressure)
Example: TREATMENT dependent group (pre/post yoga therapy), OUTCOME ordinal (back pain levels)
Example: TREATMENT independent 3+ groups (yoga therapy, none, aerobics), OUTCOME categorical (pass/fail of driving test)CorrelationsPhi coefficientSpearman’s rhoPearson’s r
Independent Variable
(number of groups)Dependent Variable (measurement level) Two Groups
Three + Groups
Independent
(“unpaired”)Dependent
(“paired”)Independent
(“unpaired”)
Dependent
(“paired”)
CategoricalNon-parametric TestsChi-squareMcNemar’sChi-square
Cochran’s QOrdinal Mann-Whitney UWilcoxon Signed ranksKruskal Wallis HFriedman’sInterval / Ratio
(continuous)Parametric TestsIndependent
t-testDependent
t-testANOVARM-ANOVA
STEP #1
Check what measurement level your DV is.
STEP #2
Choose the column related to the number Groups in your study.
STEP #3
Choose the column where intervention groups are either “paired” or “unpaired.”
STEP #4
Match your column with the row to find which test
to run.
STEP #1
Look at your Dependent Variable or outcome.
The data that we are looking at here is from the instruments you used to measure the effect of your intervention. Maybe you chose to measure stress with a commonly used psychological questionnaire or maybe you measured cholesterol levels or test scores.
What is its measurement level?
Categorical (such as yes or no; dead or alive; pass or fail).
Ordinal (such as health status – poor, average, excellent).
Interval ratio (for instance blood pressure, cholesterol level, rates of infection, or workplace satisfaction scores on a scale of 0-100).
STEP #2
Next you will look for the column that corresponds to the number of groups you have for your Independent Variable (also called experimental or predictor variable).
Remember, the independent variable is the thing in your study that was controlled by you (such as a medical intervention, or training initiative, or implementation of a modified protocol) for the purpose of making a change on some outcome in the population you are studying.
So…how many groups were involved in this intervention?
For example, if you were testing the effect of an evidence-based training initiative on employee workplace satisfaction or happiness, you might be interested in comparing the training initiative in one group to no training in another group..
Statistics for Anaesthesiologists covers basic to intermediate level statistics for researchers especially commonly used study designs or tests in Anaesthesiology research.
BUS 308 Week 3 Lecture 1 Examining Differences - Continued.docxcurwenmichaela
BUS 308 Week 3 Lecture 1
Examining Differences - Continued
Expected Outcomes
After reading this lecture, the student should be familiar with:
1. Issues around multiple testing
2. The basics of the Analysis of Variance test
3. Determining significant differences between group means
4. The basics of the Chi Square Distribution.
Overview
Last week, we found out ways to examine differences between a measure taken on two
groups (two-sample test situation) as well as comparing that measure to a standard (a one-sample
test situation). We looked at the F test which let us test for variance equality. We also looked at
the t-test which focused on testing for mean equality. We noted that the t-test had three distinct
versions, one for groups that had equal variances, one for groups that had unequal variances, and
one for data that was paired (two measures on the same subject, such as salary and midpoint for
each employee). We also looked at how the 2-sample unequal t-test could be used to use Excel
to perform a one-sample mean test against a standard or constant value. This week we expand
our tool kit to let us compare multiple groups for similar mean values.
A second tool will let us look at how data values are distributed – if graphed, would they
look the same? Different shapes or patterns often means the data sets differ in significant ways
that can help explain results.
Multiple Groups
As interesting as comparing two groups is, often it is a bit limiting as to what it tells us.
One obvious issue that we are missing in the comparisons made last week was equal work. This
idea is still somewhat hard to get a clear handle on. Typically, as we look at this issue, questions
arise about things such as performance appraisal ratings, education distribution, seniority impact,
etc.
Some of these can be tested with the tools introduced last week. We can see, for
example, if the performance rating average is the same for each gender. What we couldn’t do, at
this point however, is see if performance ratings differ by grade, do the more senior workers
perform relatively better? Is there a difference between ratings for each gender by grade level?
The same questions can be asked about seniority impact. This week will give us tools to expand
how we look at the clues hidden within the data set about equal pay for equal work.
ANOVA
So, let’s start taking a look at these questions. The first tool for this week is the Analysis
of Variance – ANOVA for short. ANOVA is often confusing for students; it says it analyzes
variance (which it does) but the purpose of an ANOVA test is to determine if the means of
different groups are the same! Now, so far, we have considered means and variance to be two
distinct characteristics of data sets; characteristics that are not related, yet here we are saying that
looking at one will give us insight into the other.
The reason is due to the way the variance is an.
(Individuals With Disabilities Act Transformation Over the Years)DSilvaGraf83
(Individuals With Disabilities Act Transformation Over the Years)
Discussion Forum Instructions:
1. You must post at least three times each week.
2. Your initial post is due Tuesday of each week and the following two post are due before Sunday.
3. All post must be on separate days of the week.
4. Post must be at least 150 words and cite all of your references even it its the book.
Discussion Topic:
Describe how the lives of students with disabilities from culturally and/or linguistically diverse backgrounds have changed since the advent of IDEA. What do you feel are some things that can or should be implemented to better assist with students that have disabilities? Tell me about these ideas and how would you integrate them?
ANOVA
ANOVA
• Analysis of Variance
• Statistical method to analyzes variances to determine if the means from more than
two populations are the same
• compare the between-sample-variation to the within-sample-variation
• If the between-sample-variation is sufficiently large compared to the within-sample-
variation it is likely that the population means are statistically different
• Compares means (group differences) among levels of factors. No
assumptions are made regarding how the factors are related
• Residual related assumptions are the same as with simple regression
• Explanatory variables can be qualitative or quantitative but are categorized
for group investigations. These variables are often referred to as factors
with levels (category levels)
ANOVA Assumptions
• Assume populations , from which the response values for the groups
are drawn, are normally distributed
• Assumes populations have equal variances
• Can compare the ratio of smallest and largest sample standard deviations.
Between .05 and 2 are typically not considered evidence of a violation
assumption
• Assumes the response data are independent
• For large sample sizes, or for factor level sample sizes that are equal,
the ANOVA test is robust to assumption violations of normality and
unequal variances
ANOVA and Variance
Fixed or Random Factors
• A factor is fixed if its levels are chosen before the ANOVA investigation
begins
• Difference in groups are only investigated for the specific pre-selected factors
and levels
• A factor is random if its levels are choosen randomly from the
population before the ANOVA investigation begins
Randomization
• Assigning subjects to treatment groups or treatments to subjects
randomly reduces the chance of bias selecting results
ANOVA hypotheses statements
One-way ANOVA
One-Way ANOVA
Hypotheses statements
Test statistic
=
𝐵𝑒𝑡𝑤𝑒𝑒𝑛 𝐺𝑟𝑜𝑢𝑝 𝑉𝑎𝑟𝑖𝑎𝑛𝑐𝑒
𝑊𝑖𝑡ℎ𝑖𝑛 𝐺𝑟𝑜𝑢𝑝 𝑉𝑎𝑟𝑖𝑎𝑛𝑐𝑒
Under the null hypothesis both the between and within group variances estimate the
variance of the random error so the ratio is assumed to be close to 1.
Null Hypothesis
Alternate Hypothesis
One-Way ANOVA
One-Way ANOVA
One-Way ANOVA Excel Output
Treatme
(Individuals With Disabilities Act Transformation Over the Years)DMoseStaton39
(Individuals With Disabilities Act Transformation Over the Years)
Discussion Forum Instructions:
1. You must post at least three times each week.
2. Your initial post is due Tuesday of each week and the following two post are due before Sunday.
3. All post must be on separate days of the week.
4. Post must be at least 150 words and cite all of your references even it its the book.
Discussion Topic:
Describe how the lives of students with disabilities from culturally and/or linguistically diverse backgrounds have changed since the advent of IDEA. What do you feel are some things that can or should be implemented to better assist with students that have disabilities? Tell me about these ideas and how would you integrate them?
ANOVA
ANOVA
• Analysis of Variance
• Statistical method to analyzes variances to determine if the means from more than
two populations are the same
• compare the between-sample-variation to the within-sample-variation
• If the between-sample-variation is sufficiently large compared to the within-sample-
variation it is likely that the population means are statistically different
• Compares means (group differences) among levels of factors. No
assumptions are made regarding how the factors are related
• Residual related assumptions are the same as with simple regression
• Explanatory variables can be qualitative or quantitative but are categorized
for group investigations. These variables are often referred to as factors
with levels (category levels)
ANOVA Assumptions
• Assume populations , from which the response values for the groups
are drawn, are normally distributed
• Assumes populations have equal variances
• Can compare the ratio of smallest and largest sample standard deviations.
Between .05 and 2 are typically not considered evidence of a violation
assumption
• Assumes the response data are independent
• For large sample sizes, or for factor level sample sizes that are equal,
the ANOVA test is robust to assumption violations of normality and
unequal variances
ANOVA and Variance
Fixed or Random Factors
• A factor is fixed if its levels are chosen before the ANOVA investigation
begins
• Difference in groups are only investigated for the specific pre-selected factors
and levels
• A factor is random if its levels are choosen randomly from the
population before the ANOVA investigation begins
Randomization
• Assigning subjects to treatment groups or treatments to subjects
randomly reduces the chance of bias selecting results
ANOVA hypotheses statements
One-way ANOVA
One-Way ANOVA
Hypotheses statements
Test statistic
=
𝐵𝑒𝑡𝑤𝑒𝑒𝑛 𝐺𝑟𝑜𝑢𝑝 𝑉𝑎𝑟𝑖𝑎𝑛𝑐𝑒
𝑊𝑖𝑡ℎ𝑖𝑛 𝐺𝑟𝑜𝑢𝑝 𝑉𝑎𝑟𝑖𝑎𝑛𝑐𝑒
Under the null hypothesis both the between and within group variances estimate the
variance of the random error so the ratio is assumed to be close to 1.
Null Hypothesis
Alternate Hypothesis
One-Way ANOVA
One-Way ANOVA
One-Way ANOVA Excel Output
Treatme
Analysis of variance (ANOVA) everything you need to knowStat Analytica
Most of the students may struggle with the analysis of variance (ANOVA). Here in this presentation you can clear all your doubts in analysis of variance with suitable examples.
In Unit 9, we will study the theory and logic of analysis of varianc.docxlanagore871
In Unit 9, we will study the theory and logic of analysis of variance (ANOVA). Recall that a t test requires a predictor variable that is dichotomous (it has only two levels or groups). The advantage of ANOVA over a t test
is that the categorical predictor variable can have two or more groups. Just like a t test, the outcome variable in
ANOVA is continuous and requires the calculation of group means.
Logic of a "One-Way" ANOVA
The ANOVA, or F test, relies on predictor variables referred to as factors. A factor is a categorical (nominal)
predictor variable. The term "one-way" is applied to an ANOVA with only one factor that is defined by two or
more mutually exclusive groups. Technically, an ANOVA can be calculated with only two groups, but the t test is
usually used instead. Instead, the one-way ANOVA is usually calculated with three or more groups, which are
often referred to as levels of the factor.
If the ANOVA includes multiple factors, it is referred to as a factorial ANOVA. An ANOVA with two factors is
referred to as a "two-way" ANOVA; an ANOVA with three factors is referred to as a "three-way" ANOVA, and
so on. Factorial ANOVA is studied in advanced inferential statistics. In this course, we will focus on the theory
and logic of the one-way ANOVA.
ANOVA is one of the most popular statistics used in social sciences research. In non-experimental designs, the
one-way ANOVA compares group means between naturally existing groups, such as political affiliation
(Democrat, Independent, Republican). In experimental designs, the one-way ANOVA compares group means
for participants randomly assigned to different treatment conditions (for example, high caffeine dose; low
caffeine dose; control group).
Avoiding Inflated Type I Error
You may wonder why a one-way ANOVA is necessary. For example, if a factor has four groups ( k = 4), why not
just run independent sample t tests for all pairwise comparisons (for example, Group A versus Group B, Group
A versus Group C, Group B versus Group C, et cetera)? Warner (2013) points out that a factor with four groups
involves six pairwise comparisons. The issue is that conducting multiple pairwise comparisons with the same
data leads to inflated risk of a Type I error (incorrectly rejecting a true null hypothesis—getting a false positive).
The ANOVA protects the researcher from inflated Type I error by calculating a single omnibus test that
assumes all k population means are equal.
Although the advantage of the omnibus test is that it helps protect researchers from inflated Type I error, the
limitation is that a significant omnibus test does not specify exactly which group means differ, just that there is a
difference "somewhere" among the group means. A researcher therefore relies on either (a) planned contrasts
of specific pairwise comparisons determined prior to running the F test or (b) follow-up tests of pairwise
comparisons, also referred to as post-hoc tests, to determine exac ...
What Are the Latest Trends in Endpoint Security for 2024?VRS Technologies
In this PDF, Discover the top 2024 endpoint security trends, including zero trust, AI integration, XDR, cloud security, and enhanced mobile protection. VRS Technologies LLC supplies the top level Endpoint Security Service Dubai. For More Info Contact us: +971 56 7029840 Visit us: https://www.vrstech.com/endpoint-security-solutions.html
Nature’s Paradise Glamorous And Sustainable Designs For Your Outdoor Living S...Landscape Express
Create a harmonious blend of luxury and sustainability in your outdoor living space with eco-friendly kitchens, enchanting water features, and lush plant landscaping. Embrace energy-efficient appliances, solar lighting, rainwater harvesting, and native plants to enhance beauty while reducing environmental impact. Transform your space into a glamorous, eco-conscious retreat for relaxation and social gatherings.
Delightful Finds: Unveiling the Power of Gifts Under 100JoyTree Global
Stretch your budget and spread joy! This guide explores the world of gifts under 100, proving thoughtful gestures don't require a hefty price tag. Discover unique and practical options for birthdays, holidays, or simply showing someone you care. Find inspiration for every occasion within your budget!
Comprehensive Water Damage Restoration Serviceskleenupdisaster
Find out how Disaster Kleenup's professional water damage restoration services can quickly and efficiently restore your property. Find more about our advanced techniques and quick action plans. Visit here: https://iddk.com/disaster-cleanup-services/flood-damage/
DOJO Training Center - Empowering Workforce ExcellenceHimanshu
The document delves into DOJO training, an immersive offline training concept designed to educate both new hires and existing staff. This method follows an organized eight-step process within a simulated work setting. The steps encompass safety protocols, behavioral coaching, product familiarity, production guidelines, and procedural understanding. Trainees acquire skills through hands-on simulations and rehearsal prior to transitioning to actual shop floor duties under supervision. The primary aim is to minimize accidents and defects by ensuring employees undergo comprehensive training, preparing them effectively for their job roles.
Maximizing Efficiency with Integrated Water Management SystemsIrri Design Studio
Integrated water management systems are essential for improving irrigation design sustainability and efficiency. Irri Design Studio helps customers maximize water consumption, reduce waste, and encourage responsible stewardship of water resources by utilizing cutting-edge technology like drone-based construction updates and BIM modeling. The increasing issues of water shortage and environmental protection require an all-encompassing strategy to water management. Irrigation systems may be planned to optimize water consumption efficiency while guaranteeing the safety of people and the environment by putting new ideas and concepts into practice. Visit our website https://www.irridesignstudio.com/ for more information.
Earth moving equipment refers to heavy-duty machines used in construction, mining, agriculture, and other industries to move large amounts of earth, soil, and other materials. These machines include excavators, bulldozers, loaders, and backhoes, which are essential for tasks such as digging, grading, and leveling land.
Earthmovers is a leading brand in the industry, known for providing reliable and high-performance earth moving equipment. Their machines are designed to handle the toughest jobs with efficiency and precision, ensuring optimal productivity on any project.
Business Solutions with .NET Development in Quantum Computing.pdfQServices Inc.
Unlock the power of quantum computing with QServices. Our .NET experts deliver cutting-edge solutions to drive your business forward. Experience the future of computing and gain a competitive edge today.
Looking for the Reliable Logistics Solutions in India? Discover unparalleled efficiency and reliability with our top-rated logistics services. We specialize in streamlining supply chains, ensuring timely deliveries, and providing cutting-edge tracking solutions. Our platform caters to businesses of all sizes, offering customizable logistics solutions to meet your unique needs. With a focus on innovation and customer satisfaction, we are your trusted partner in navigating the complexities of logistics in India. Choose us for seamless, cost-effective, and scalable logistics solutions. Experience the best in Indian logistics with our expert team by your side.
Islamabad No 1 Amil Baba In Pakistan amil baba kala ilm.docxamilabibi1
Islamabad No 1 Amil Baba In Pakistan amil baba kala ilm.docxIslamabad No 1 Amil Baba In Pakistan amil baba kala ilm.docxIslamabad No 1 Amil Baba In Pakistan amil baba kala ilm.docxIslamabad No 1 Amil Baba In Pakistan amil baba kala ilm.docxIslamabad No 1 Amil Baba In Pakistan amil baba kala ilm.docxIslamabad No 1 Amil Baba In Pakistan amil baba kala ilm.docxIslamabad No 1 Amil Baba In Pakistan amil baba kala ilm.docxIslamabad No 1 Amil Baba In Pakistan amil baba kala ilm.docxIslamabad No 1 Amil Baba In Pakistan amil baba kala ilm.docxIslamabad No 1 Amil Baba In Pakistan amil baba kala ilm.docxIslamabad No 1 Amil Baba In Pakistan amil baba kala ilm.docxIslamabad No 1 Amil Baba In Pakistan amil baba kala ilm.docxIslamabad No 1 Amil Baba In Pakistan amil baba kala ilm.docxIslamabad No 1 Amil Baba In Pakistan amil baba kala ilm.docxIslamabad No 1 Amil Baba In Pakistan amil baba kala ilm.docxIslamabad No 1 Amil Baba In Pakistan amil baba kala ilm.docxIslamabad No 1 Amil Baba In Pakistan amil baba kala ilm.docxIslamabad No 1 Amil Baba In Pakistan amil baba kala ilm.docxIslamabad No 1 Amil Baba In Pakistan amil baba kala ilm.docxIslamabad No 1 Amil Baba In Pakistan amil baba kala ilm.docxIslamabad No 1 Amil Baba In Pakistan amil baba kala ilm.docxIslamabad No 1 Amil Baba In Pakistan amil baba kala ilm.docxIslamabad No 1 Amil Baba In Pakistan amil baba kala ilm.docxIslamabad No 1 Amil Baba In Pakistan amil baba kala ilm.docxIslamabad No 1 Amil Baba In Pakistan amil baba kala ilm.docxIslamabad No 1 Amil Baba In Pakistan amil baba kala ilm.docxIslamabad No 1 Amil Baba In Pakistan amil baba kala ilm.docxIslamabad No 1 Amil Baba In Pakistan amil baba kala ilm.docxIslamabad No 1 Amil Baba In Pakistan amil baba kala ilm.docxIslamabad No 1 Amil Baba In Pakistan amil baba kala ilm.docxIslamabad No 1 Amil Baba In Pakistan amil baba kala ilm.docxIslamabad No 1 Amil Baba In Pakistan amil baba kala ilm.docxIslamabad No 1 Amil Baba In Pakistan amil baba kala ilm.docx
Don't Wait Until It's Too Late! 5-Signs Your Garage Door Needs ReplacingCR Garage Doors
This infographic unveils the 5 telltale signs your garage door needs a replacement. Avoid costly repairs and upgrade to a modern, secure, and silent entryway. Visit our website for more information about garage door replacement.
Website-> https://cr-garagedoors.com/
Colors of Wall Paint and Their Mentally Properties.pptxBrendon Jonathan
Discover how different wall paint colors can influence your mood and mental well-being. Learn the psychological effects of colors and find the perfect hue for every room in your home.
Learn about Inspect Edge, the leading platform for efficient inspections, featuring the advanced NSPIRE Inspection Application for seamless property assessments. Discover how the NSPIRE Inspection Application by Inspect Edge revolutionizes property inspections with advanced features and seamless integration.
A Bulgarian work permit is valid for up to one year, after which it can be renewed as long as the conditions of employment have not changed. After obtaining a work permit, the employee will need to apply for a Type D visa at the Bulgarian embassy or consulate in their country. Urgent requirement for Bulgaria 🇧🇬🇧🇬work D Category National Permit Visa ( Indian /Nepali Nationality only) Visa Validity - 3 to 6 months on renewables basis. Job category - General worker/ Helper Salary - 800 Euro @ 8 hrs.+ Over time extra Age- 20- 40 years Total processing time -4-5 Months
All Trophies at Trophy-World Malaysia | Custom Trophies & Plaques Supplier. Come to our Trophy Shop today and check out all our variety of Trophies available. We have the widest range of Trophies in Malaysia. Our team is always ready to greet your needs and discuss with you on your custom Trophy for your event. Rest assured, you will be with the best Trophy Supplier in Malaysia. The official Trophy Malaysia. Thank you for your support.
Unlocking Insights: AI-powered Enhanced Due Diligence Strategies for Increase...RNayak3
Explore how a risk-based approach to Enhanced Due Diligence can deliver effective Anti-Money Laundering (AML) compliance and monitoring in banking and financial services.
The Jamstack Revolution: Building Dynamic Websites with Static Site Generator...Softradix Technologies
In this infographic, the Jamstack architecture emphasizes pre-rendered content and decoupling the frontend from the backend. It leverages static site generators (SSGs) to create fast-loading HTML files and APIs for dynamic functionality. Benefits include improved performance, enhanced security, scalability, and ease of deployment. Real-world examples include Netlify, Gatsby, and Contentful. https://softradix.com/web-development/
Get your dream bridal look with top North Indian makeup artist - Pallavi KadalePallavi Makeup Artist
Achieve your dream wedding day look with renowned North Indian bridal makeup artist, Pallavi Kadale. With years of experience, her expert techniques and skills will leave you looking flawless and radiant. Book today for your perfect bridal makeover.
Get your dream bridal look with top North Indian makeup artist - Pallavi Kadale
One way anova final ppt.
1. one-way ANOVA
Presented By
Aadab Mushrib
F15-3356, M.Phil in Education
Supervisor: Dr. Syed Manzar Abbas Shah,
Asst. Professor, Ph.D, Lahore Leads University
2. What is this test (one-way
ANOVA)for?
An analysis of variance (ANOVA) is used to compare
the means of two or more independent samples
and to test whether the differences between the
means are statistically significant.
The one-way analysis of Variance (one-way
ANOVA) can be thought of as an extension of a t-
test for independent samples. It is used when there
are two or more independent groups.
3. one-way ANOVA
Note:
The independent variable is the categorical
variable that defines the groups that are
compared. e.g., instructional methods, grade
level, or marital status.
The dependent variable is measured variable
whose means are being compared e.g., level
of job satisfaction, or test anxiety.
4. What does this test do?
• The one-way ANOVA compares the means between
the groups you are interested in and determines
whether any of those means are significantly
different from each other. Specifically, it tests the null
hypothesis:
• where µ = group mean and k = number of groups. If,
however, the one-way ANOVA returns a significant
result, we accept the alternative hypothesis (HA),
which is that there are at least 2 group means that
are significantly different from each other.
5. One-way ANOVA uses
Example,
a one-way ANOVA is used to understand whether exam
performance differed based on test anxiety levels amongst
students, dividing students into three independent groups
(e.g., low, medium and high-stressed students).
It only tells you that at least two groups were different.
Since you may have three, four, five or more groups in your
study design, determining which of these groups differ
from each other is important. You can do this using a post-
hoc test.
6. One-way ANOVA Assumptions
1: Your dependent variable should be measured at
the interval or ratio scales (i.e., they are
continuous).
Examples of variables that meet this criterion
include, revision time (measured in hours),
intelligence (measured using IQ score),
exam performance (measured from 0 to 100),
weight (measured in kg).
7. One-way ANOVA Assumptions
2. Your independent variable should consist of two or more
categorical, independent groups. Typically, a one-way ANOVA is
used when you have three or more categorical, independent
groups, but it can be used for just two groups (but an
independent-samples t-test is more commonly used for two
groups).
Example independent variables that meet this criterion
include ethnicity (e.g., 3 groups: Caucasian, African American
and Hispanic), physical activity level (e.g., 4 groups:
sedentary, low, moderate and high), profession (e.g., 5
groups: surgeon, doctor, nurse, dentist, therapist), and so
forth.
8. One-way ANOVA Assumptions
3. You should have independence of observations,
which means that there is no relationship between
the observations in each group or between the
groups themselves.
For example, it is an important assumption of the one-
way ANOVA. If your study fails this assumption, you
will need to use another statistical test instead of the
one-way ANOVA (e.g., a repeated measures design)
9. One-way ANOVA Assumptions
4: There should be no significant outliers. Outliers are
simply single data points within your data that do not
follow the usual pattern.
Example: in a study of 100 students' IQ scores, where
the mean score was 108 with only a small variation
between students, one student had a score of 156,
which is very unusual.
The problem with outliers is that they can have a
negative effect on the one-way ANOVA, reducing the
validity of your results.
10. One-way ANOVA Assumptions
5: Your dependent variable should be
approximately normally distributed for each
category of the independent variable.
One-way ANOVA only requires approximately
normal data because it is quite "robust" to
violations of normality, meaning that assumption
can be a little violated and still provide valid
results. You can test for normality using the
Shapiro-Wilk test of normality.
11. One-way ANOVA Assumptions
6: There needs to be homogeneity of variances.
You can test this assumption in SPSS Statistics
using Levene's test for homogeneity of variances.
If your data fails this assumption, you will need
to not only carry out a Welch ANOVA instead of a
one-way ANOVA, which you can do using SPSS
Statistics, but also use a different post-hoc test.
12. Setup in SPSS Statistics
In SPSS Statistics, we separated the groups for
analysis by creating a grouping variable called
Course (i.e., the independent variable), and
gave the beginners course a value of "1", the
intermediate course a value of "2" and the
advanced course a value of "3". Time to
complete the set problem was entered under
the variable name Time (i.e., the dependent
variable).
13. Test Procedure in SPSS Statistics
Click Analyze > Compare Means > One-Way ANOVA.
14. You will be presented with the following screen:
15. Test Procedure in SPSS Statistics (cont…)
Transfer the dependent variable (Time) into the Dependent
List: box and the independent variable (Course) into the
Factor: box using the appropriate buttons (or drag-and-drop
the variables into the boxes), and click Post Hoc button, as
indicted in the diagram below:
17. Click the button. Tick the Descriptive checkbox in
the –Statistics–area
18. table provides some very useful descriptive statistics,
including the mean, SD and 95% confidence intervals
for the dependent variable (Time) for each separate
group (Beginners, Intermediate and Advanced),
19. this table shows the output of the ANOVA analysis. We
can see that the significance level is 0.021 (p = .021),
which is below 0.05. therefore, there is a statistically
significant difference in the mean length of time to
complete the spreadsheet problem between the
different courses taken
20. Multiple Comparisons table
Multiple Comparisons table, We can see that
there is a significant difference in time to
complete the problem between the group that
took the beginner course and the intermediate
course (p = 0.046), as well as between the
beginner course and advanced course (p= 0.034).
However, there were no differences between the
groups that took the intermediate and advanced
course (p= 0.989).
22. Reporting the output of the
one-way ANOVA
There was a statistically significant difference between
groups as determined by one-way ANOVA (F(2,27) =
4.467, p = .021).
A Tukey post-hoc test revealed that the time to
complete the problem was statistically significantly
lower after taking the intermediate (23.6 ± 3.3 min, p=
.046) and advanced (23.4 ± 3.2 min, p= .034) course
compared to the beginners course (27.2 ± 3.0 min).
There were no statistically significant differences
between the intermediate and advanced groups
(p = .989).
23. NOTE:
If your study design not only involves one
dependent variable and one independent
variable, but also a third variable (known as a
"covariate") that you want to "statistically
control", you may need to perform an ANCOVA
(analysis of covariance), which can be thought
of as an extension of the one-way ANOVA.