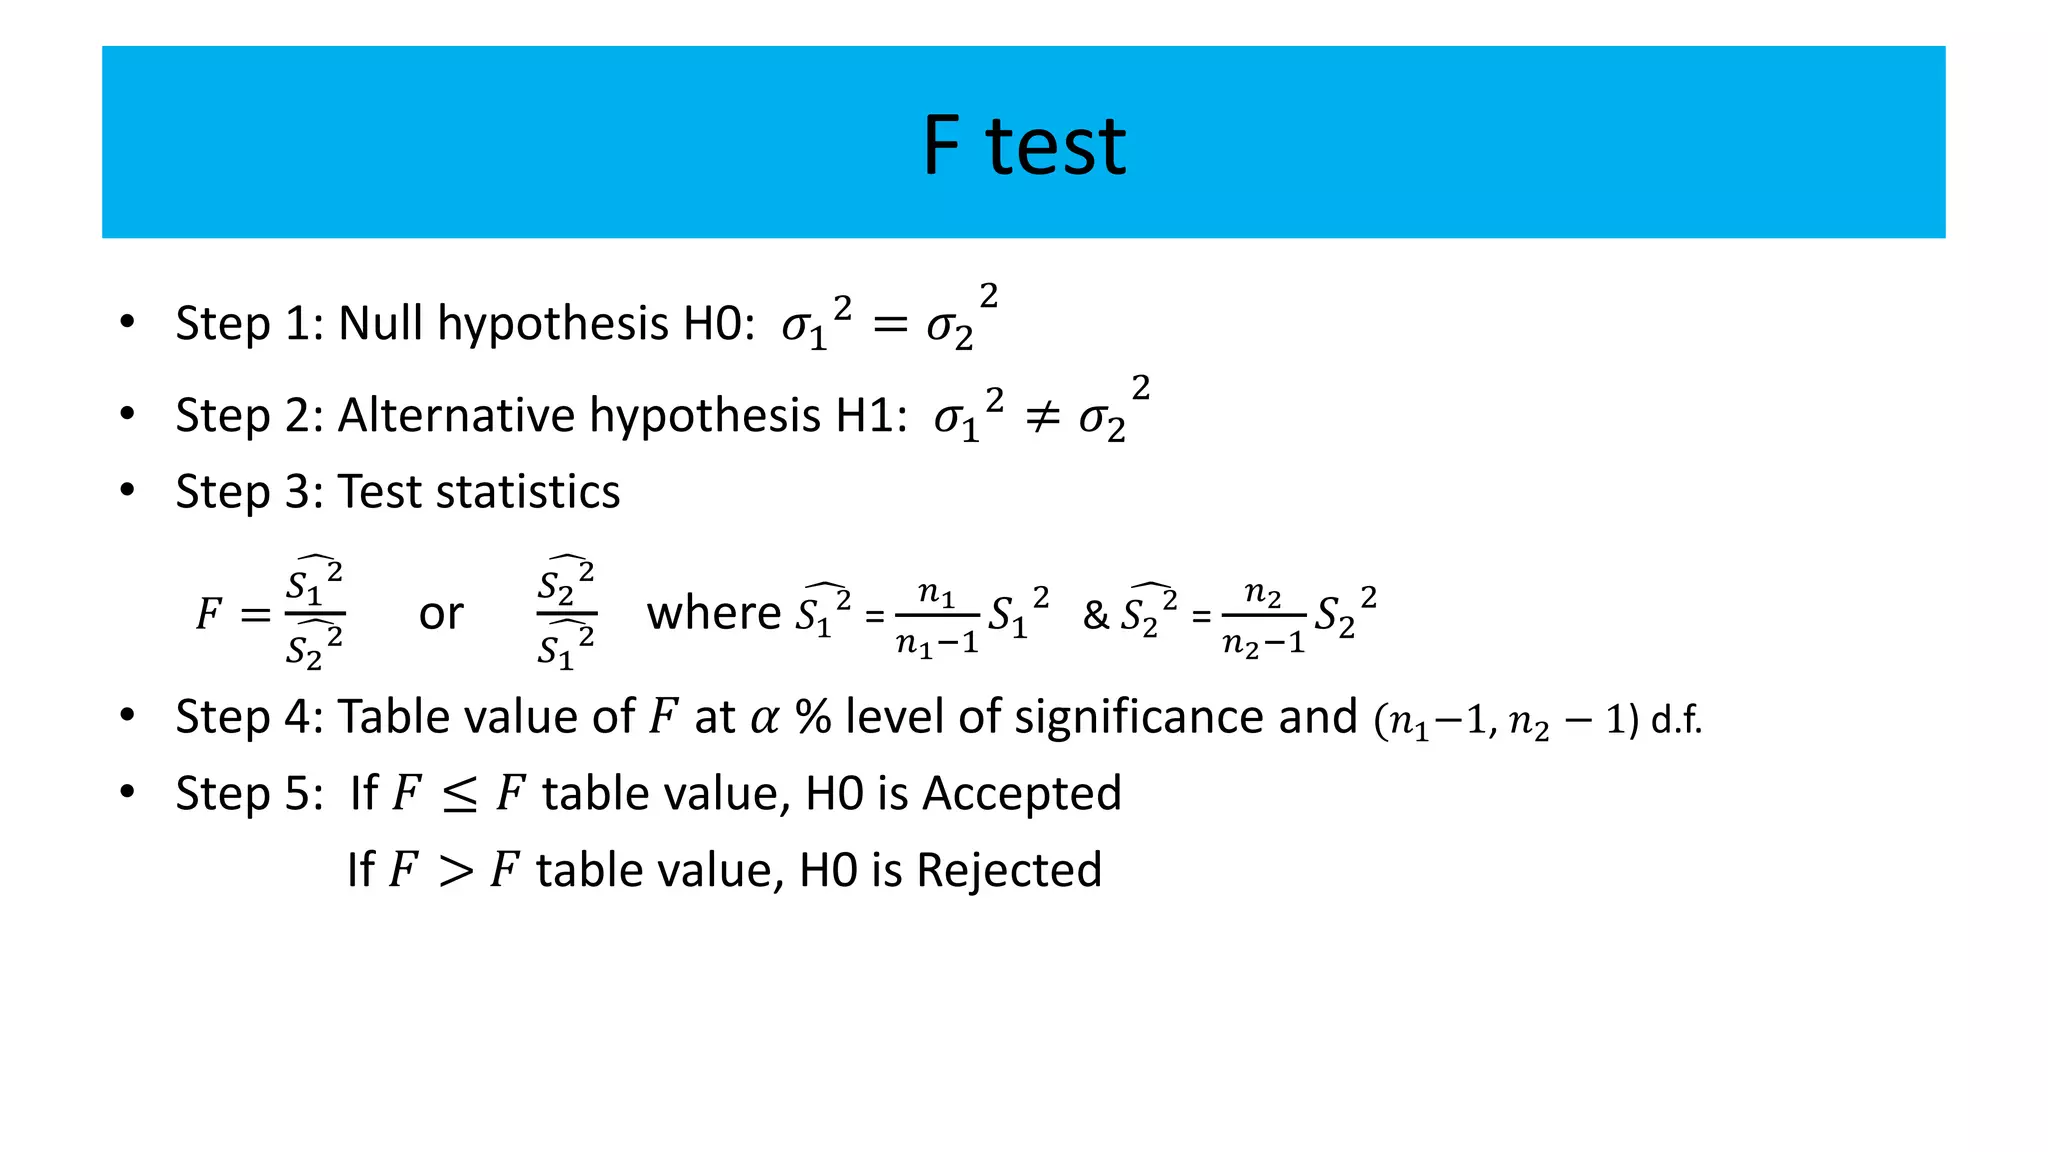
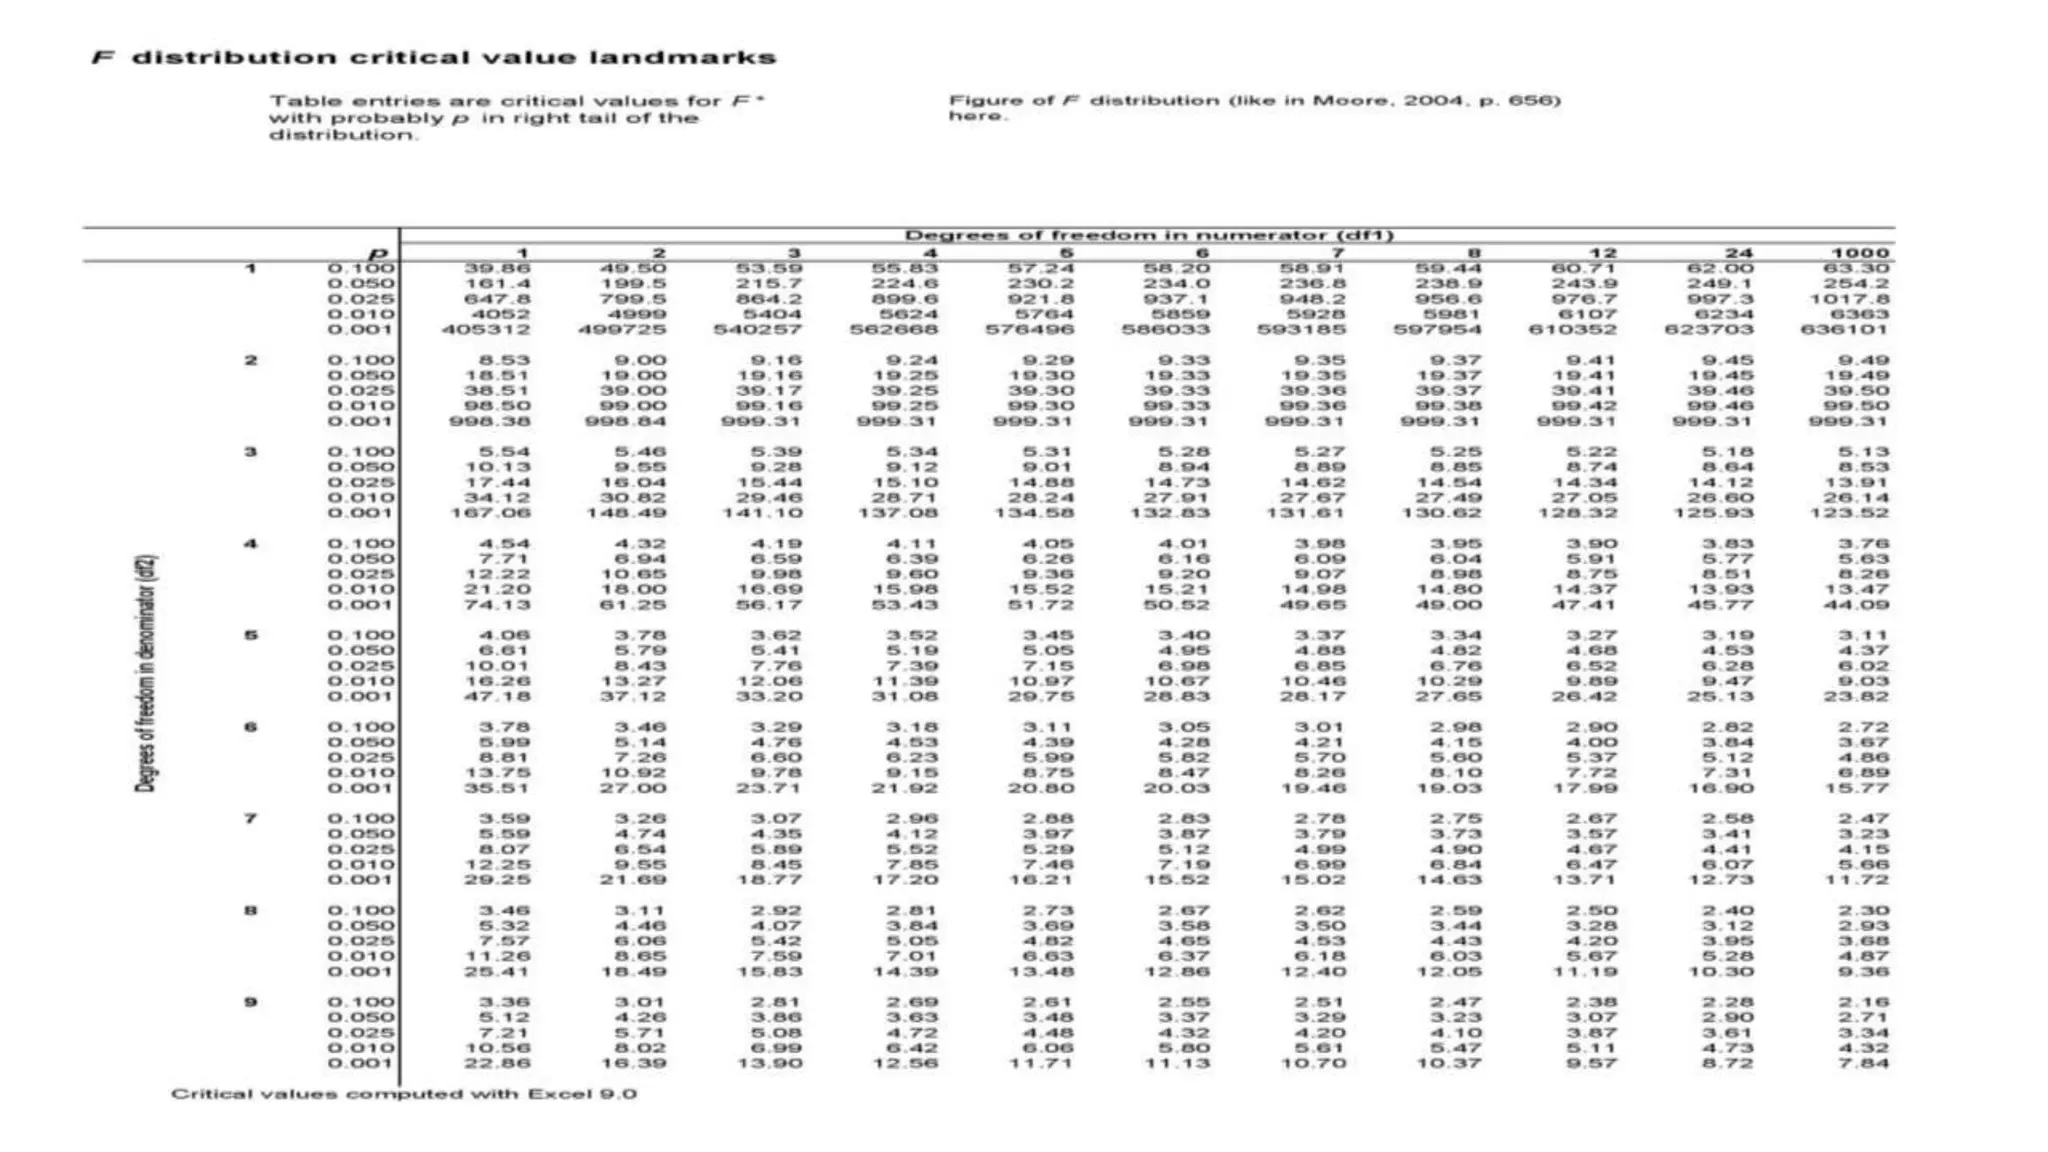
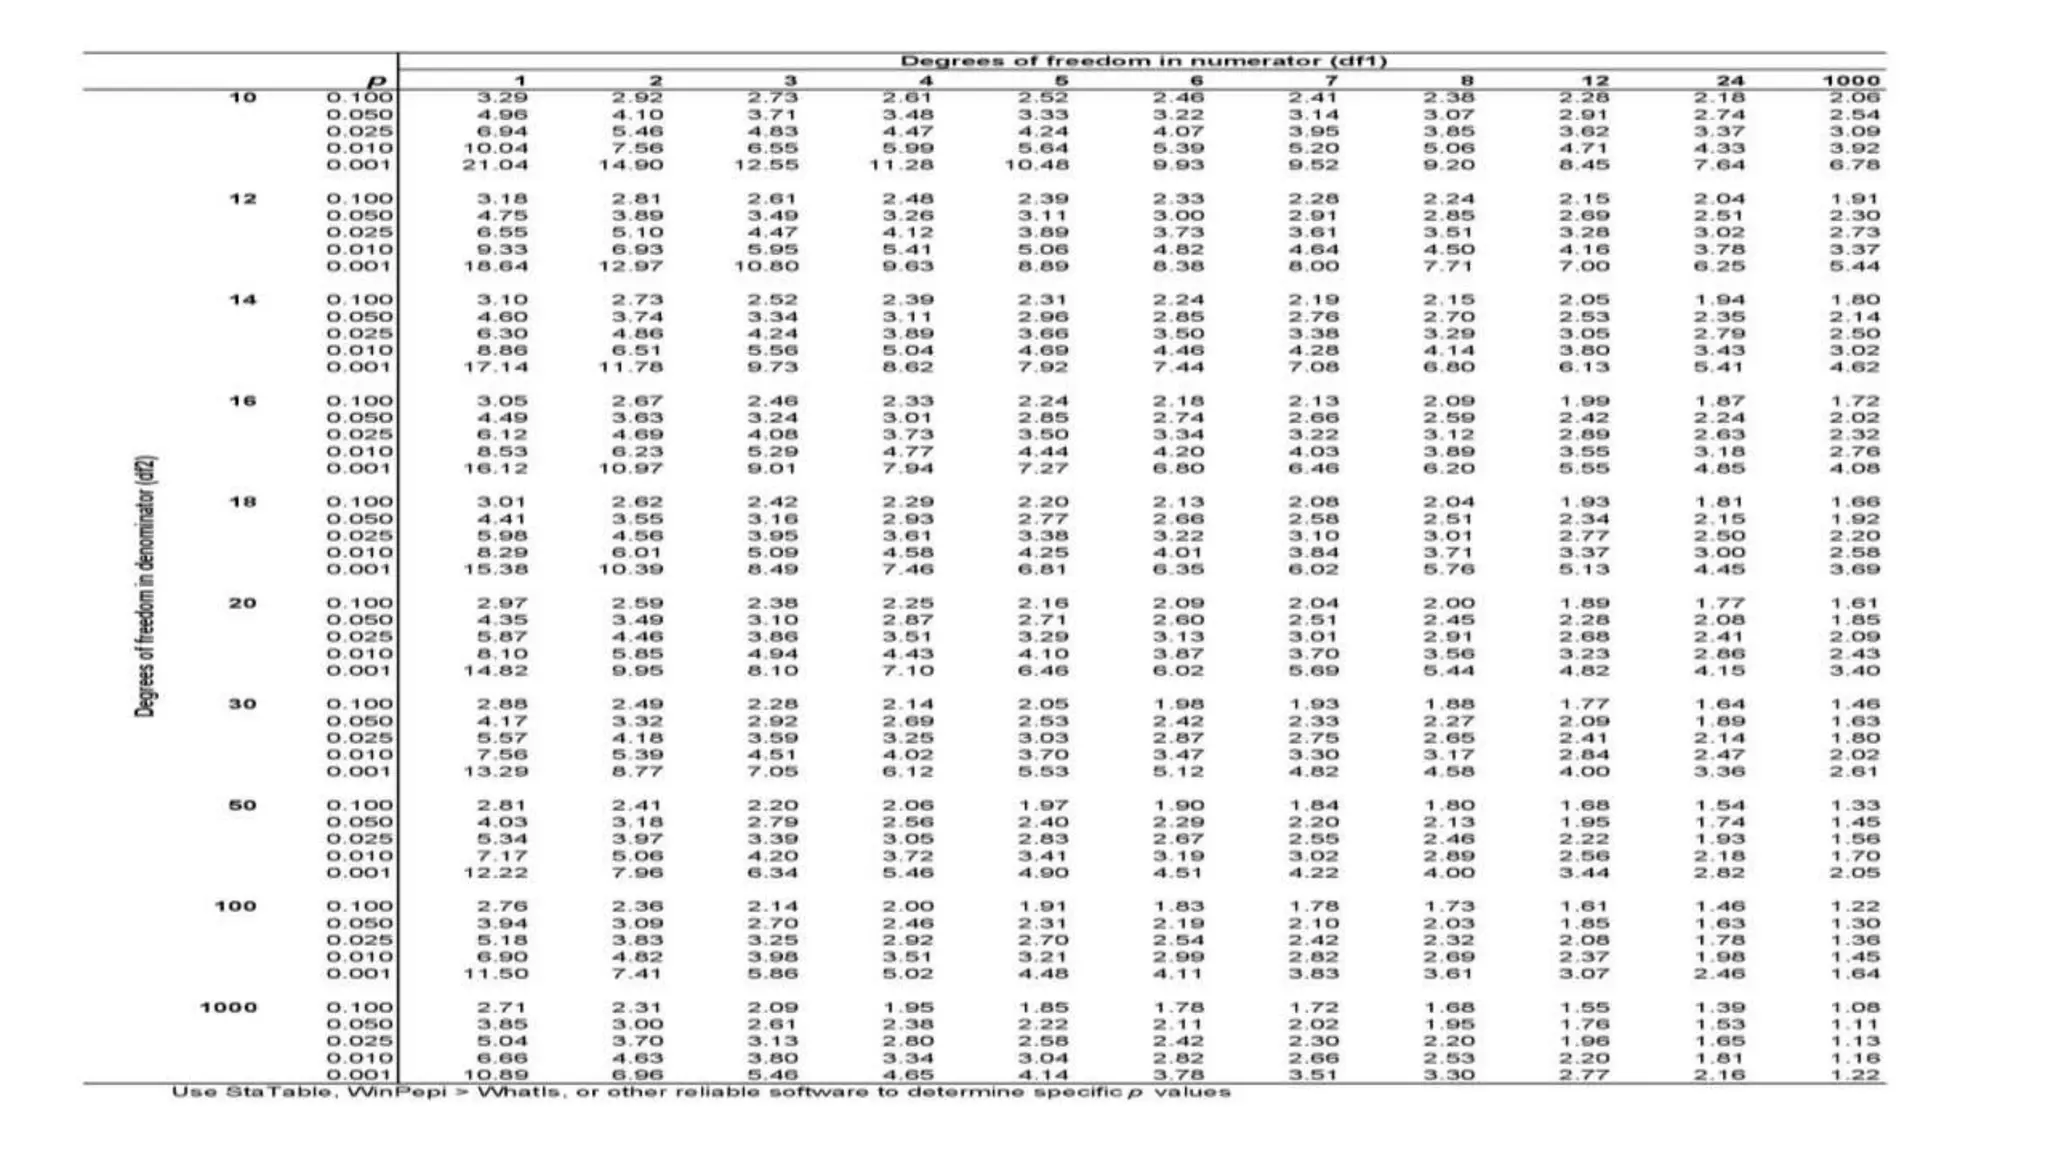
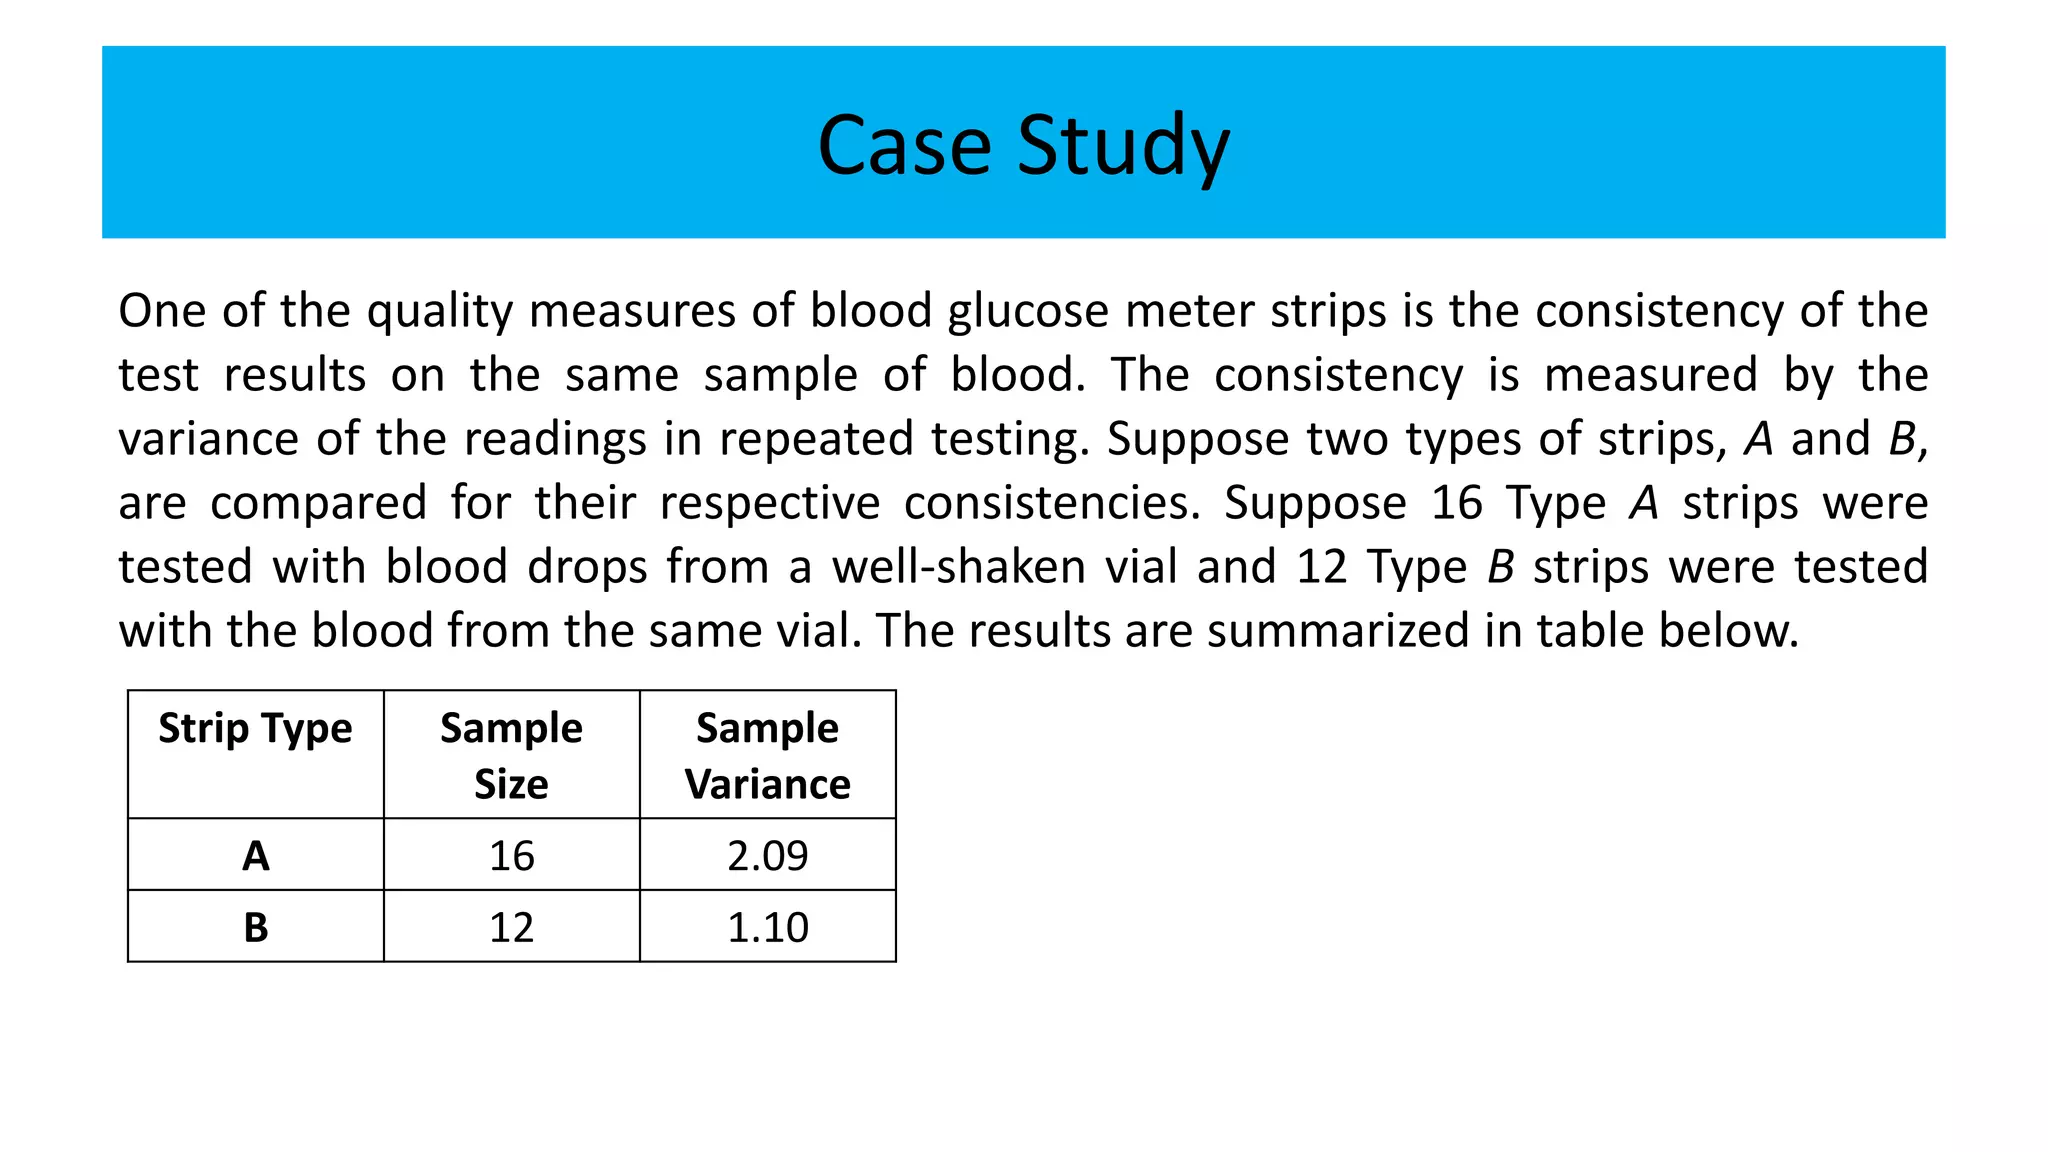
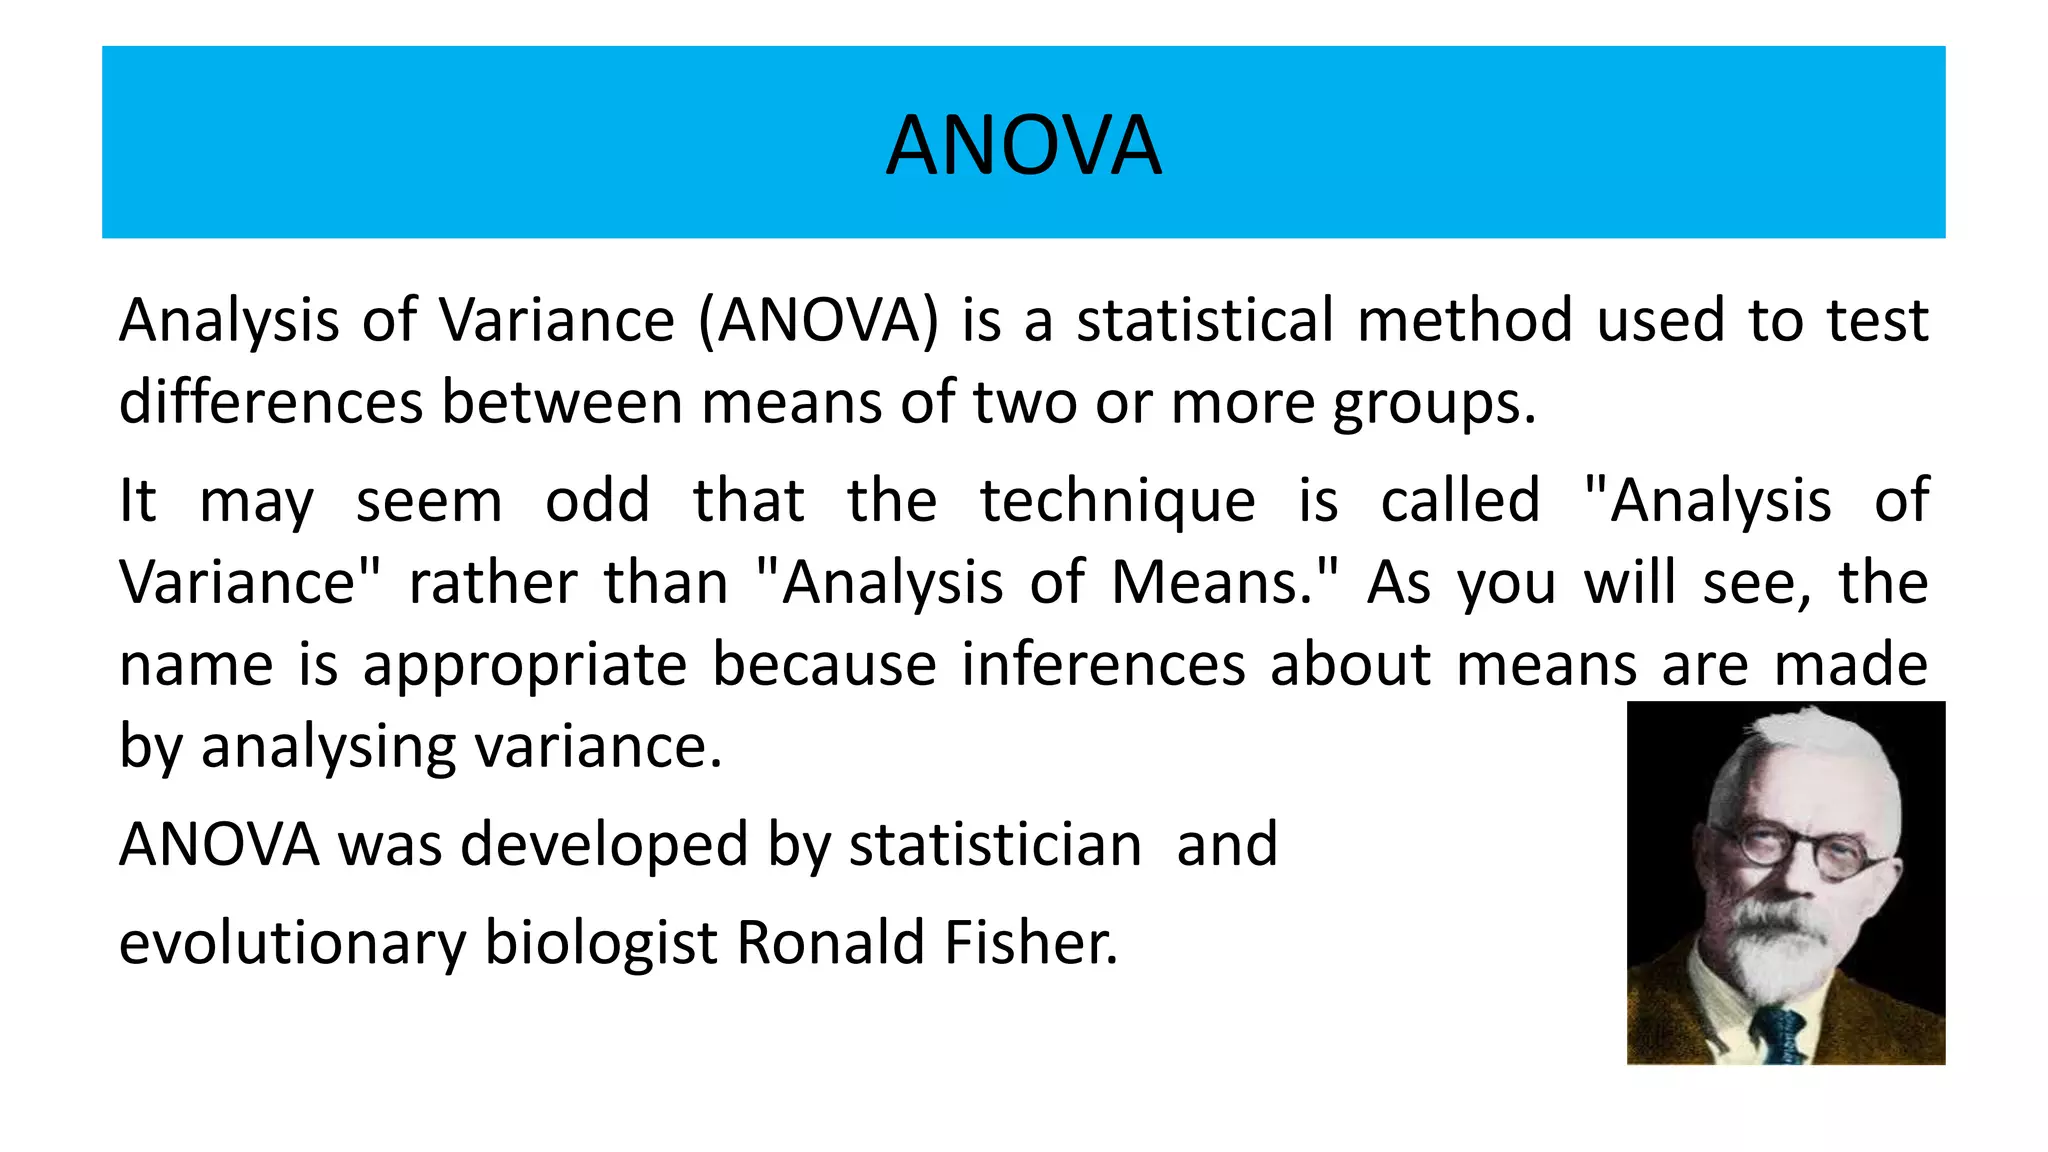
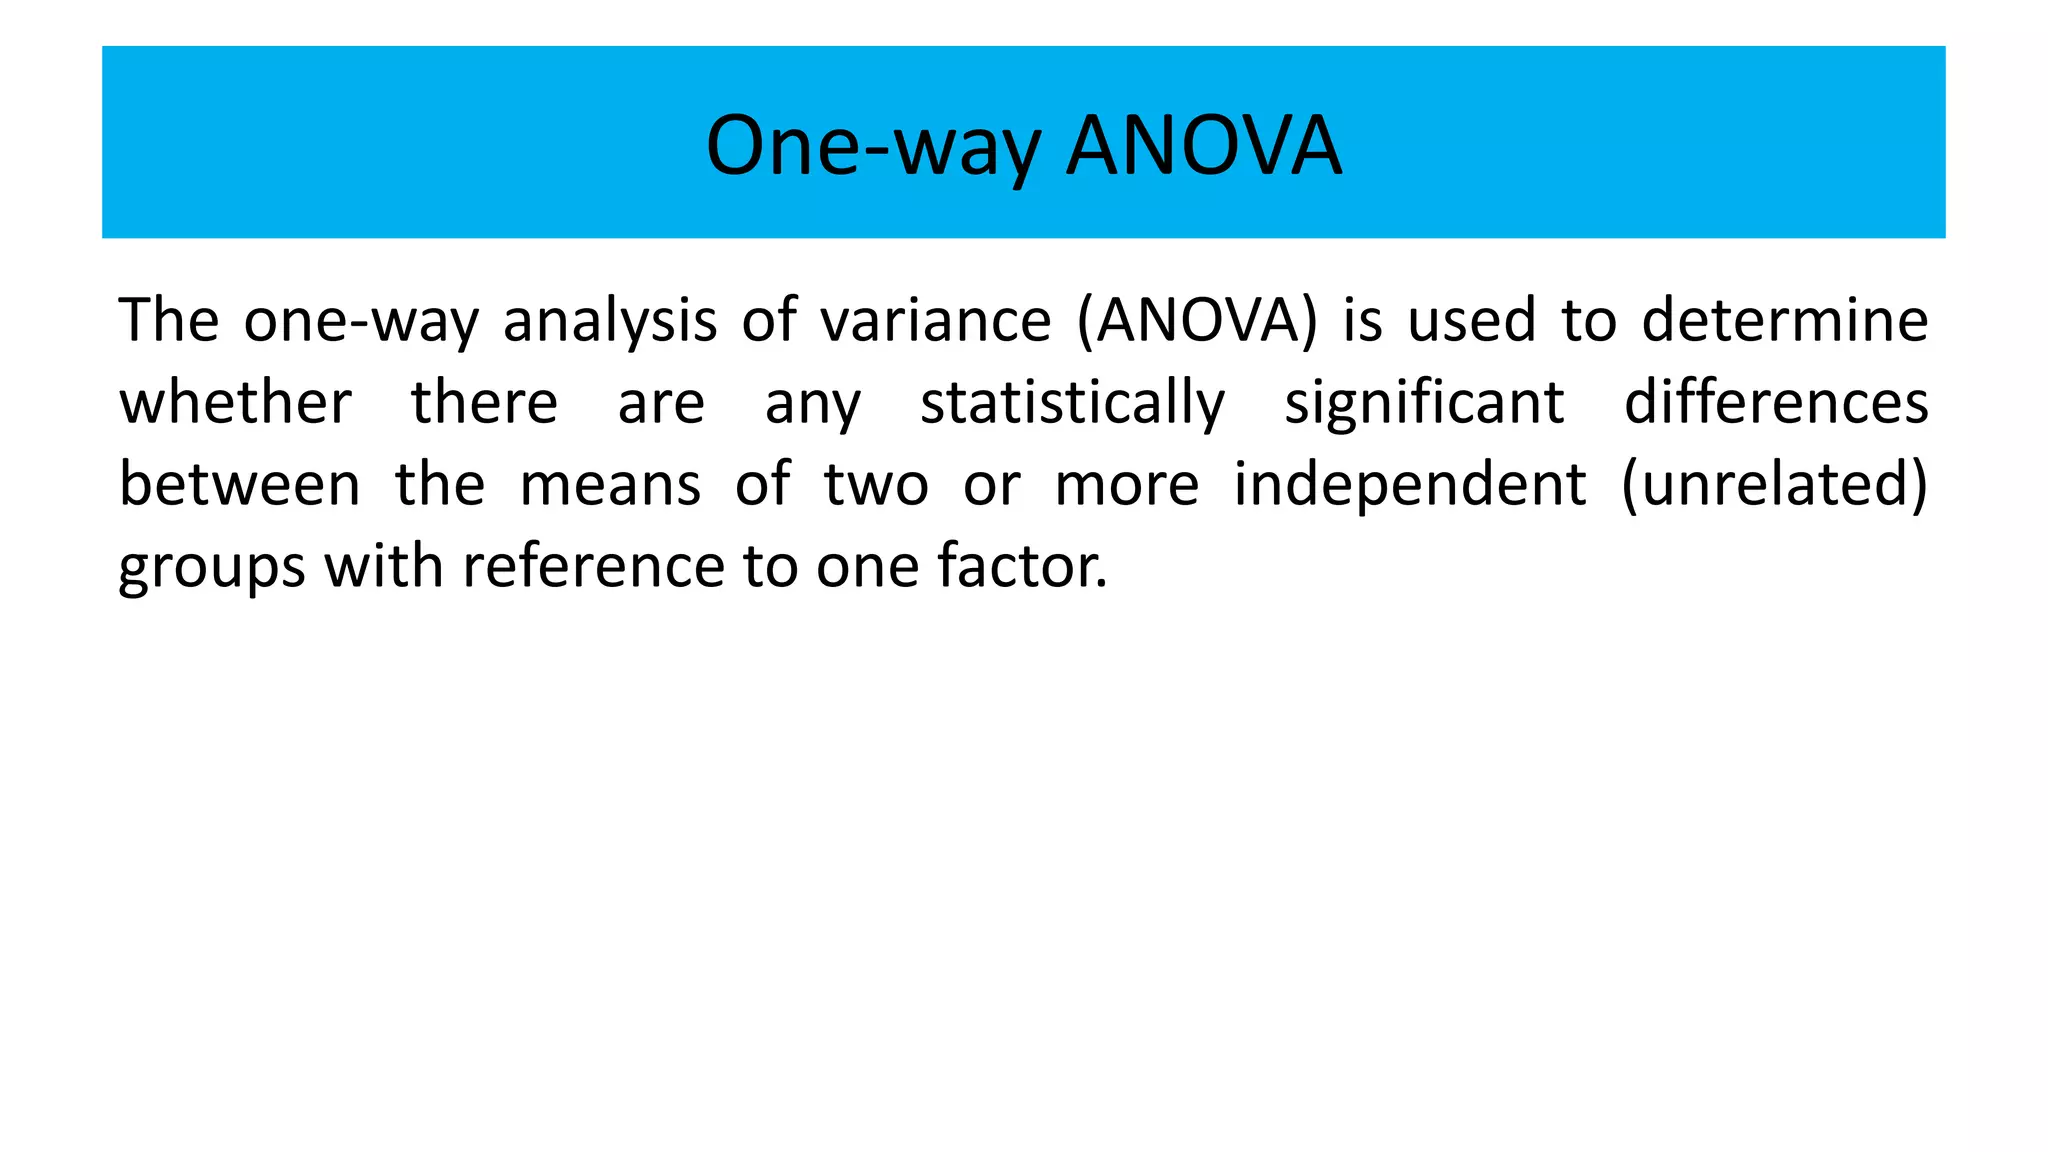
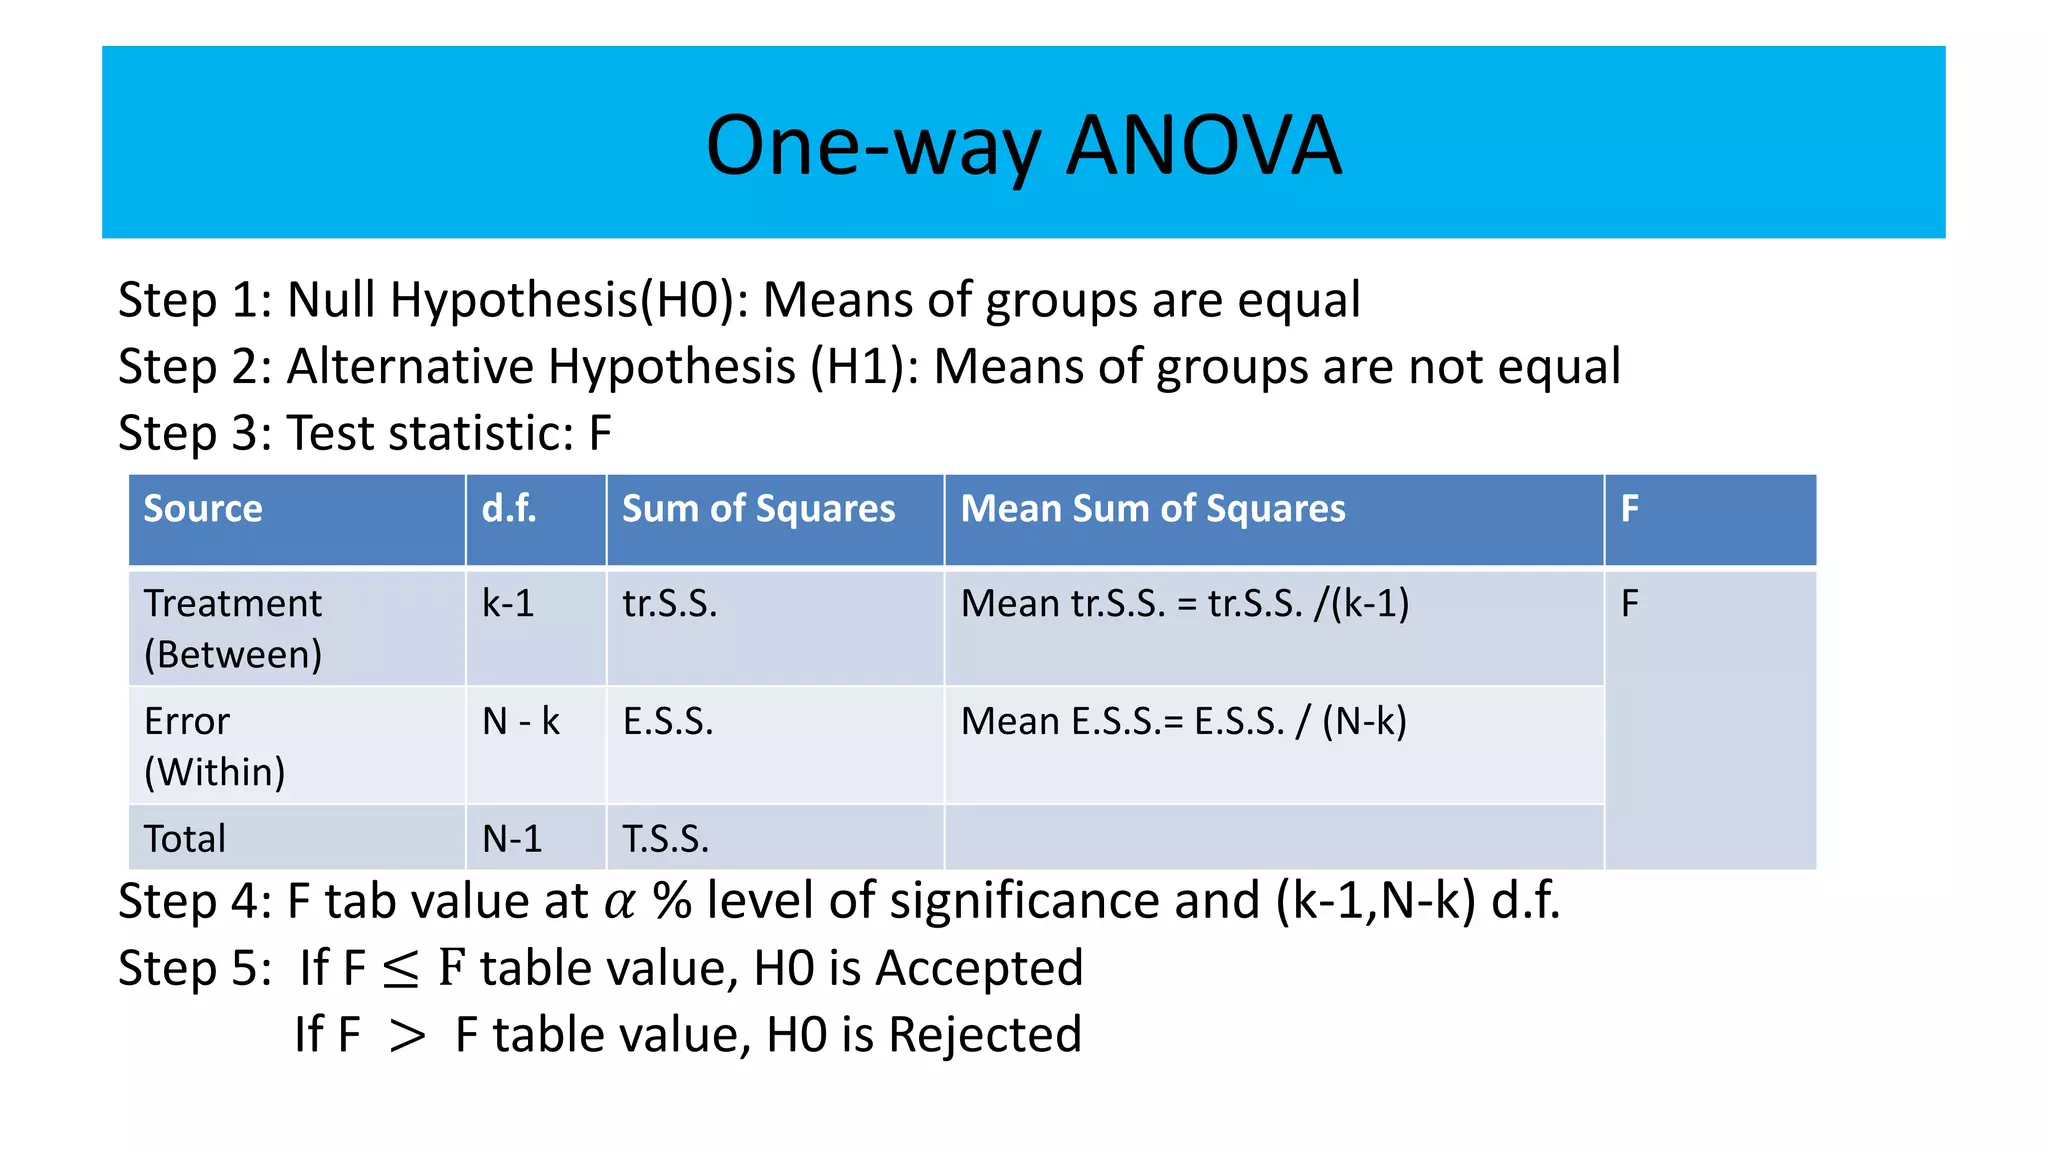
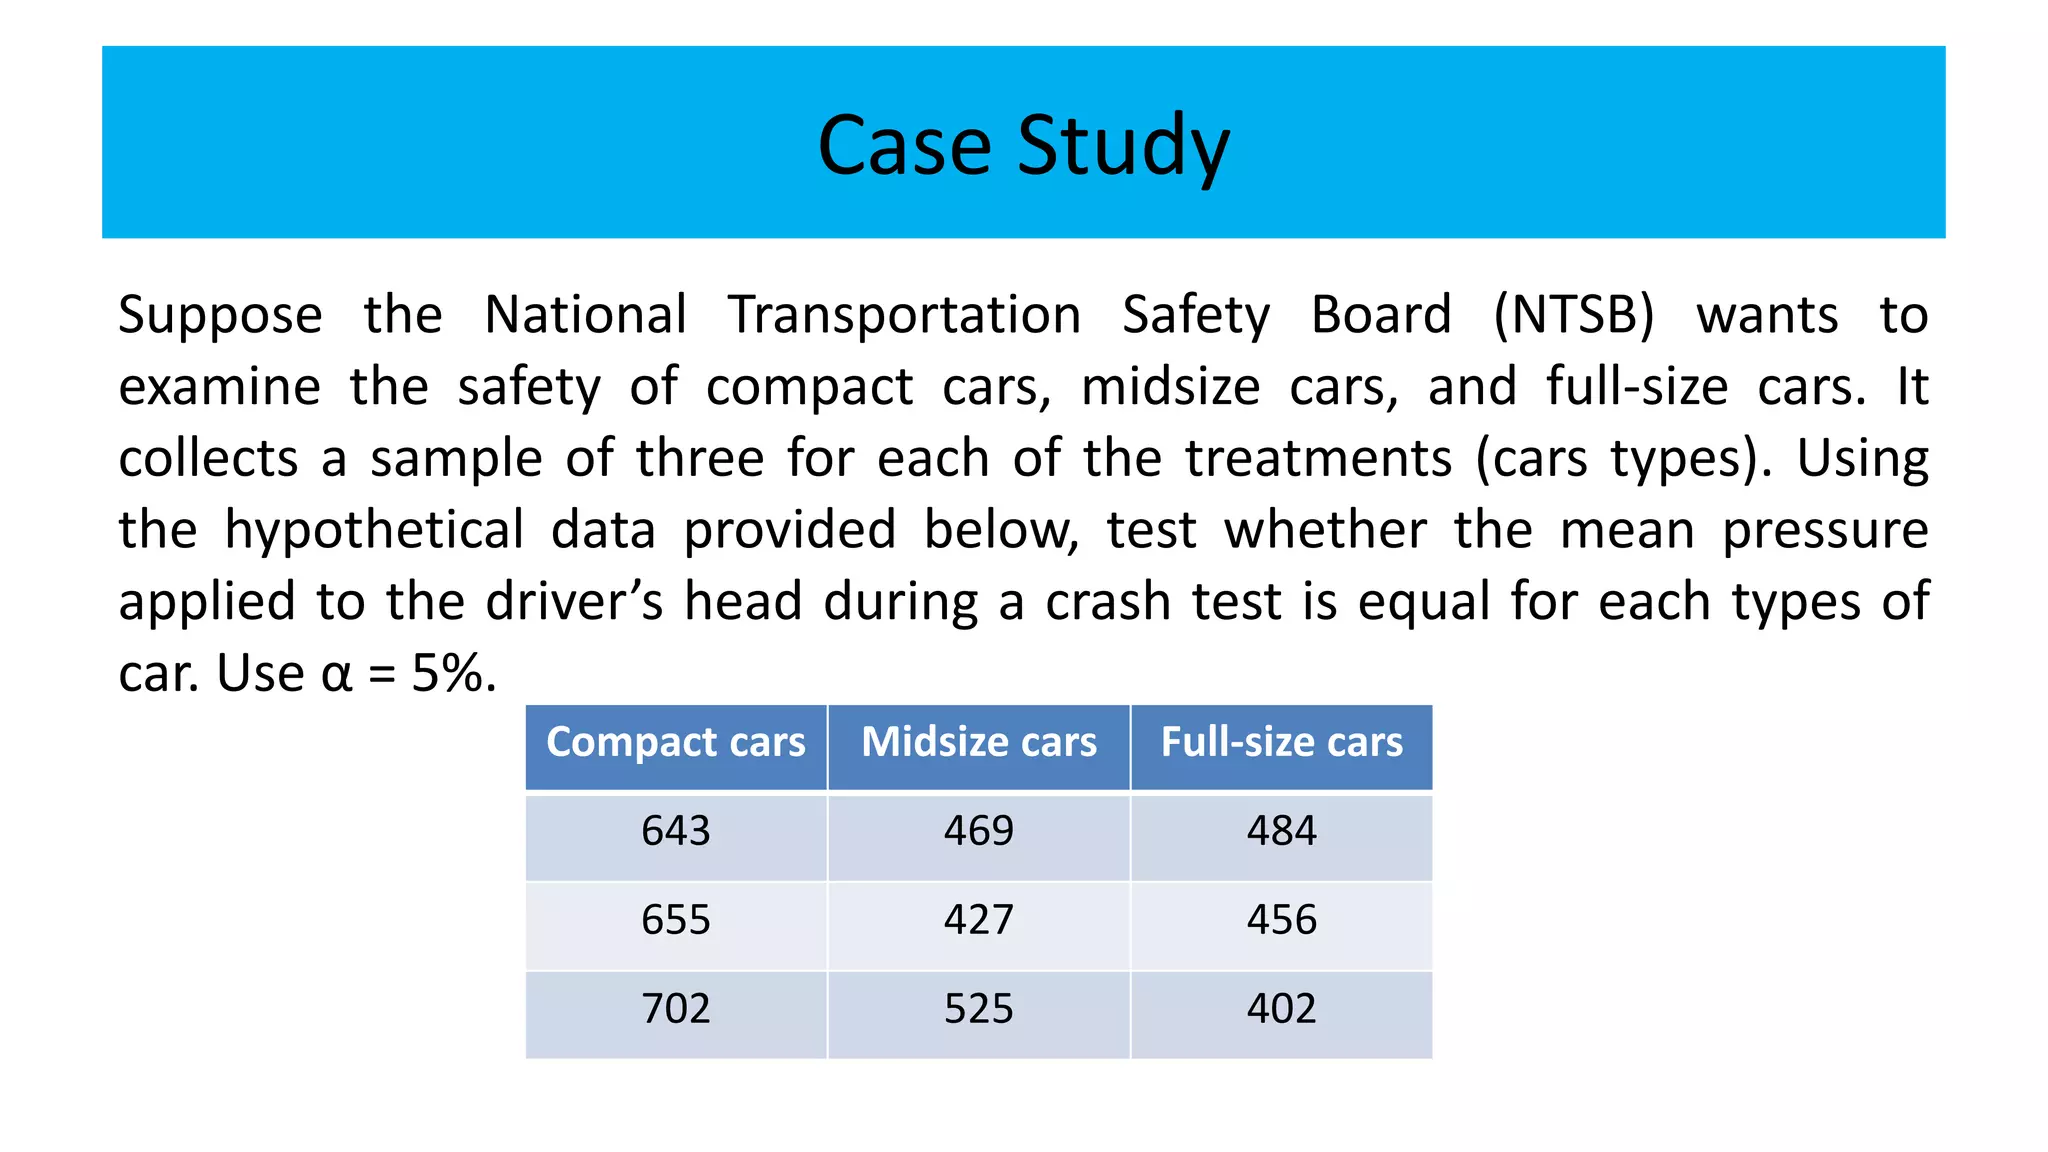
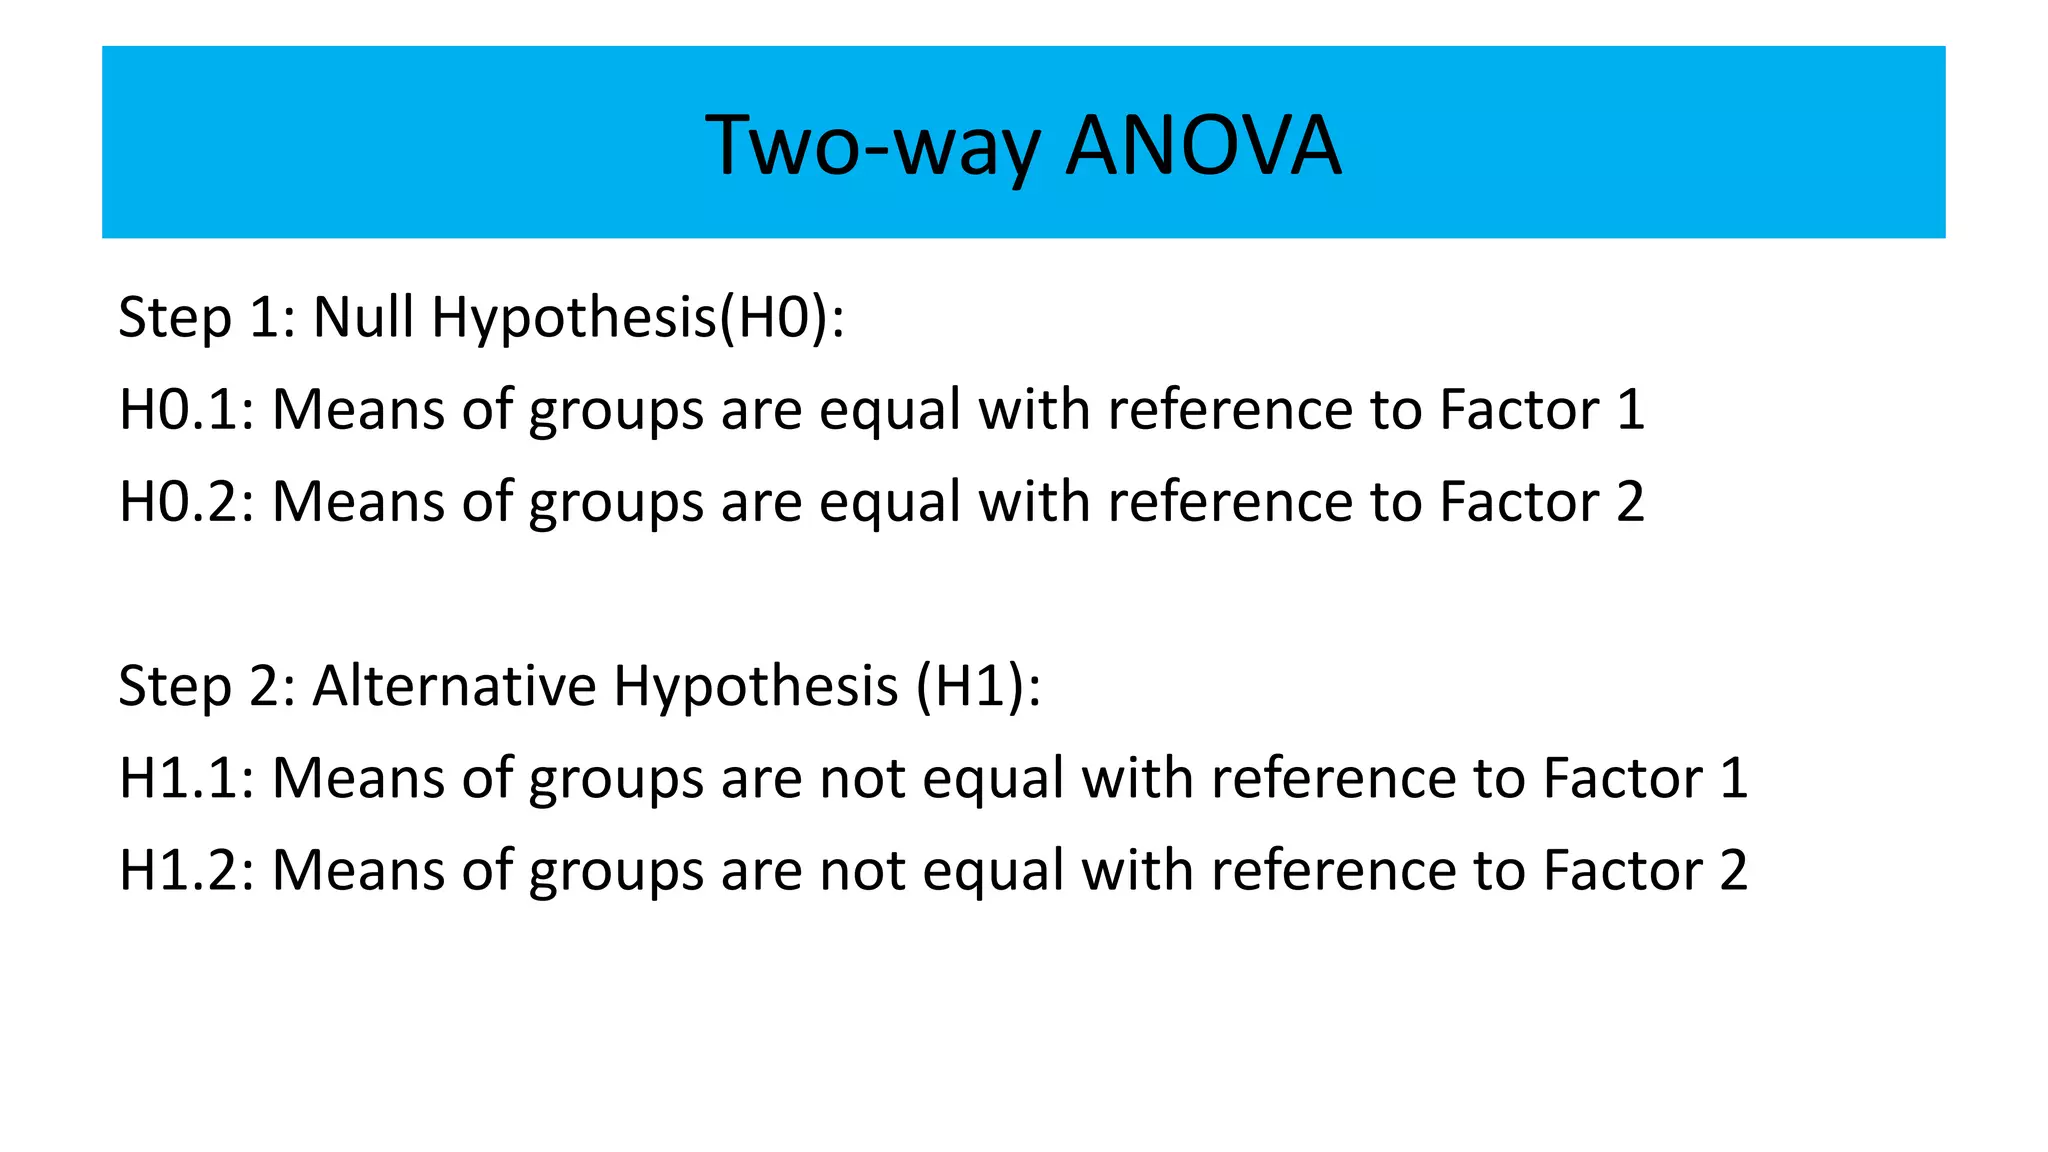
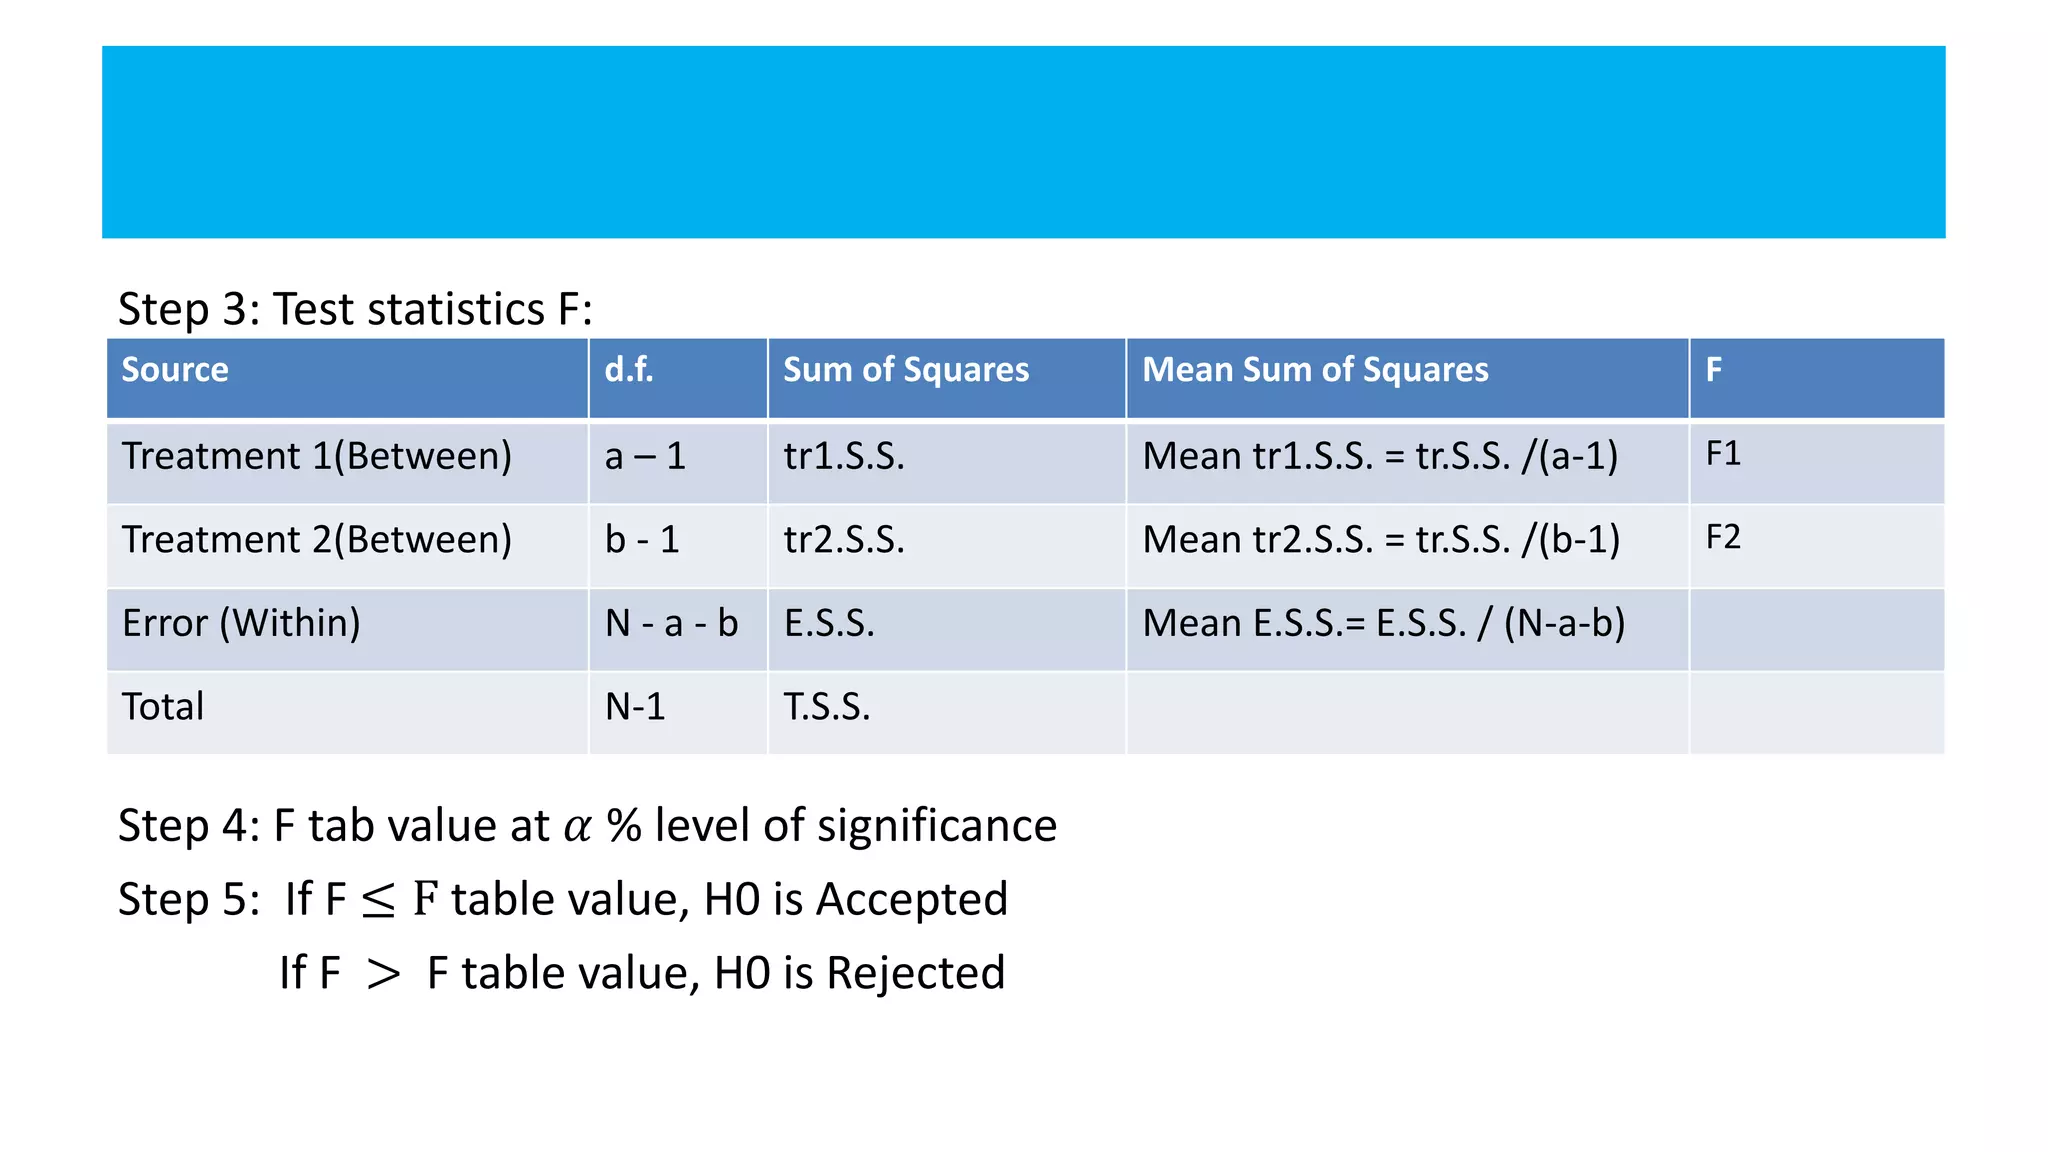
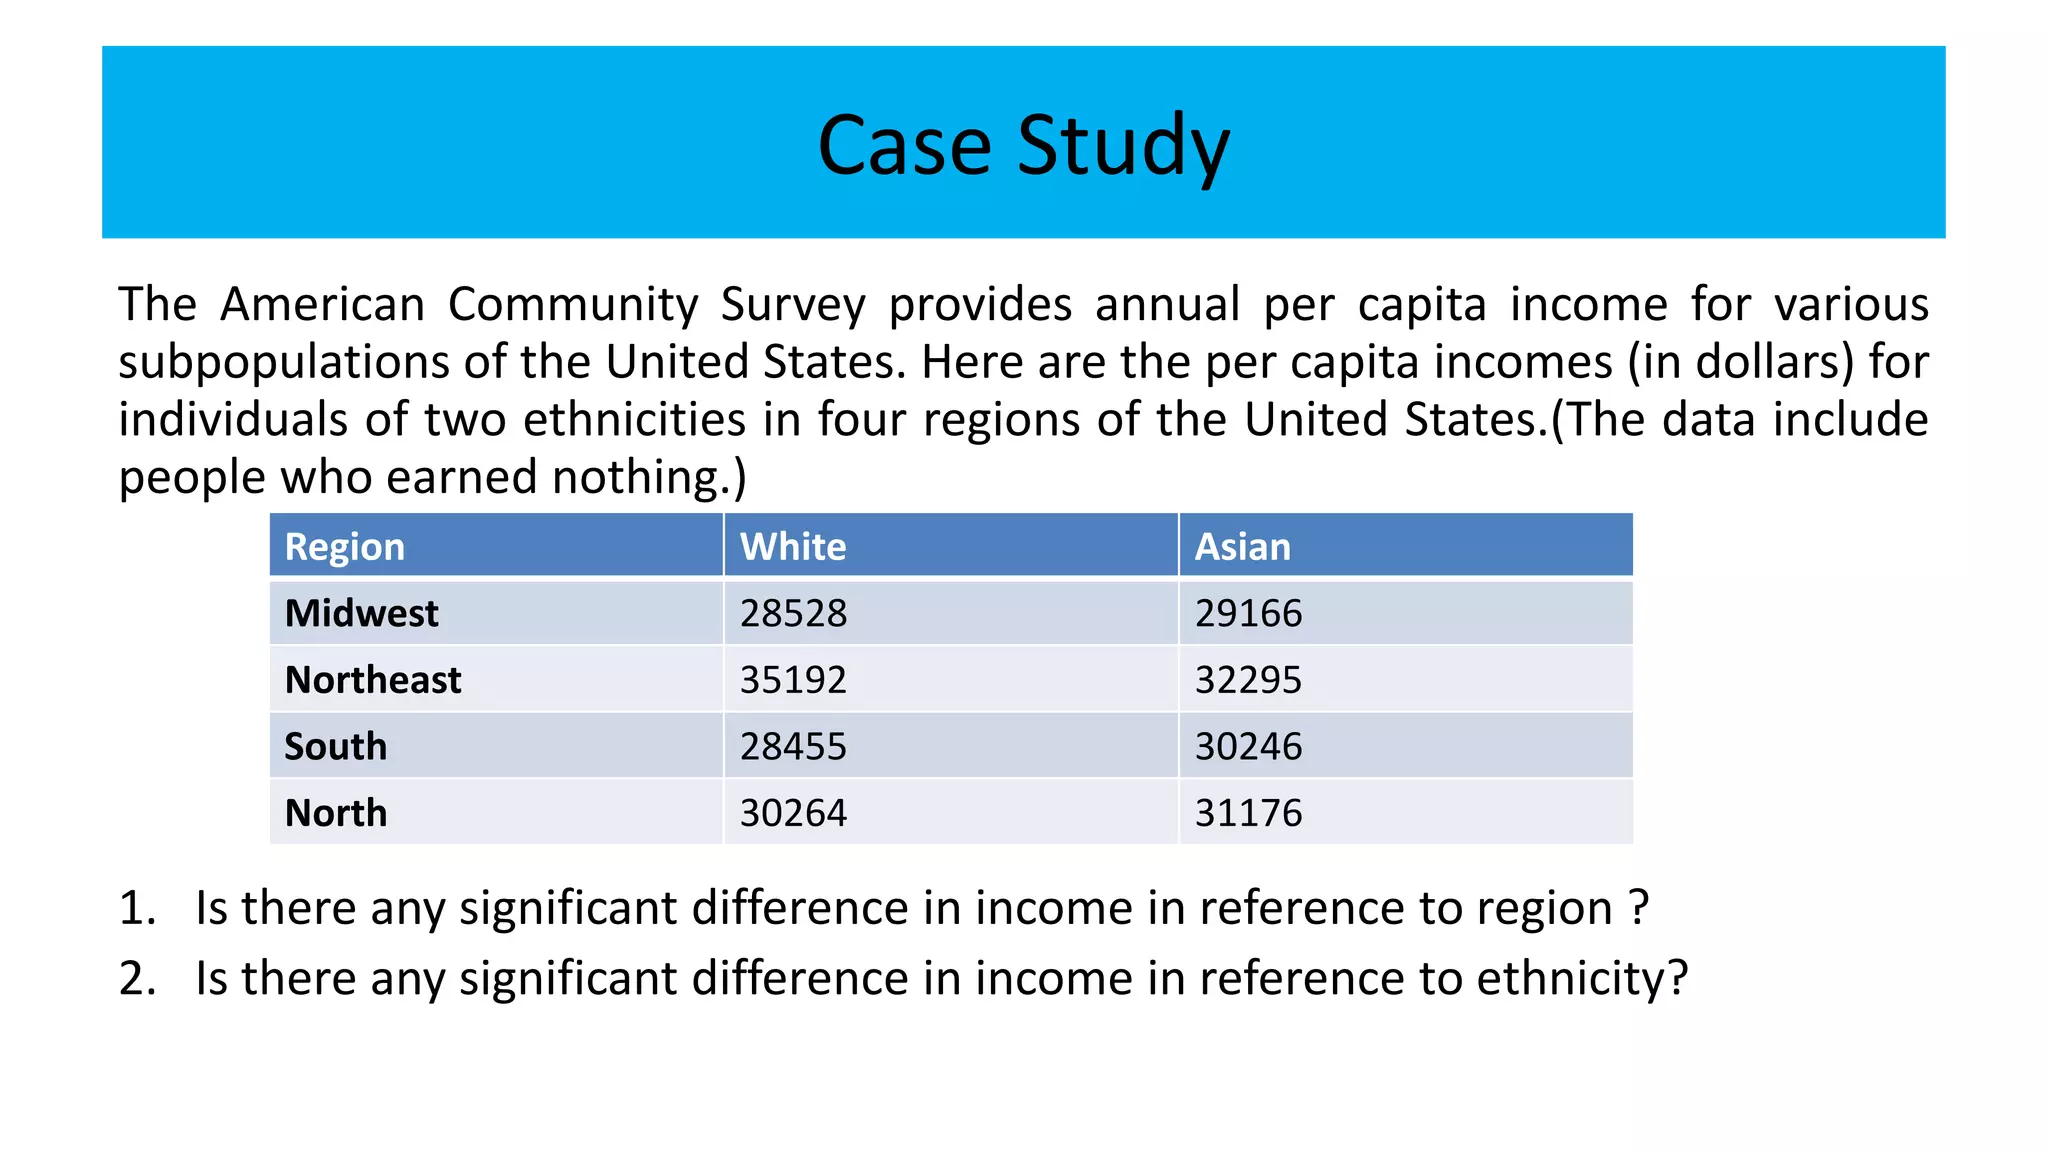
2. F test
• Step 1: Null hypothesis H0: 𝜎1
2
= 𝜎2
2
• Step 2: Alternative hypothesis H1: 𝜎1
2 ≠ 𝜎2
2
• Step 3: Test statistics
𝐹 =
𝑆1
2
𝑆2
2
or
𝑆2
2
𝑆1
2
where 𝑆1
2
=
𝑛1
𝑛1−1
𝑆1
2
& 𝑆2
2
=
𝑛2
𝑛2−1
𝑆2
2
• Step 4: Table value of 𝐹 at 𝛼 % level of significance and (𝑛1−1, 𝑛2 − 1) d.f.
• Step 5: If 𝐹 ≤ 𝐹 table value, H0 is Accepted
If 𝐹 > 𝐹 table value, H0 is Rejected
3.
4.
5. Case Study
One of the quality measures of blood glucose meter strips is the consistency of the
test results on the same sample of blood. The consistency is measured by the
variance of the readings in repeated testing. Suppose two types of strips, A and B,
are compared for their respective consistencies. Suppose 16 Type A strips were
tested with blood drops from a well-shaken vial and 12 Type B strips were tested
with the blood from the same vial. The results are summarized in table below.
Strip Type Sample
Size
Sample
Variance
A 16 2.09
B 12 1.10
6. ANOVA
Analysis of Variance (ANOVA) is a statistical method used to test
differences between means of two or more groups.
It may seem odd that the technique is called "Analysis of
Variance" rather than "Analysis of Means." As you will see, the
name is appropriate because inferences about means are made
by analysing variance.
ANOVA was developed by statistician and
evolutionary biologist Ronald Fisher.
7. Assumptions of ANOVA
(i) All populations involved follow a normal distribution.
(ii) All populations have the same variance (or standard
deviation).
(iii)The samples are randomly selected and independent of one
another.
8. One-way & Two-way ANOVA
One-way ANOVA
To test hypotheses about the mean on one variable for three or
more groups.
Two-way ANOVA
To test hypotheses about the mean on two variable for three or
more groups.
9. One-way ANOVA
The one-way analysis of variance (ANOVA) is used to determine
whether there are any statistically significant differences
between the means of two or more independent (unrelated)
groups with reference to one factor.
10. One-way ANOVA
Step 1: Null Hypothesis(H0): Means of groups are equal
Step 2: Alternative Hypothesis (H1): Means of groups are not equal
Step 3: Test statistic: F
Step 4: F tab value at 𝛼 % level of significance and (k-1,N-k) d.f.
Step 5: If F ≤ F table value, H0 is Accepted
If F > F table value, H0 is Rejected
Source d.f. Sum of Squares Mean Sum of Squares F
Treatment
(Between)
k-1 tr.S.S. Mean tr.S.S. = tr.S.S. /(k-1) F
Error
(Within)
N - k E.S.S. Mean E.S.S.= E.S.S. / (N-k)
Total N-1 T.S.S.
11. Case Study
Suppose the National Transportation Safety Board (NTSB) wants to
examine the safety of compact cars, midsize cars, and full-size cars. It
collects a sample of three for each of the treatments (cars types). Using
the hypothetical data provided below, test whether the mean pressure
applied to the driver’s head during a crash test is equal for each types of
car. Use α = 5%.
Compact cars Midsize cars Full-size cars
643 469 484
655 427 456
702 525 402
12. Two-way ANOVA
The two-way analysis of variance (ANOVA) is used to determine
whether there are any statistically significant differences
between the means of two or more independent (unrelated)
groups with reference to two factors.
13. Two-way ANOVA
Step 1: Null Hypothesis(H0):
H0.1: Means of groups are equal with reference to Factor 1
H0.2: Means of groups are equal with reference to Factor 2
Step 2: Alternative Hypothesis (H1):
H1.1: Means of groups are not equal with reference to Factor 1
H1.2: Means of groups are not equal with reference to Factor 2
14. Step 3: Test statistics F:
Step 4: F tab value at 𝛼 % level of significance
Step 5: If F ≤ F table value, H0 is Accepted
If F > F table value, H0 is Rejected
Source d.f. Sum of Squares Mean Sum of Squares F
Treatment 1(Between) a – 1 tr1.S.S. Mean tr1.S.S. = tr.S.S. /(a-1) F1
Treatment 2(Between) b - 1 tr2.S.S. Mean tr2.S.S. = tr.S.S. /(b-1) F2
Error (Within) N - a - b E.S.S. Mean E.S.S.= E.S.S. / (N-a-b)
Total N-1 T.S.S.
15. Case Study
The American Community Survey provides annual per capita income for various
subpopulations of the United States. Here are the per capita incomes (in dollars) for
individuals of two ethnicities in four regions of the United States.(The data include
people who earned nothing.)
1. Is there any significant difference in income in reference to region ?
2. Is there any significant difference in income in reference to ethnicity?
Region White Asian
Midwest 28528 29166
Northeast 35192 32295
South 28455 30246
North 30264 31176