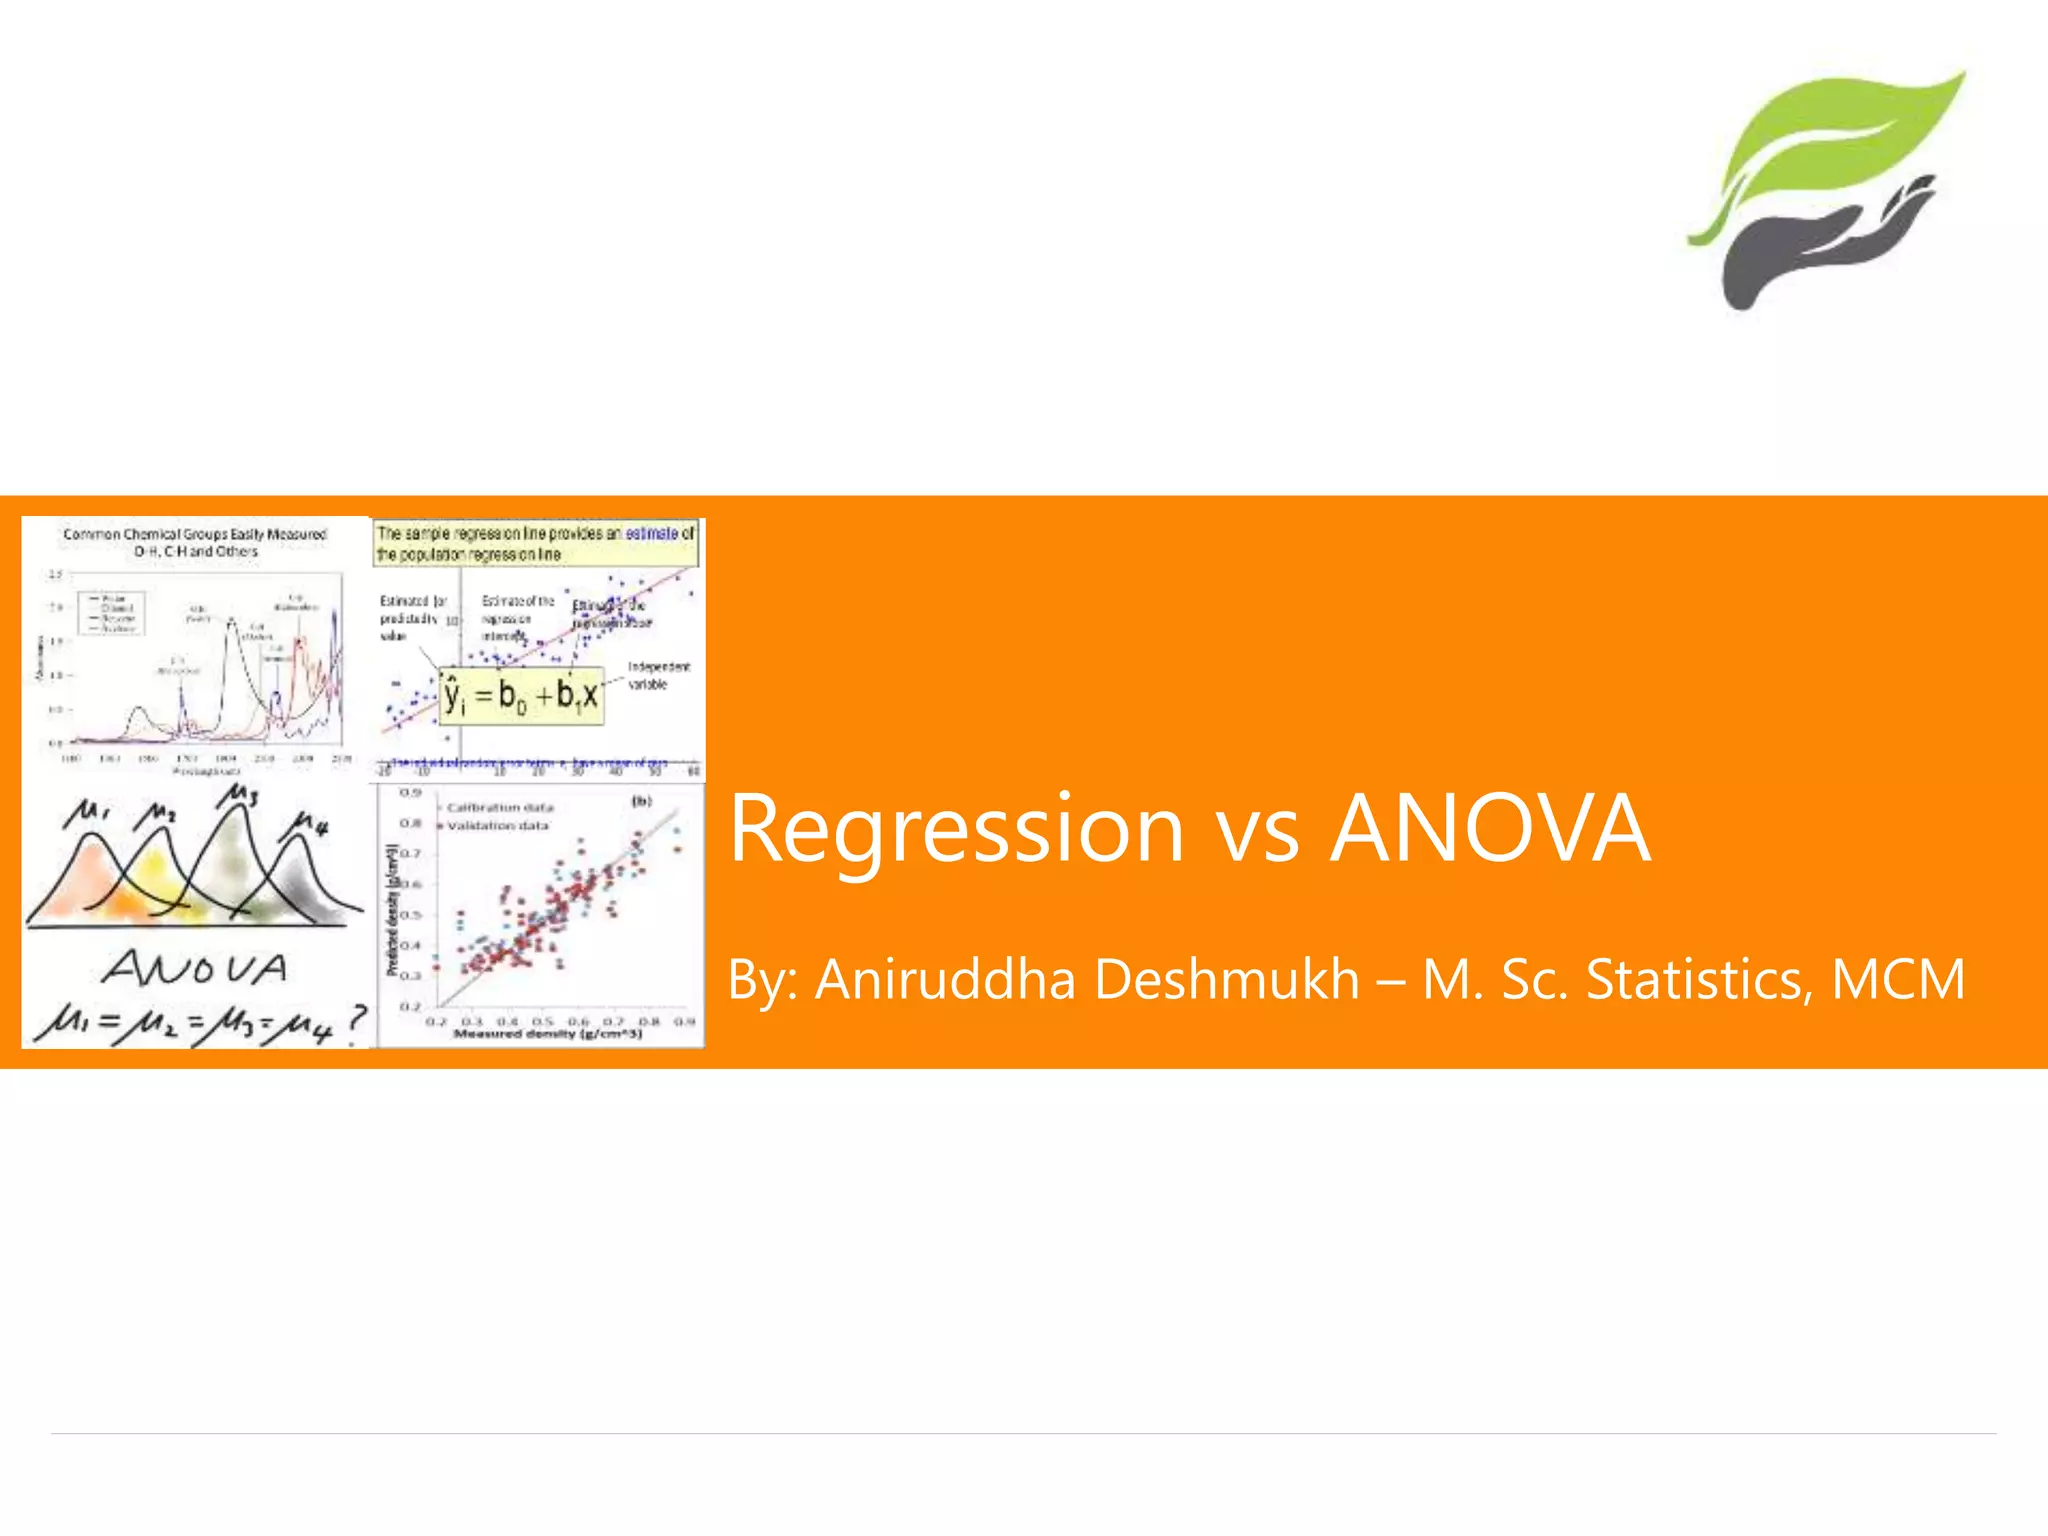
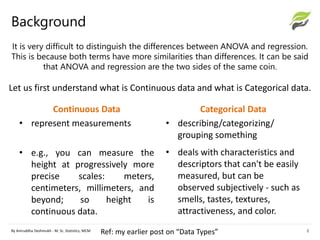
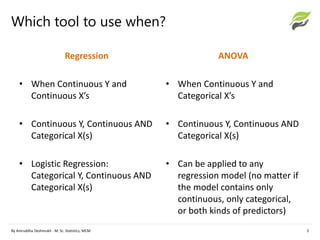
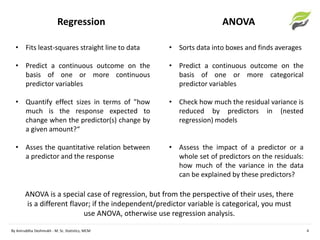
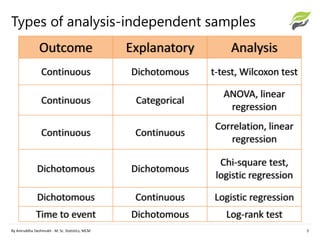
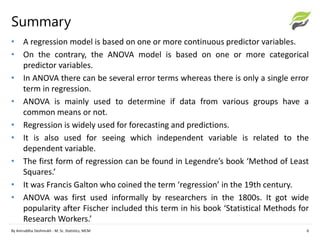
It is very difficult to distinguish the differences between ANOVA and regression. This is because both terms have more similarities than differences. It can be said that ANOVA and regression are the two sides of the same coin.
Factor analysis is a statistical technique used to reduce a large set of variables into a smaller set of underlying factors or dimensions. It examines the interrelationships among variables to define common dimensions called factors that can help explain correlations. Factor analysis is used to identify the underlying structure in a data set and reduce many variables into a smaller number of factors for subsequent analysis like regression or discriminant analysis.
The document discusses parametric and non-parametric tests. It provides examples of commonly used non-parametric tests including the Mann-Whitney U test, Kruskal-Wallis test, and Wilcoxon signed-rank test. For each test, it gives the steps to perform the test and interpret the results. Non-parametric tests make fewer assumptions than parametric tests and can be used when the data is ordinal or does not meet the assumptions of parametric tests. They provide a distribution-free alternative for analyzing data.
This document discusses various types of analysis of variance (ANOVA) statistical tests. It begins with an introduction to one-way ANOVA for comparing the means of three or more independent groups. Requirements for one-way ANOVA include a nominal independent variable with three or more levels and a continuous dependent variable. Assumptions of one-way ANOVA include normality and homogeneity of variances. The document then briefly discusses two-way ANOVA, MANOVA, ANOVA with repeated measures, and related statistical tests. Examples of each type of ANOVA are provided.
The document provides an overview of regression analysis. It defines regression analysis as a technique used to estimate the relationship between a dependent variable and one or more independent variables. The key purposes of regression are to estimate relationships between variables, determine the effect of each independent variable on the dependent variable, and predict the dependent variable given values of the independent variables. The document also outlines the assumptions of the linear regression model, introduces simple and multiple regression, and describes methods for model building including variable selection procedures.
This document provides an overview of non-parametric statistics. It defines non-parametric tests as those that make fewer assumptions than parametric tests, such as not assuming a normal distribution. The document compares and contrasts parametric and non-parametric tests. It then explains several common non-parametric tests - the Mann-Whitney U test, Wilcoxon signed-rank test, sign test, and Kruskal-Wallis test - and provides examples of how to perform and interpret each test.
This document discusses non-parametric tests, which are statistical tests that make fewer assumptions about the population distribution compared to parametric tests. Some key points:
1) Non-parametric tests like the chi-square test, sign test, Wilcoxon signed-rank test, Mann-Whitney U-test, and Kruskal-Wallis test are used when the population is not normally distributed or sample sizes are small.
2) They are applied in situations where data is on an ordinal scale rather than a continuous scale, the population is not well defined, or the distribution is unknown.
3) Advantages are that they are easier to compute and make fewer assumptions than parametric tests,
Parametric vs Nonparametric Tests: When to use whichGönenç Dalgıç
There are several statistical tests which can be categorized as parametric and nonparametric. This presentation will help the readers to identify which type of tests can be appropriate regarding particular data features.
This document provides a basic guide to using the statistical software package SPSS. It introduces SPSS as a program used by researchers to perform statistical analysis of data. The document explains that SPSS can be used to describe data through descriptive statistics, examine relationships between variables, and compare groups. It also provides instructions on how to open and start SPSS.
The Mann-Whitney U Test is used to compare two independent groups on an ordinal scale. It tests the null hypothesis that there is no difference between the groups' rankings. The document provides an example comparing traditional language learning to immersion learning. Students' Spanish test scores were ranked, and the Mann-Whitney U Test found a significant difference, rejecting the null hypothesis. The immersion group had higher rankings than the traditional group, showing greater Spanish proficiency from immersion learning.
This document provides an introduction to R, including what R is, how it compares to other statistical software packages, its advantages and disadvantages, how to install R, and options for R editors and graphical user interfaces (GUIs). It discusses R as a language for statistical computing and graphics, compares it to packages like SAS, Stata, and SPSS in terms of cost, usage mode, and prevalence. It outlines some of R's advantages like being free and open-source software with an active user community contributing packages, and some disadvantages like the learning curve and lack of a standard GUI.
R is a programming language and software environment for statistical analysis and graphics. It is widely used among statisticians and data scientists. R was created by Ross Ihaka and Robert Gentleman in the early 1990s and is currently developed by the R Core Team. Key features of R include its use as a programming language, effective data handling and storage, graphical display capabilities, and large collection of statistical and machine learning packages. R is open source, has a large user community, and is often used for statistical analysis, data mining, and creating statistical graphics.
Data collection and analysis tools refer to methods used to systematically gather and examine information. This includes statistical software packages, specialized computer programs, and online testing systems. Popular tools include SPSS, Stata, and R programming language. Computer-based testing systems allow electronic assessment and tracking of student performance. Electronic gradebooks make it easy for teachers to calculate and track student grades digitally. Student response systems engage students in real-time feedback and assessments through interactive technology. Online testing with feedback immediately informs students of correct answers and provides explanations.
This document provides an overview of analysis of variance (ANOVA). It describes how ANOVA was developed by R.A. Fisher in 1920 to analyze differences between multiple sample means. The document outlines the F-statistic used in ANOVA to compare between-group and within-group variations. It also describes one-way and two-way classifications of ANOVA and provides examples of applications in fields like agriculture, biology, and pharmaceutical research.
Statistical tests can be used to analyze data in two main ways: descriptive statistics provide an overview of data attributes, while inferential statistics assess how well data support hypotheses and generalizability. There are different types of tests for comparing means and distributions between groups, determining if differences or relationships exist in parametric or non-parametric data. The appropriate test depends on the question being asked, number of groups, and properties of the data.
This document provides an example of simple linear regression with one independent variable. It explains that linear regression finds the line of best fit by estimating values for the slope (b1) and y-intercept (b0) that minimize the sum of the squared errors between the observed data points and the regression line. It provides the formulas for calculating the least squares estimates of b1 and b0. The document includes a table of temperature and sales data and a corresponding scatter plot as an example of simple linear regression analysis.
Cluster analysis is a technique used to group objects based on characteristics they possess. It involves measuring the distance or similarity between objects and grouping those that are most similar together. There are two main types: hierarchical cluster analysis, which groups objects sequentially into clusters; and nonhierarchical cluster analysis, which directly assigns objects to pre-specified clusters. The choice of method depends on factors like sample size and research objectives.
This document provides an overview of hypothesis testing in inferential statistics. It defines a hypothesis as a statement or assumption about relationships between variables or tentative explanations for events. There are two main types of hypotheses: the null hypothesis (H0), which is the default position that is tested, and the alternative hypothesis (Ha or H1). Steps in hypothesis testing include establishing the null and alternative hypotheses, selecting a suitable test of significance or test statistic based on sample characteristics, formulating a decision rule to either accept or reject the null hypothesis based on where the test statistic value falls, and understanding the potential for errors. Key criteria for constructing hypotheses and selecting appropriate statistical tests are also outlined.
This document compares parametric and non-parametric statistical analyses. Parametric analyses make assumptions about the population distribution and variance, are applicable to interval/ratio data, and can be affected by outliers. Non-parametric analyses make no assumptions, can be used with ordinal/nominal data, and are not affected by outliers. The document provides examples of common parametric tests (t-tests, ANOVA) and non-parametric alternatives (Mann-Whitney, Kruskal-Wallis), and guidelines for determining whether a parametric or non-parametric approach is more appropriate.
This document provides information about the Kruskal-Wallis H test, a non-parametric method for testing whether samples originate from the same distribution. It describes how the Kruskal-Wallis test is a generalization of the Mann-Whitney U test that allows comparison of more than two independent groups. The test works by ranking all data from lowest to highest and then summing the ranks for each group to calculate the test statistic H, which is compared to a chi-squared distribution to determine whether to reject or fail to reject the null hypothesis that all population medians are equal.
This presentation is about Basic Statistics-related to types of Data-Qualitative and Quantitative, and its Examples in everyday life- By: Dr. Farhana Shaheen
01 parametric and non parametric statisticsVasant Kothari
Definition of Parametric and Non-parametric Statistics
Assumptions of Parametric and Non-parametric Statistics
Assumptions of Parametric Statistics
Assumptions of Non-parametric Statistics
Advantages of Non-parametric Statistics
Disadvantages of Non-parametric Statistical Tests
Parametric Statistical Tests for Different Samples
Parametric Statistical Measures for Calculating the Difference Between Means
Significance of Difference Between the Means of Two Independent Large and
Small Samples
Significance of the Difference Between the Means of Two Dependent Samples
Significance of the Difference Between the Means of Three or More Samples
Parametric Statistics Measures Related to Pearson’s ‘r’
Non-parametric Tests Used for Inference
This document provides an overview of analysis of variance (ANOVA) techniques. It discusses one-way ANOVA, which evaluates differences between three or more population means. Key aspects covered include partitioning total variation into between- and within-group components, assumptions of normality and equal variances, and using the F-test to test for differences. Randomized block ANOVA and two-factor ANOVA are also introduced as extensions to control for additional variables. Post-hoc tests like Tukey and Fisher's LSD are described for determining specific mean differences.
The document provides an introduction to regression analysis and performing regression using SPSS. It discusses key concepts like dependent and independent variables, assumptions of regression like linearity and homoscedasticity. It explains how to calculate regression coefficients using the method of least squares and how to perform regression analysis in SPSS, including selecting variables and interpreting the output.
DIstinguish between Parametric vs nonparametric testsai prakash
This document summarizes parametric and nonparametric tests. Parametric tests make assumptions about the population based on known parameters, while nonparametric tests make no assumptions about the population. Some examples of parametric tests provided are t-test, F-test, z-test, and ANOVA, while examples of nonparametric tests include Mann-Whitney, rank sum test, and Kruskal-Wallis test. The key differences between parametric and nonparametric tests are that parametric tests are based on population parameters and distributions while nonparametric tests are not, and parametric tests can only be applied to variable data while nonparametric tests can be used for variable or attribute data.
This document discusses hypothesis testing, including:
1) The objectives are to formulate statistical hypotheses, discuss types of errors, establish decision rules, and choose appropriate tests.
2) Key symbols and concepts are defined, such as the null and alternative hypotheses, Type I and Type II errors, test statistics like z and t, means, variances, sample sizes, and significance levels.
3) The two types of errors in hypothesis testing are discussed. Hypothesis tests can result in correct decisions or two types of errors when the null hypothesis is true or false.
4) Steps in hypothesis testing are outlined, including formulating hypotheses, specifying a significance level, choosing a test statistic, establishing a
This document discusses inferential statistics and hypothesis testing. It begins by explaining the difference between descriptive and inferential statistics, and how inferential statistics are used to make inferences about populations based on data collected from samples. It then discusses key concepts in hypothesis testing including the null hypothesis, type I and type II errors, significance, confidence intervals, and p-values. Examples are provided to illustrate hypothesis testing and how to determine the appropriate statistical test to use based on the variables. Common parametric and non-parametric tests are also outlined.
This document provides an introduction to two-way analysis of variance (ANOVA). It discusses how a two-way ANOVA examines the interaction effects between two independent variables on a continuous dependent variable. Examples are given of two-way ANOVAs examining factors like gender and ethnicity. The key components of a two-way ANOVA summary table are defined, including degrees of freedom, sum of squares, mean squares, F-ratios, effect sizes, and significance levels for the interaction, main effects A and B, and total effects. Instructions are provided on running a two-way ANOVA in SPSS.
The document discusses the Friedman test, a non-parametric statistical test used to detect differences in treatments across multiple test attempts. It provides information on the history, assumptions, general procedure, applications, advantages and disadvantages of the Friedman test. An example is also included to demonstrate how to perform the Friedman test and analyze the results.
The F-distribution is used to compare the variances of two populations. It is defined as the ratio of two normally distributed populations' variances. The F-distribution depends on the degrees of freedom v1 and v2, which are based on the sample sizes. The null hypothesis is that the two variances are equal. If the calculated F-value exceeds the critical value from tables, the null hypothesis is rejected.
ANOVA analysis was conducted to compare the effectiveness of 4 teaching methods on student grades. The analysis found a significant difference between the methods (F=79.61678, p<0.01), with Method 4 being most effective. A second ANOVA compared acceptability of luncheon meat from 3 sources using 20 panelists, finding significant differences between sources (F=99.59873, p<0.01) and panelists (F=5.605096, p<0.01).
T-test and ANOVA are statistical techniques used to test hypotheses and compare population means. The t-test is used to compare the means of two samples or groups, while ANOVA can compare the means of more than two groups. Specifically, the t-test examines whether two sample means are significantly different and assumes a normal distribution and unknown standard deviation. ANOVA compares three or more population means by assessing variation within and between groups, and assumes samples are from normally distributed populations with equal variances. Researchers should use a t-test when comparing only two means and ANOVA when comparing more than two means to avoid increasing the chances of a Type I error.
This document discusses random effects models and analysis of variance (ANOVA). It introduces one-way and two-way random effects ANOVA models, distinguishing between random and fixed effects. It describes how to perform inference on variance components in random effects models, including using Satterthwaite's procedure to obtain confidence intervals for variances. Mixed effects models are also introduced, where some factors are fixed and others random.
Here are the steps to solve this problem:
1) State the null and alternative hypotheses:
H0: σ1^2 = σ2^2 (the variances are equal)
Ha: σ1^2 ≠ σ2^2 (the variances are unequal)
2) Specify the significance level: α = 0.05
3) Calculate the F-statistic:
F = (0.0428/120) / (0.0395/80) = 1.0833
4) Find the p-value:
This is a left-tailed test since s1 < s2. From the F-distribution table with degrees of freedom v1 = 80-1
ANOVA (analysis of variance) and mean differentiation tests are statistical methods used to compare means or medians of multiple groups. ANOVA compares three or more means to test for statistical significance and is similar to multiple t-tests but with less type I error. It requires continuous dependent variables and categorical independent variables. There are different types of ANOVA including one-way, factorial, repeated measures, and multivariate ANOVA. Key assumptions of ANOVA include normality, homogeneity of variance, and independence of observations. The F-test statistic follows an F-distribution and is used to evaluate the null hypothesis that population means are equal.
The document discusses a one-way ANOVA test, which compares the means of two or more independent groups on a continuous dependent variable. It outlines the assumptions of the test, how to set it up in SPSS, and how to interpret the output. Key outputs include an ANOVA table showing if group means are statistically significantly different, and a post-hoc test for determining the nature of differences between specific groups.
The document provides an overview of different statistical analysis methods including independent ANOVA, repeated measures ANOVA, and MANOVA. It discusses key aspects of each method such as their appropriate uses, assumptions, and how to conduct the analyses and interpret results in SPSS. For ANOVA, it covers topics like F-ratio, significance levels, post-hoc tests, effect sizes, and examples. For MANOVA, it compares it to ANOVA and explains how MANOVA can assess differences across groups on multiple dependent variables simultaneously.
This document discusses non-parametric statistical tests, which make few assumptions about the distribution of the underlying population. It provides examples of non-parametric tests like the sign test, Wilcoxon rank sum test, and Kruskal-Wallis test. These tests involve ranking all observations from different groups together and applying statistical tests to the ranks rather than the original values. Non-parametric tests are useful when assumptions of parametric tests may not hold but lack power with small samples.
The document discusses four nonparametric statistical tests:
1. The Wilcoxon Rank Sum Test (also called the Mann-Whitney U Test) compares the medians of two independent samples and is an alternative to the independent t-test.
2. The Wilcoxon Signed Rank Test compares the medians of two dependent/paired samples and is an alternative to the paired t-test. It calculates the differences between pairs, ranks their absolute values, and sums the ranks of positive differences.
3. The Kruskal-Wallis Test compares more than two independent samples.
4. The Runs Test examines the randomness of a single sample by counting runs, or streaks, of
This document provides an overview of nonparametric tests. It defines nonparametric tests as techniques that do not rely on assumptions about the underlying data distribution. Some key points made in the document include:
- Nonparametric tests are used when the sample distribution is unknown or when there are too many variables to assume a normal distribution.
- Common nonparametric tests include the chi-square test, Kruskal-Wallis test, Wilcoxon signed-rank test, median test, and sign test.
- The main difference between parametric and nonparametric tests is that parametric tests make assumptions about the population distribution, while nonparametric tests do not require these assumptions and are distribution-
- Discriminant analysis is a statistical technique used to discriminate between two or more groups based on multiple predictor variables.
- A study analyzed data on effective and ineffective extension agents to identify variables that best discriminate between the two groups. Variables like years of experience, communication skills, and positive attitude to work significantly differed between the groups.
- Discriminant analysis generated a function to maximize differences between the groups based on predictor variables. The function was statistically significant based on a small Wilks' lambda value, indicating most variability was explained.
Assumptions of parametric and non-parametric tests
Testing the assumption of normality
Commonly used non-parametric tests
Applying tests in SPSS
Advantages of non-parametric tests
Limitations
Research 101: Inferential Quantitative AnalysisHarold Gamero
This document provides an overview of quantitative inferential analysis techniques, including:
- Inferential statistics are used to test hypotheses and draw conclusions about populations based on sample data, using specialized software.
- Basic concepts include null and alternative hypotheses, significance levels, p-values, and that statistical inferences are probabilistic rather than deterministic.
- Common analysis techniques described are the general linear model, structural equation modeling, ANOVA for comparing groups, factorial designs, and other techniques like factor analysis, discriminant analysis, logistic regression, and path analysis.
This document provides an overview of parametric and nonparametric statistical methods. It defines key concepts like standard error, degrees of freedom, critical values, and one-tailed versus two-tailed hypotheses. Common parametric tests discussed include t-tests, ANOVA, ANCOVA, and MANOVA. Nonparametric tests covered are chi-square, Mann-Whitney U, Kruskal-Wallis, and Friedman. The document explains when to use parametric versus nonparametric methods and how measures like effect size can quantify the strength of relationships found.
Discriminant analysis is a technique that is used by the researcher to analyze the research data when the criterion or the dependent variable is categorical and the predictor or the independent variable is the interval in nature. The term categorical variable means that the predictor variable is divided into a number of categories.
DA is typically used when the groups are already defined prior to the study.
The end result of DA is a model that can be used for the prediction of group memberships. This model allows us to understand the relationship between the set of selected variables and the observations. Furthermore, this model will enable one to assess the contributions of different variables.
Mba2216 week 11 data analysis part 03 appendixStephen Ong
Multivariate analysis involves simultaneously analyzing multiple variables to understand relationships. This document discusses key concepts in multivariate analysis including:
1. Defining multivariate analysis and when it is appropriate to use.
2. Describing specific techniques like multiple regression, discriminant analysis, logistic regression, MANOVA, canonical correlation analysis, conjoint analysis, factor analysis, cluster analysis, multidimensional scaling, and correspondence analysis.
3. Providing guidelines for selecting the appropriate technique based on the measurement scales and relationship between variables.
It also covers important considerations like measurement error, statistical power, and a structured approach to multivariate model building.
Chapter 13 Data Analysis Inferential Methods and Analysis of Time SeriesInternational advisers
This document discusses inferential statistics and time series analysis. It defines inferential statistics as ways to generalize statistics from a sample to a larger population. Common inferential methods include correlation, linear regression, ANOVA, and time series analysis. Correlation measures relationships between variables while regression predicts outcomes. ANOVA compares group means. Time series analysis models trends, seasonality, and irregular patterns over time.
CHAPTER 2 - NORM, CORRELATION AND REGRESSION.pptkriti137049
Norms are the accepted standards on particular test.
Norms consist of data that make it possible to determine the relative standing of an individual who has taken a test.
Multivariate analysis techniques allow researchers to analyze multiple variables simultaneously. Some key techniques include multiple regression, discriminant analysis, multivariate analysis of variance, factor analysis, cluster analysis, multidimensional scaling, and latent structure analysis. These techniques help reduce complex data into simpler representations and support various types of decision making.
This document discusses factors that influence the selection of data analysis strategies and provides a classification of statistical techniques. It notes that the previous research steps, known data characteristics, statistical technique properties, and researcher background all impact strategy selection. Statistical techniques can be univariate, analyzing single variables, or multivariate, analyzing relationships between multiple variables simultaneously. Multivariate techniques are further classified as dependence techniques, with identifiable dependent and independent variables, or interdependence techniques examining whole variable sets. The document provides examples of common univariate and multivariate techniques.
April Heyward Research Methods Class Session - 8-5-2021April Heyward
This document provides an overview of key concepts in research methods for public administration, including:
1. Levels of measurement for variables, including nominal, ordinal, interval, and ratio levels. Examples are provided for each level.
2. Common research designs such as experimental, quasi-experimental, cross-sectional, and longitudinal designs.
3. Quantitative data analysis techniques including descriptive statistics, inferential statistics like ANOVA and regression, and correlation analysis. Frequency distributions, measures of central tendency and variability are covered.
4. Confidence intervals and how they are used to estimate population parameters more accurately than point estimates, by providing a probability assessment through setting a confidence level. Common confidence levels like 90%, 95%,
classification of various Multivariate techniquesssuser900e74
This document provides an overview of multivariate analysis techniques. It defines multivariate analysis as techniques that allow for the analysis of more than two variables at once. The document then classifies multivariate techniques into two categories: interdependence techniques, which analyze how variables influence each other; and dependence techniques, which analyze the relationship between independent and dependent variables. Several specific multivariate techniques are defined, including principal component analysis, multiple regression analysis, discriminant analysis, logistic regression, canonical correlation analysis, MANOVA, conjoint analysis, and cluster analysis. Real-world examples are provided to illustrate how and when researchers might apply certain multivariate techniques.
The document discusses various methods for analyzing data, including descriptive, statistical, and multivariate analyses. Statistical analysis makes raw data meaningful by testing hypotheses, obtaining significant results, and drawing inferences. The appropriate analysis depends on the type of measurement, number of variables, and type of statistical inference required. Correlation analysis studies relationships between variables while causal analysis examines how independent variables affect dependents. Multivariate techniques include multiple regression, discriminant analysis, ANOVA, and canonical analysis.
- Data analysis and interpretation examines data using statistical techniques to answer research questions. It involves examining variables in terms of quantity, quality, attributes, patterns, and relationships.
- There are different types of statistical tests for examining single variables, relationships between two variables, and relationships between multiple independent and dependent variables.
- Analysis of variance (ANOVA) tests for differences across multiple dependent variables based on an independent nominal variable. It uses sums of squares and cross-product matrices.
This document provides an overview of one-way ANOVA, including its assumptions, steps, and an example. One-way ANOVA tests whether the means of three or more independent groups are significantly different. It compares the variance between sample means to the variance within samples using an F-statistic. If the F-statistic exceeds a critical value, then at least one group mean is significantly different from the others. Post-hoc tests may then be used to determine specifically which group means differ. The example calculates statistics to compare the analgesic effects of three drugs and finds no significant difference between the group means.
The document discusses various statistical tools used in research including measures of central tendency (mean, median, mode), measures of dispersion (standard deviation, interquartile range, coefficient of variation), t-tests, ANOVA, regression, correlation and more. It provides examples of when each tool would be used, such as using regression to model relationships between variables or ANOVA to test for differences between group means. The document aims to increase awareness of these common statistical tools for analyzing data in research studies across various fields.
ANOVA STATISTICAL ANALYSIS USING SPSS AND ITS IMPACT IN SOCIETYsaran2011
This document discusses various statistical analysis techniques used in SPSS, including ANOVA, MANOVA, and ANCOVA. It defines one-way and two-way ANOVA as comparing mean differences between three or more groups with a single continuous dependent variable. One-way ANOVA compares a single factor while two-way compares two factors. MANOVA extends ANOVA to assess the effect of one or more independent variables on two or more dependent variables. ANCOVA is similar to ANOVA but includes a continuous covariate. The document provides examples and outlines of how to apply these techniques.
This document discusses different types of statistical analysis techniques. It begins by defining descriptive analysis as studying distributions of one variable and bivariate/multivariate analysis as studying relationships between two or more variables. It then discusses various types of statistical analyses including correlation analysis, causal analysis, multiple regression analysis, multiple discriminant analysis, multivariate ANOVA, and canonical analysis. It also covers inferential analysis, characteristics and importance of statistical methods, assumptions of parametric tests, examples of parametric and non-parametric tests, and provides details on the chi-square test.
This document provides an overview of statistical tests that can be used based on the number and type of variables in a study. It outlines both parametric and non-parametric tests for different situations including comparing 1 or multiple groups, measuring relationships between 2 variables, and assessing within-subject effects. The appropriate statistical techniques depend on whether the data is nominal, ordinal, interval or ratio-level and whether the study has independent or related samples.
This document discusses parametric and nonparametric statistical tests. Parametric tests like the t-test and ANOVA assume a normal distribution of data and compare population means. Nonparametric tests do not assume a normal distribution and can be used when sample sizes are small or distributions are unknown. Specific parametric tests covered include the t-test for comparing two groups, one-way ANOVA for comparing three or more groups on one factor, and two-way ANOVA for examining two factors. Examples of how and when to use these various tests are provided.
This presentation by OECD, OECD Secretariat, was made during the discussion “Competition and Regulation in Professions and Occupations” held at the 77th meeting of the OECD Working Party No. 2 on Competition and Regulation on 10 June 2024. More papers and presentations on the topic can be found at oe.cd/crps.
This presentation was uploaded with the author’s consent.
XP 2024 presentation: A New Look to Leadershipsamililja
Presentation slides from XP2024 conference, Bolzano IT. The slides describe a new view to leadership and combines it with anthro-complexity (aka cynefin).
This presentation by Professor Alex Robson, Deputy Chair of Australia’s Productivity Commission, was made during the discussion “Competition and Regulation in Professions and Occupations” held at the 77th meeting of the OECD Working Party No. 2 on Competition and Regulation on 10 June 2024. More papers and presentations on the topic can be found at oe.cd/crps.
This presentation was uploaded with the author’s consent.
This presentation, created by Syed Faiz ul Hassan, explores the profound influence of media on public perception and behavior. It delves into the evolution of media from oral traditions to modern digital and social media platforms. Key topics include the role of media in information propagation, socialization, crisis awareness, globalization, and education. The presentation also examines media influence through agenda setting, propaganda, and manipulative techniques used by advertisers and marketers. Furthermore, it highlights the impact of surveillance enabled by media technologies on personal behavior and preferences. Through this comprehensive overview, the presentation aims to shed light on how media shapes collective consciousness and public opinion.
Collapsing Narratives: Exploring Non-Linearity • a micro report by Rosie WellsRosie Wells
Insight: In a landscape where traditional narrative structures are giving way to fragmented and non-linear forms of storytelling, there lies immense potential for creativity and exploration.
'Collapsing Narratives: Exploring Non-Linearity' is a micro report from Rosie Wells.
Rosie Wells is an Arts & Cultural Strategist uniquely positioned at the intersection of grassroots and mainstream storytelling.
Their work is focused on developing meaningful and lasting connections that can drive social change.
Please download this presentation to enjoy the hyperlinks!
Carrer goals.pptx and their importance in real lifeartemacademy2
Career goals serve as a roadmap for individuals, guiding them toward achieving long-term professional aspirations and personal fulfillment. Establishing clear career goals enables professionals to focus their efforts on developing specific skills, gaining relevant experience, and making strategic decisions that align with their desired career trajectory. By setting both short-term and long-term objectives, individuals can systematically track their progress, make necessary adjustments, and stay motivated. Short-term goals often include acquiring new qualifications, mastering particular competencies, or securing a specific role, while long-term goals might encompass reaching executive positions, becoming industry experts, or launching entrepreneurial ventures.
Moreover, having well-defined career goals fosters a sense of purpose and direction, enhancing job satisfaction and overall productivity. It encourages continuous learning and adaptation, as professionals remain attuned to industry trends and evolving job market demands. Career goals also facilitate better time management and resource allocation, as individuals prioritize tasks and opportunities that advance their professional growth. In addition, articulating career goals can aid in networking and mentorship, as it allows individuals to communicate their aspirations clearly to potential mentors, colleagues, and employers, thereby opening doors to valuable guidance and support. Ultimately, career goals are integral to personal and professional development, driving individuals toward sustained success and fulfillment in their chosen fields.
Suzanne Lagerweij - Influence Without Power - Why Empathy is Your Best Friend...Suzanne Lagerweij
This is a workshop about communication and collaboration. We will experience how we can analyze the reasons for resistance to change (exercise 1) and practice how to improve our conversation style and be more in control and effective in the way we communicate (exercise 2).
This session will use Dave Gray’s Empathy Mapping, Argyris’ Ladder of Inference and The Four Rs from Agile Conversations (Squirrel and Fredrick).
Abstract:
Let’s talk about powerful conversations! We all know how to lead a constructive conversation, right? Then why is it so difficult to have those conversations with people at work, especially those in powerful positions that show resistance to change?
Learning to control and direct conversations takes understanding and practice.
We can combine our innate empathy with our analytical skills to gain a deeper understanding of complex situations at work. Join this session to learn how to prepare for difficult conversations and how to improve our agile conversations in order to be more influential without power. We will use Dave Gray’s Empathy Mapping, Argyris’ Ladder of Inference and The Four Rs from Agile Conversations (Squirrel and Fredrick).
In the session you will experience how preparing and reflecting on your conversation can help you be more influential at work. You will learn how to communicate more effectively with the people needed to achieve positive change. You will leave with a self-revised version of a difficult conversation and a practical model to use when you get back to work.
Come learn more on how to become a real influencer!
Mastering the Concepts Tested in the Databricks Certified Data Engineer Assoc...SkillCertProExams
• For a full set of 760+ questions. Go to
https://skillcertpro.com/product/databricks-certified-data-engineer-associate-exam-questions/
• SkillCertPro offers detailed explanations to each question which helps to understand the concepts better.
• It is recommended to score above 85% in SkillCertPro exams before attempting a real exam.
• SkillCertPro updates exam questions every 2 weeks.
• You will get life time access and life time free updates
• SkillCertPro assures 100% pass guarantee in first attempt.
2. Background
By Aniruddha Deshmukh - M. Sc. Statistics, MCM 2
It is very difficult to distinguish the differences between ANOVA and regression.
This is because both terms have more similarities than differences. It can be said
that ANOVA and regression are the two sides of the same coin.
Ref: my earlier post on “Data Types”
Continuous Data
• represent measurements
• e.g., you can measure the
height at progressively more
precise scales: meters,
centimeters, millimeters, and
beyond; so height is
continuous data.
Categorical Data
• describing/categorizing/
grouping something
• deals with characteristics and
descriptors that can't be easily
measured, but can be
observed subjectively - such as
smells, tastes, textures,
attractiveness, and color.
Let us first understand what is Continuous data and what is Categorical data.
3. Which tool to use when?
By Aniruddha Deshmukh - M. Sc. Statistics, MCM 3
Regression
• When Continuous Y and
Continuous X’s
• Continuous Y, Continuous AND
Categorical X(s)
• Logistic Regression:
Categorical Y, Continuous AND
Categorical X(s)
ANOVA
• When Continuous Y and
Categorical X’s
• Continuous Y, Continuous AND
Categorical X(s)
• Can be applied to any
regression model (no matter if
the model contains only
continuous, only categorical,
or both kinds of predictors)
4. Regression ANOVA
By Aniruddha Deshmukh - M. Sc. Statistics, MCM 4
• Fits least-squares straight line to data
• Predict a continuous outcome on the
basis of one or more continuous
predictor variables
• Quantify effect sizes in terms of "how
much is the response expected to
change when the predictor(s) change by
a given amount?“
• Asses the quantitative relation between
a predictor and the response
• Sorts data into boxes and finds averages
• Predict a continuous outcome on the
basis of one or more categorical
predictor variables
• Check how much the residual variance is
reduced by predictors in (nested
regression) models
• Assess the impact of a predictor or a
whole set of predictors on the residuals:
how much of the variance in the data
can be explained by these predictors?
ANOVA is a special case of regression, but from the perspective of their uses, there
is a different flavor; if the independent/predictor variable is categorical, you must
use ANOVA, otherwise use regression analysis.
5. Types of analysis-independent samples
By Aniruddha Deshmukh - M. Sc. Statistics, MCM 5
Outcome Explanatory Analysis
Continuous Dichotomous t-test, Wilcoxon test
Continuous Categorical
ANOVA, linear
regression
Continuous Continuous
Correlation, linear
regression
Dichotomous Dichotomous
Chi-square test,
logistic regression
Dichotomous Continuous Logistic regression
Time to event Dichotomous Log-rank test
6. Summary
• A regression model is based on one or more continuous predictor variables.
• On the contrary, the ANOVA model is based on one or more categorical
predictor variables.
• In ANOVA there can be several error terms whereas there is only a single error
term in regression.
• ANOVA is mainly used to determine if data from various groups have a
common means or not.
• Regression is widely used for forecasting and predictions.
• It is also used for seeing which independent variable is related to the
dependent variable.
• The first form of regression can be found in Legendre’s book ‘Method of Least
Squares.’
• It was Francis Galton who coined the term ‘regression’ in the 19th century.
• ANOVA was first used informally by researchers in the 1800s. It got wide
popularity after Fischer included this term in his book ‘Statistical Methods for
Research Workers.’
By Aniruddha Deshmukh - M. Sc. Statistics, MCM 6
7. Aniruddha Deshmukh – M. Sc. Statistics, MCM
email: annied23@gmail.com
For more information please contact: