Downloaded 290 times
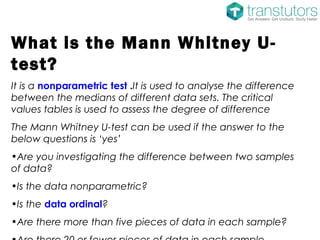
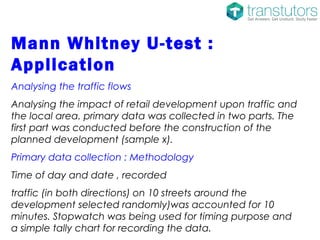

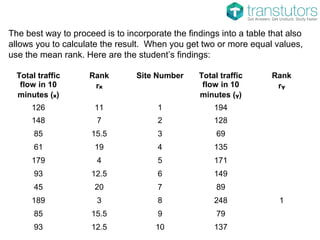


The Mann Whitney U-test is a nonparametric statistical test used to analyze differences between the medians of two data sets, applicable under specific conditions. The document outlines a case study analyzing traffic flows before and after a retail development, detailing the methodology for data collection and the application of the test. The findings are calculated using a specified formula, and additional resources for further information are provided.


