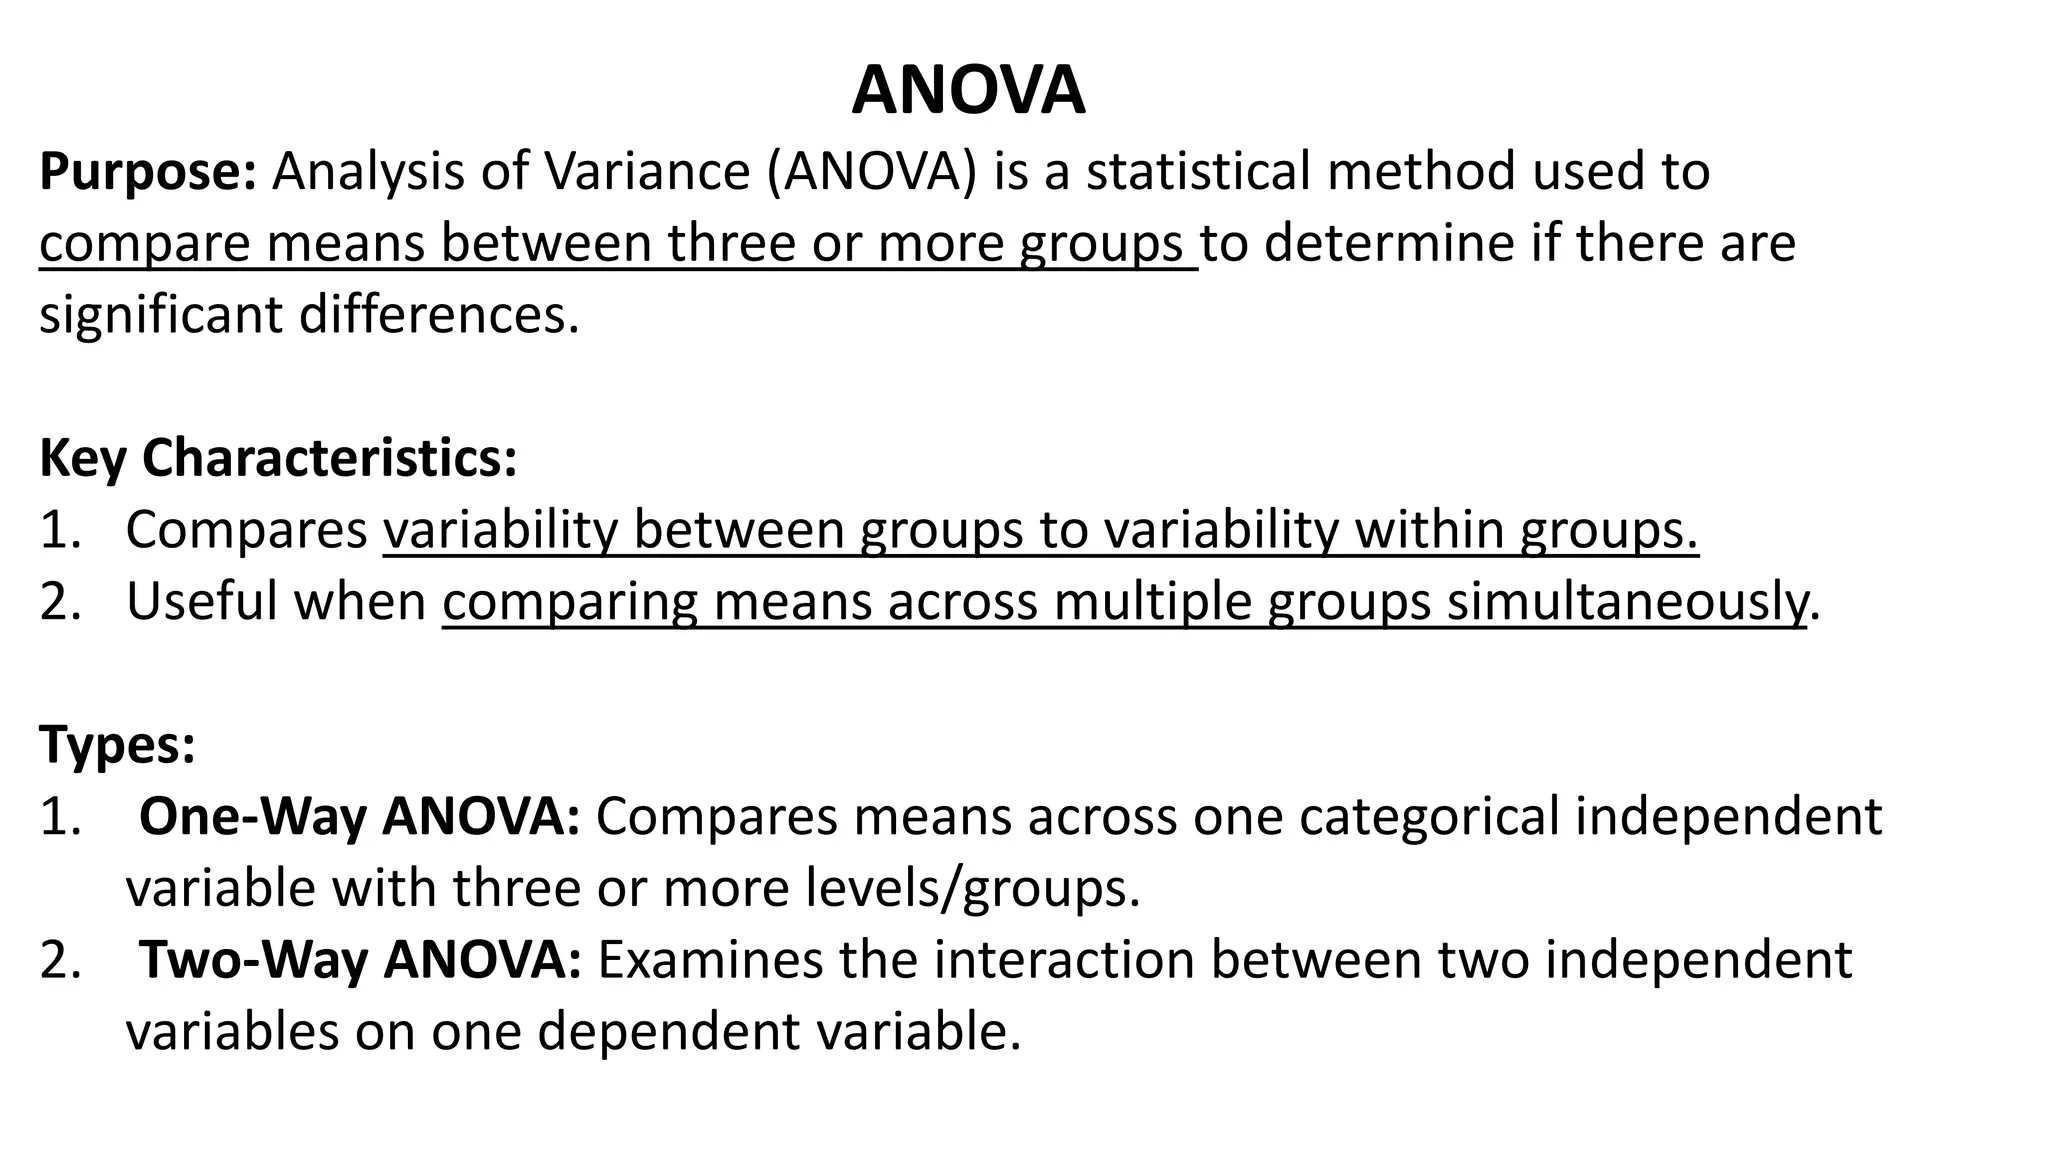
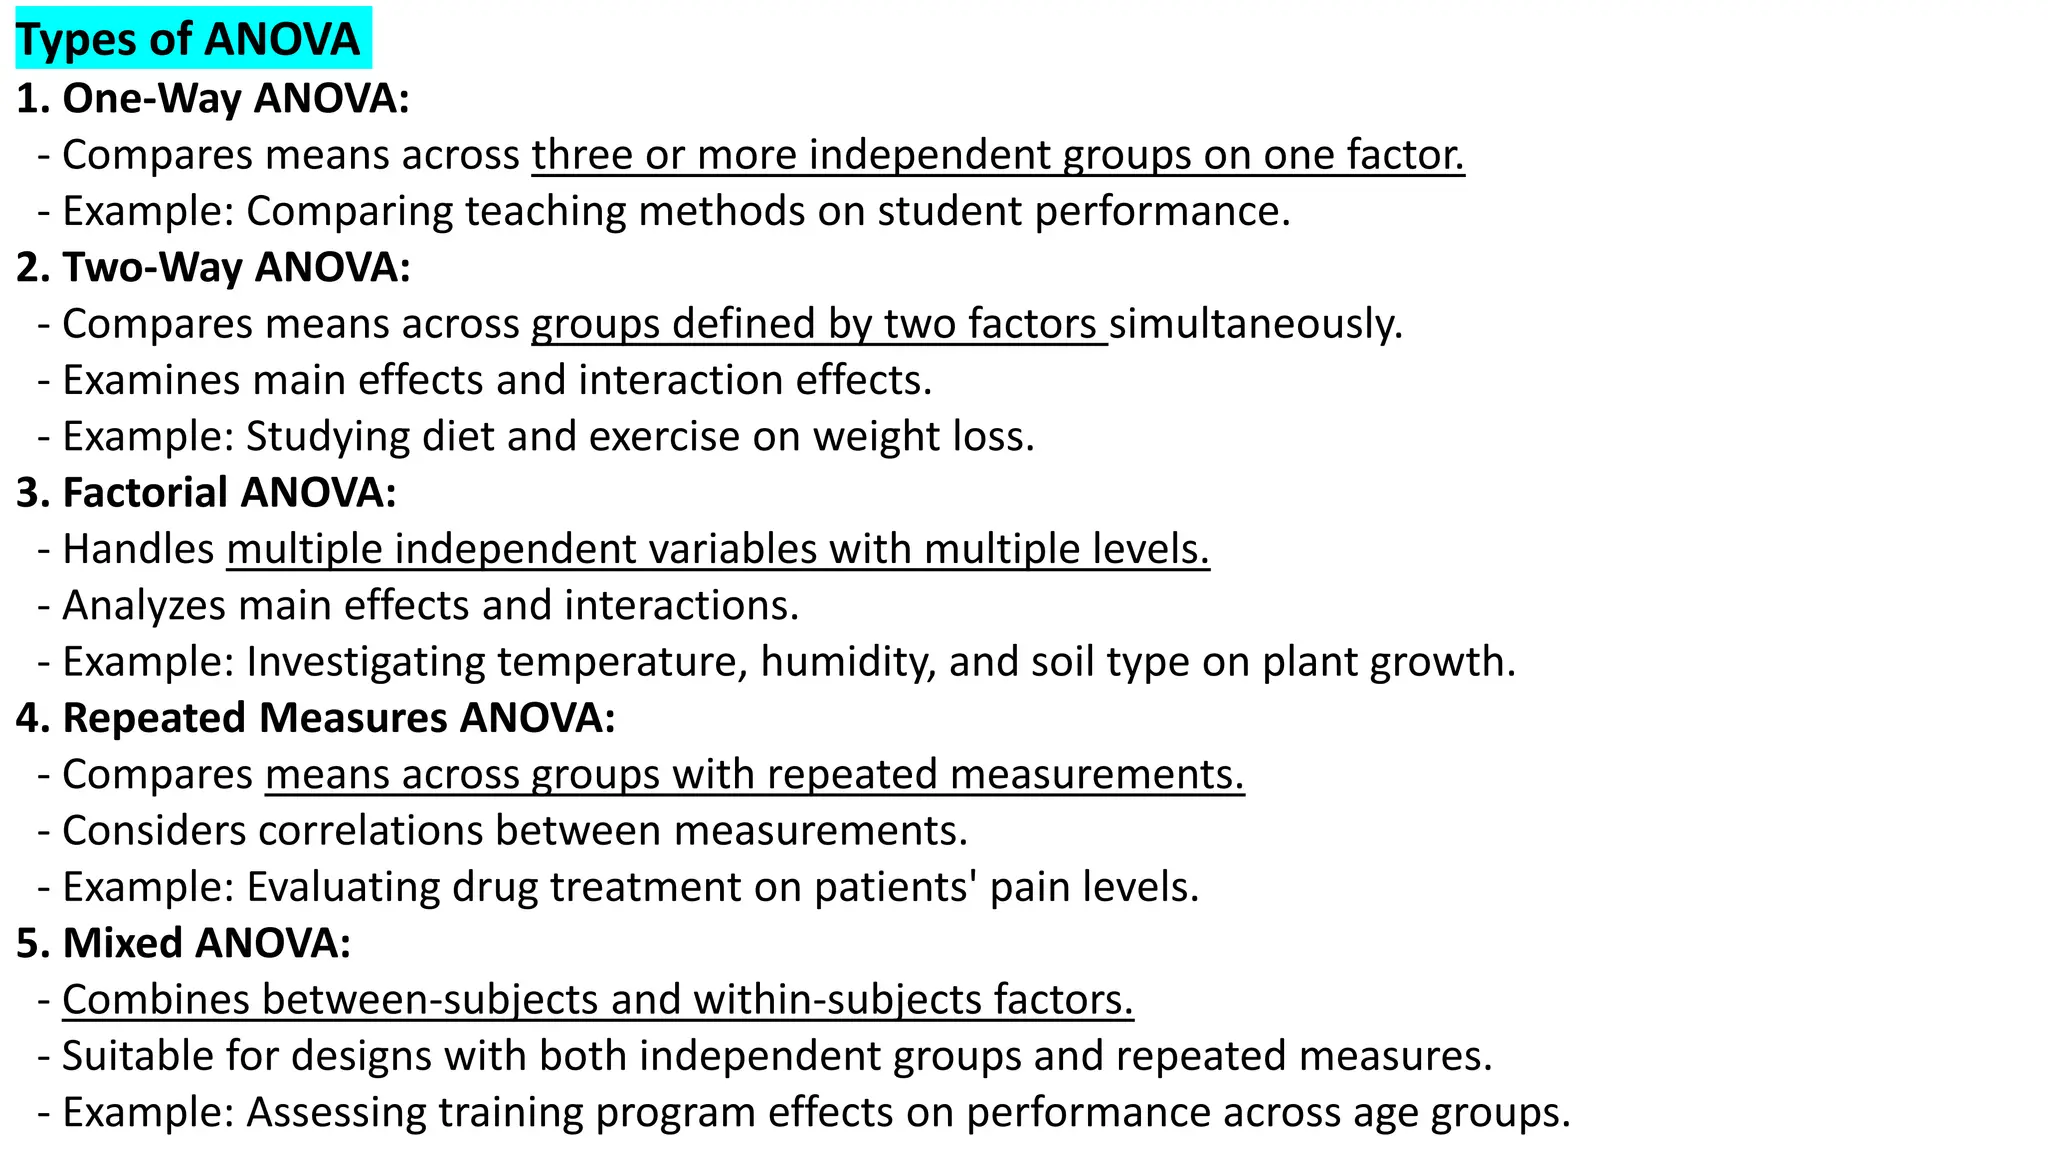
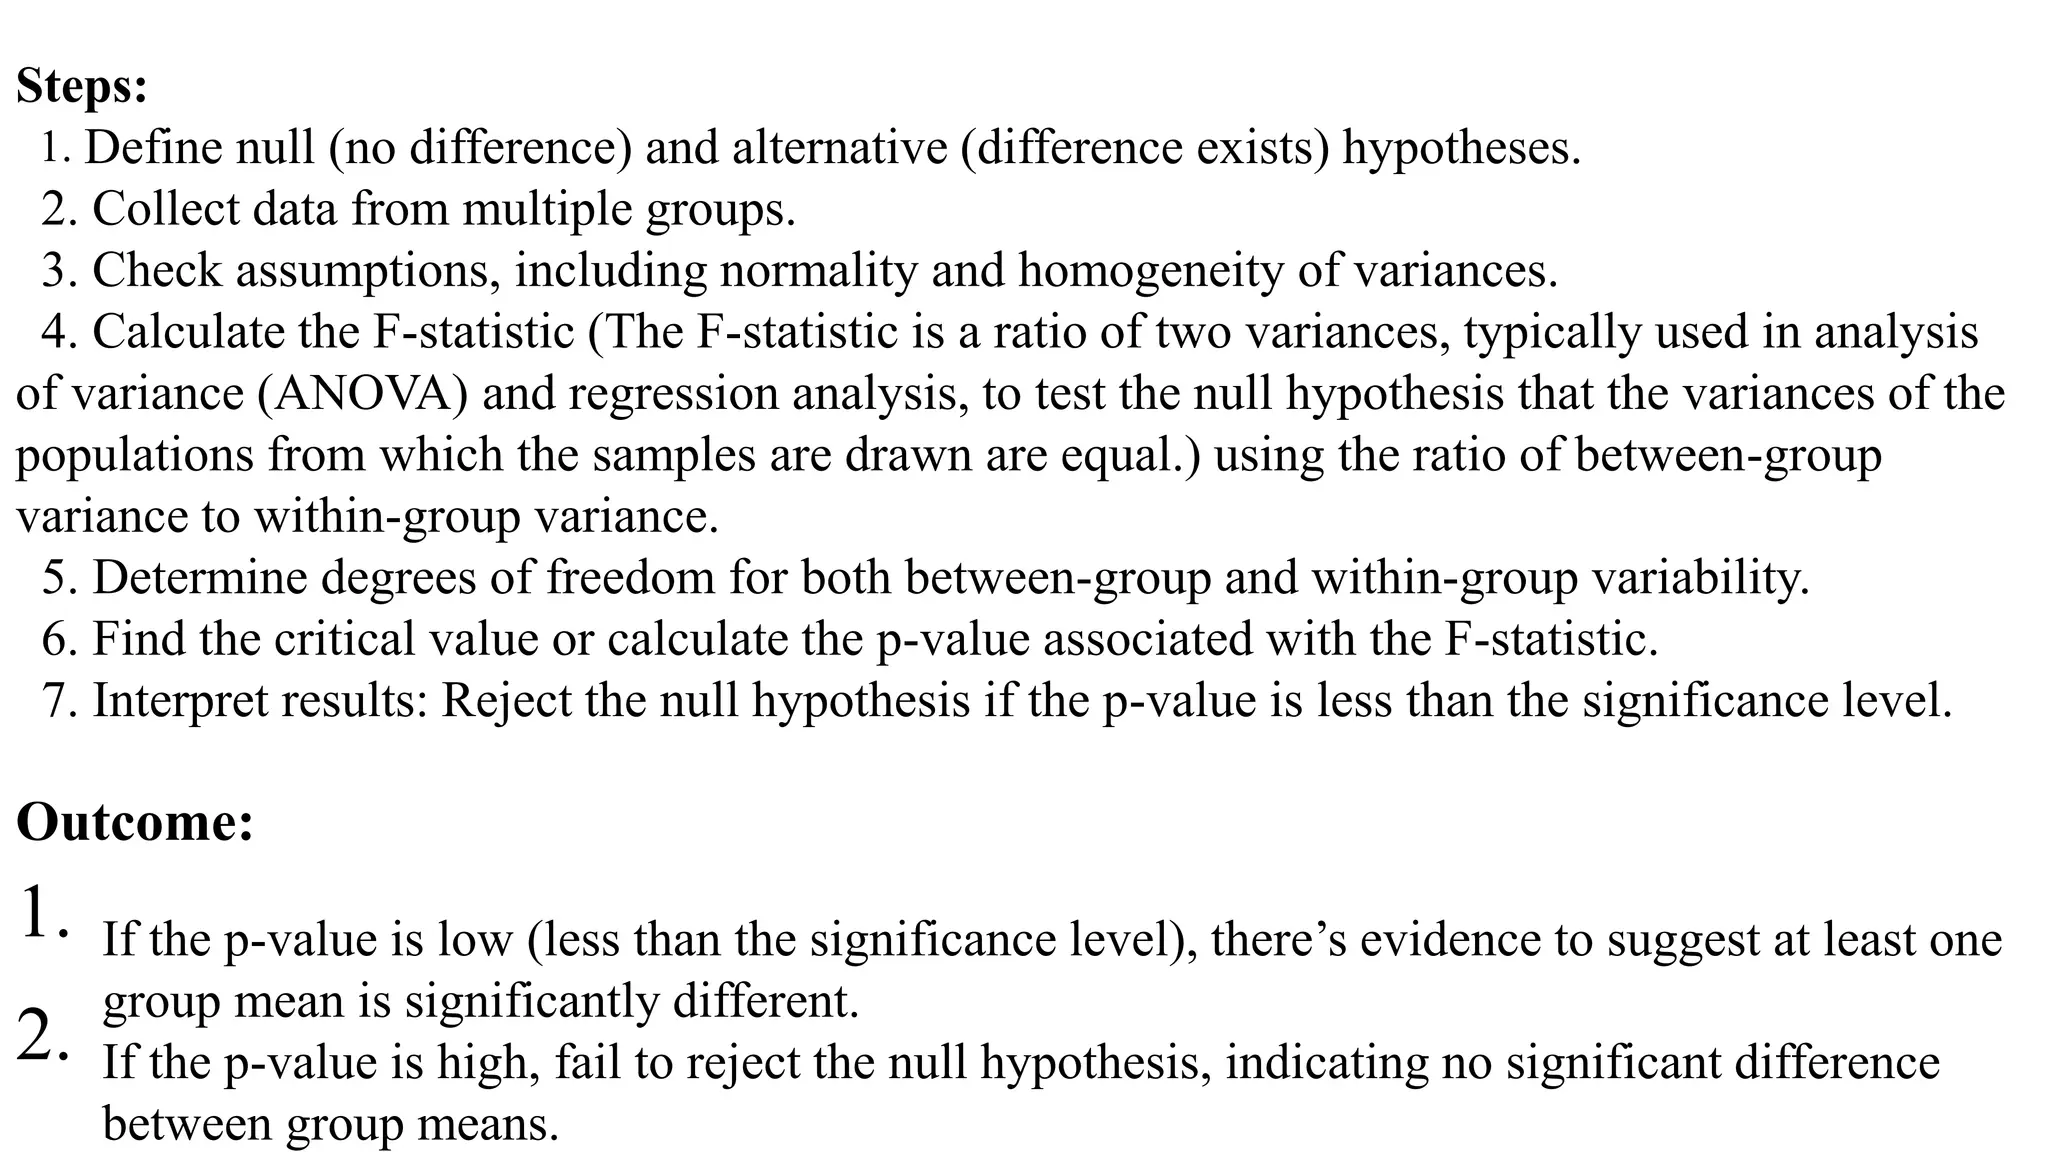
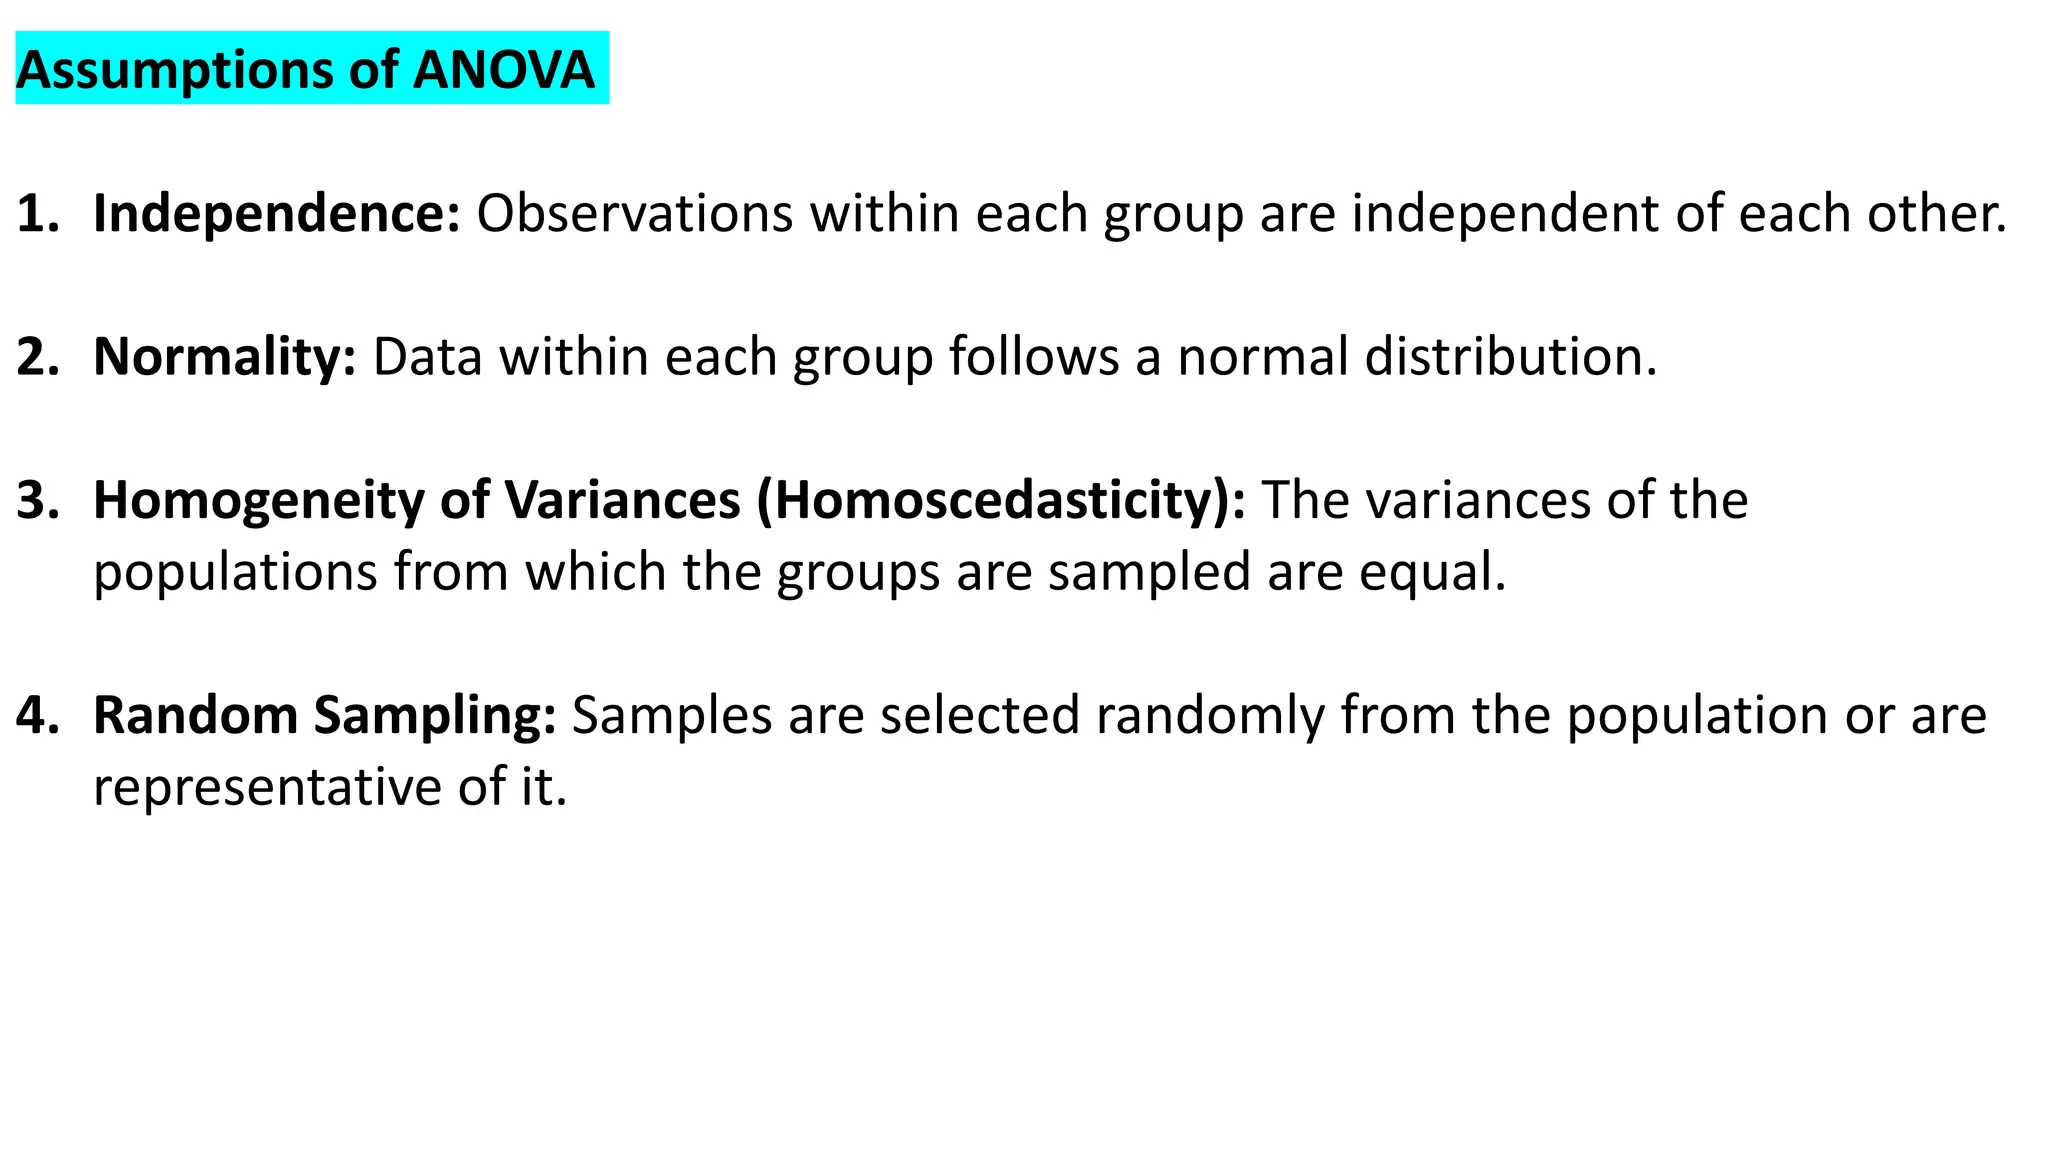
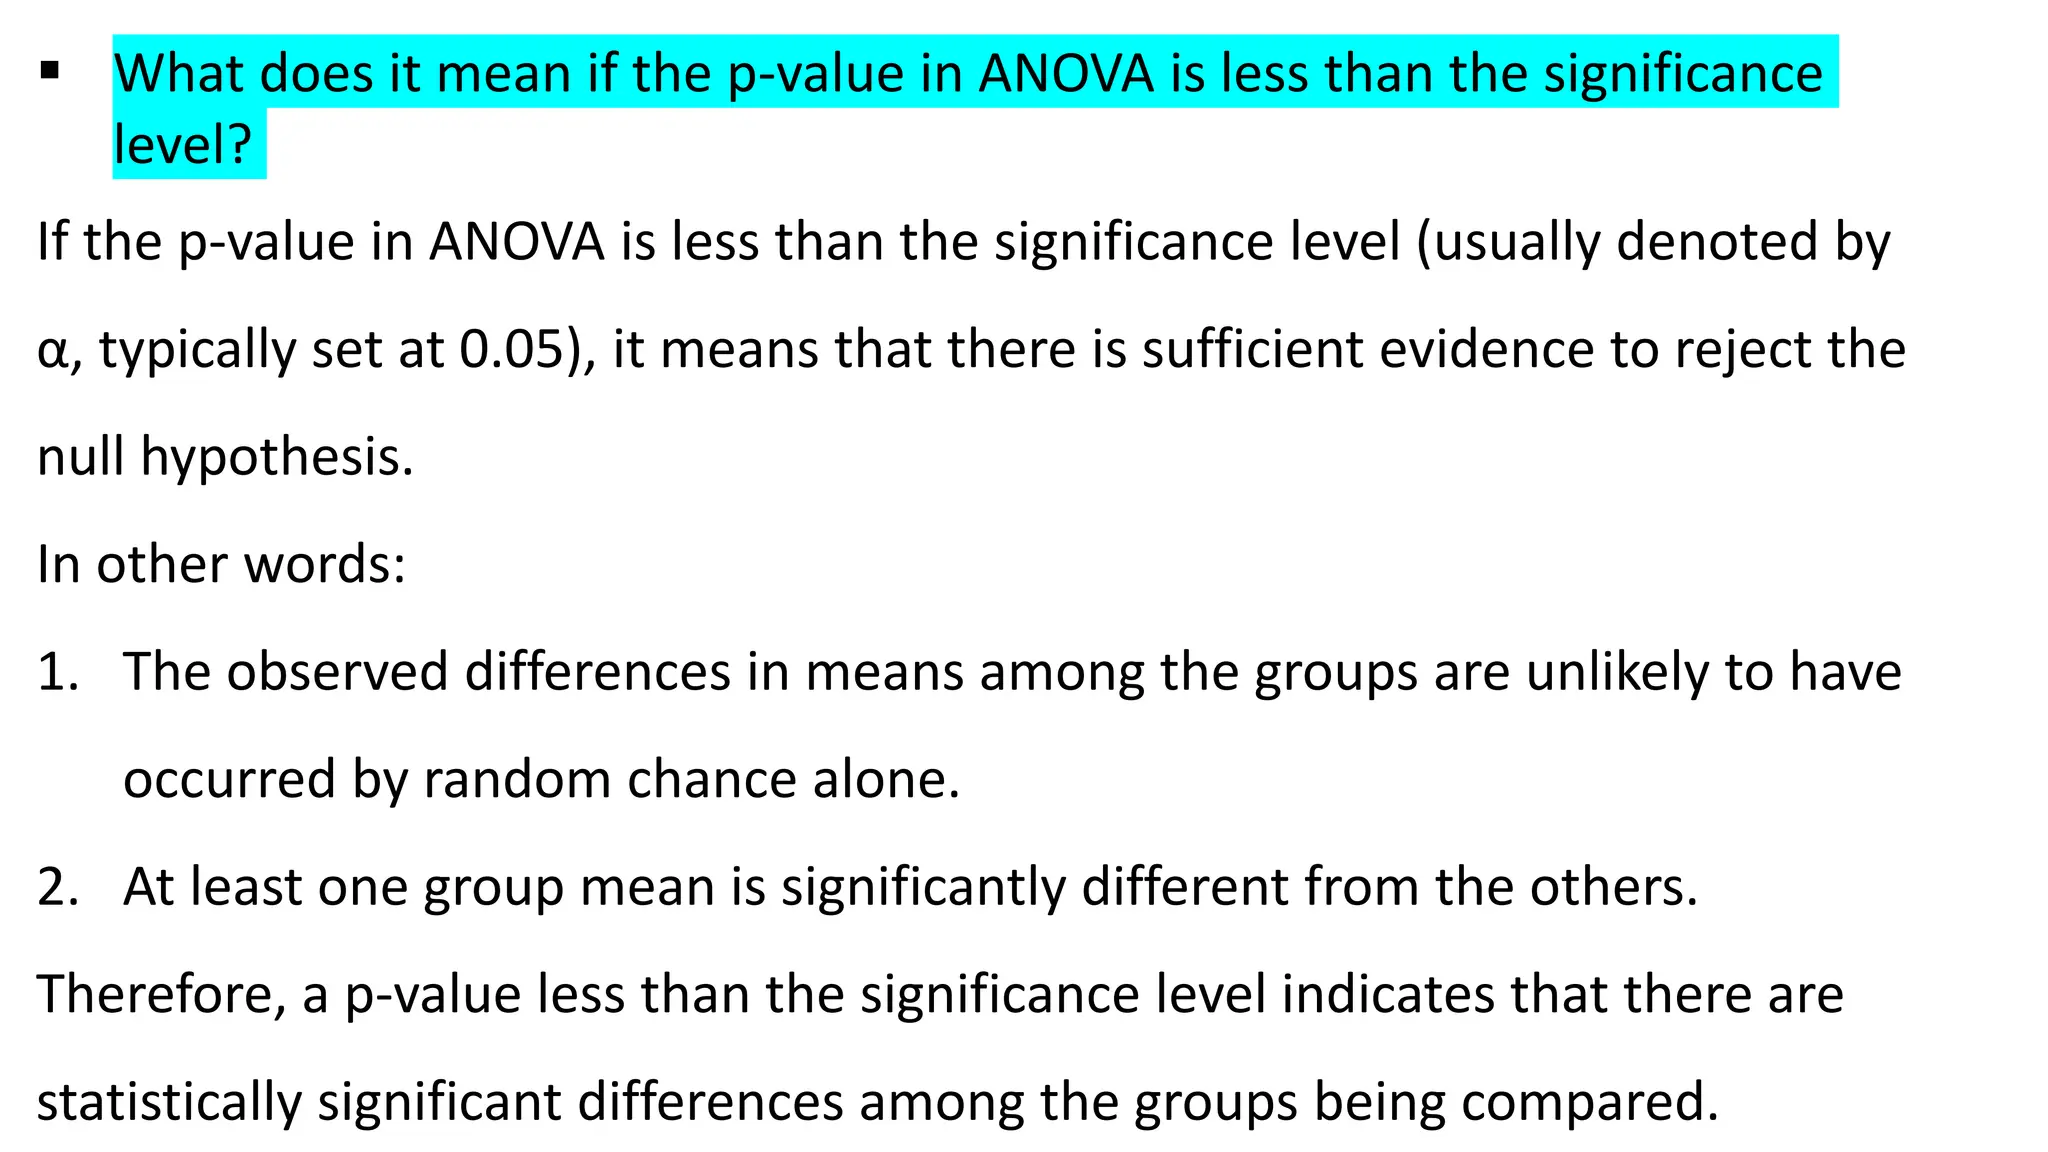
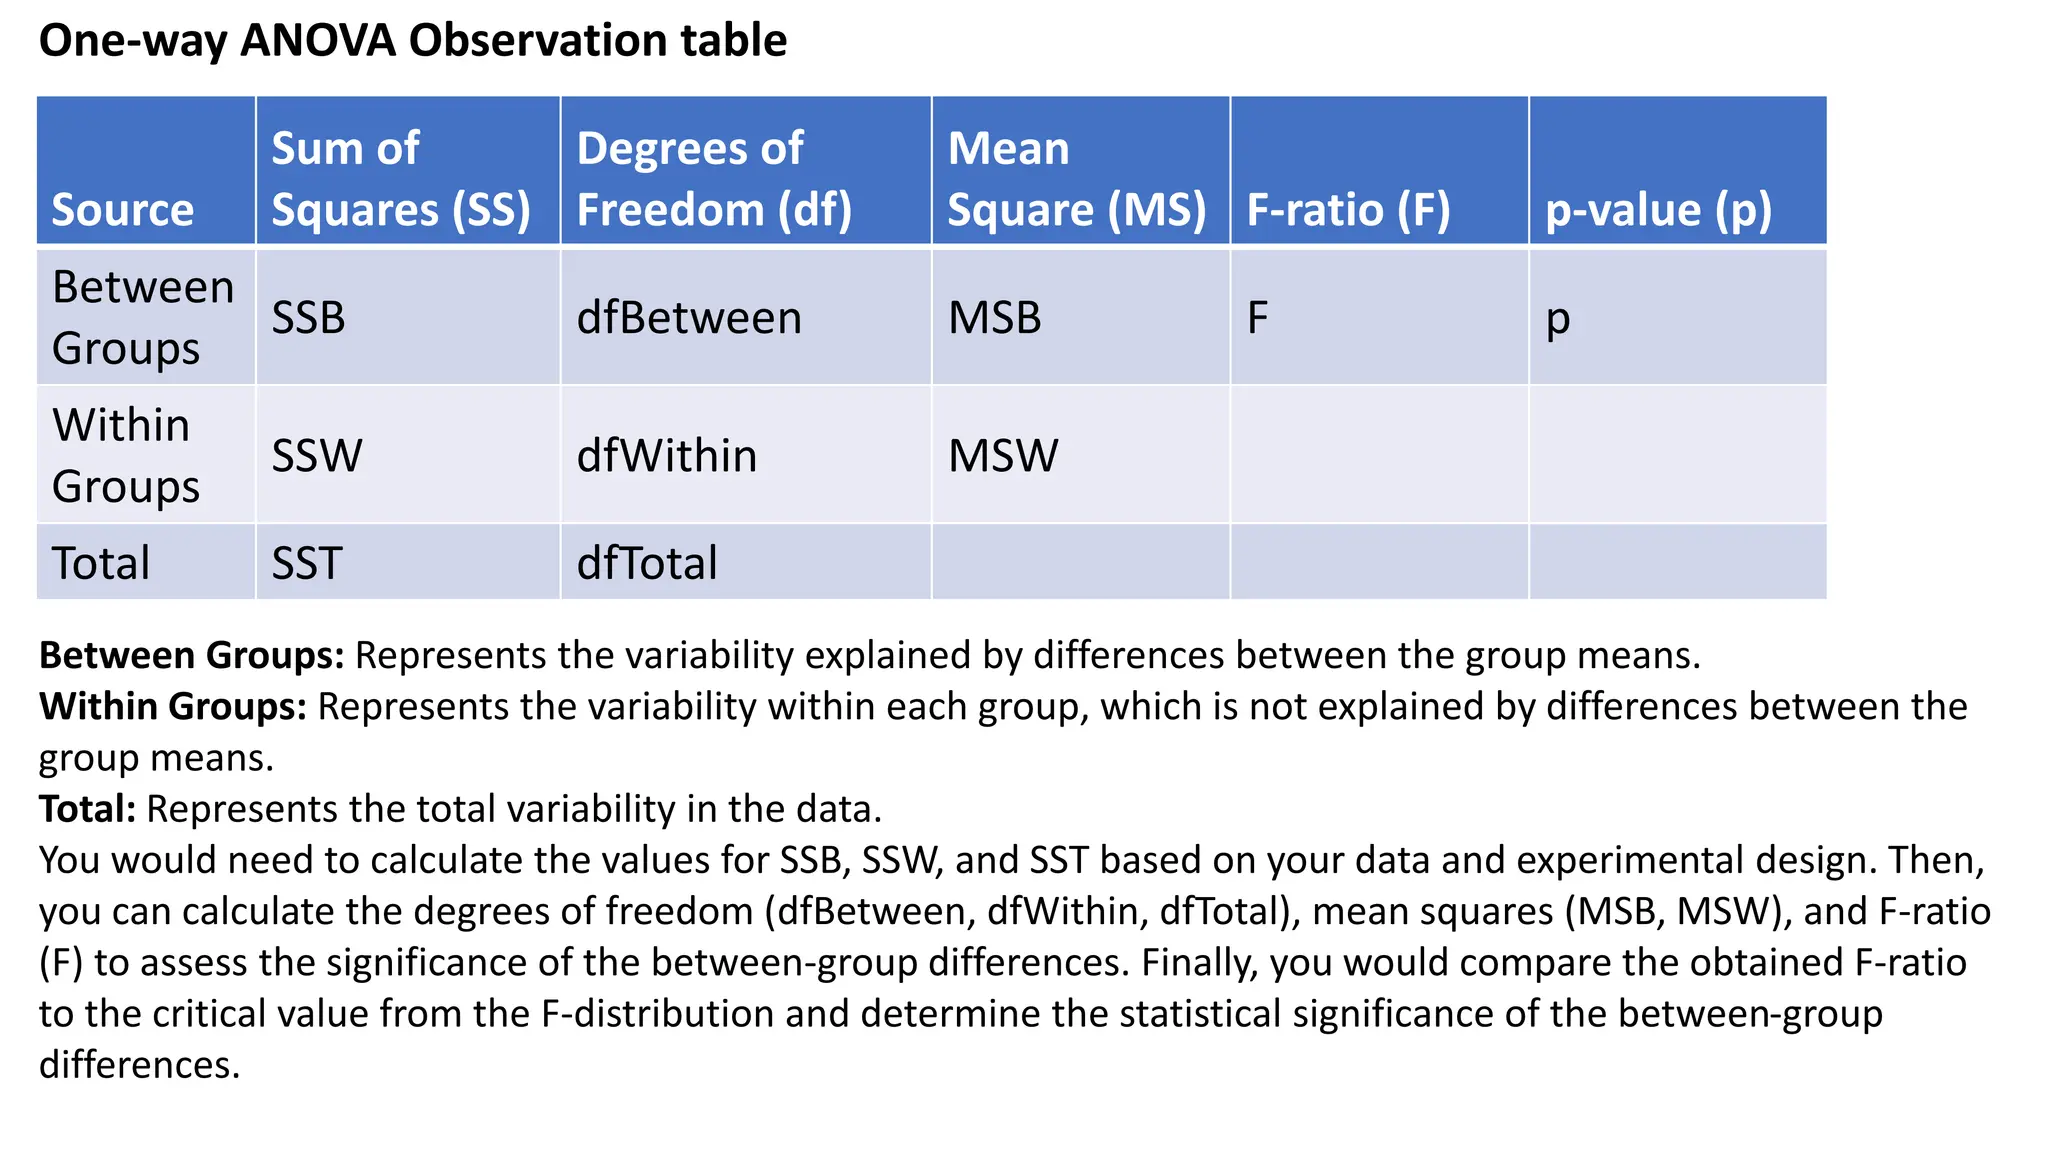
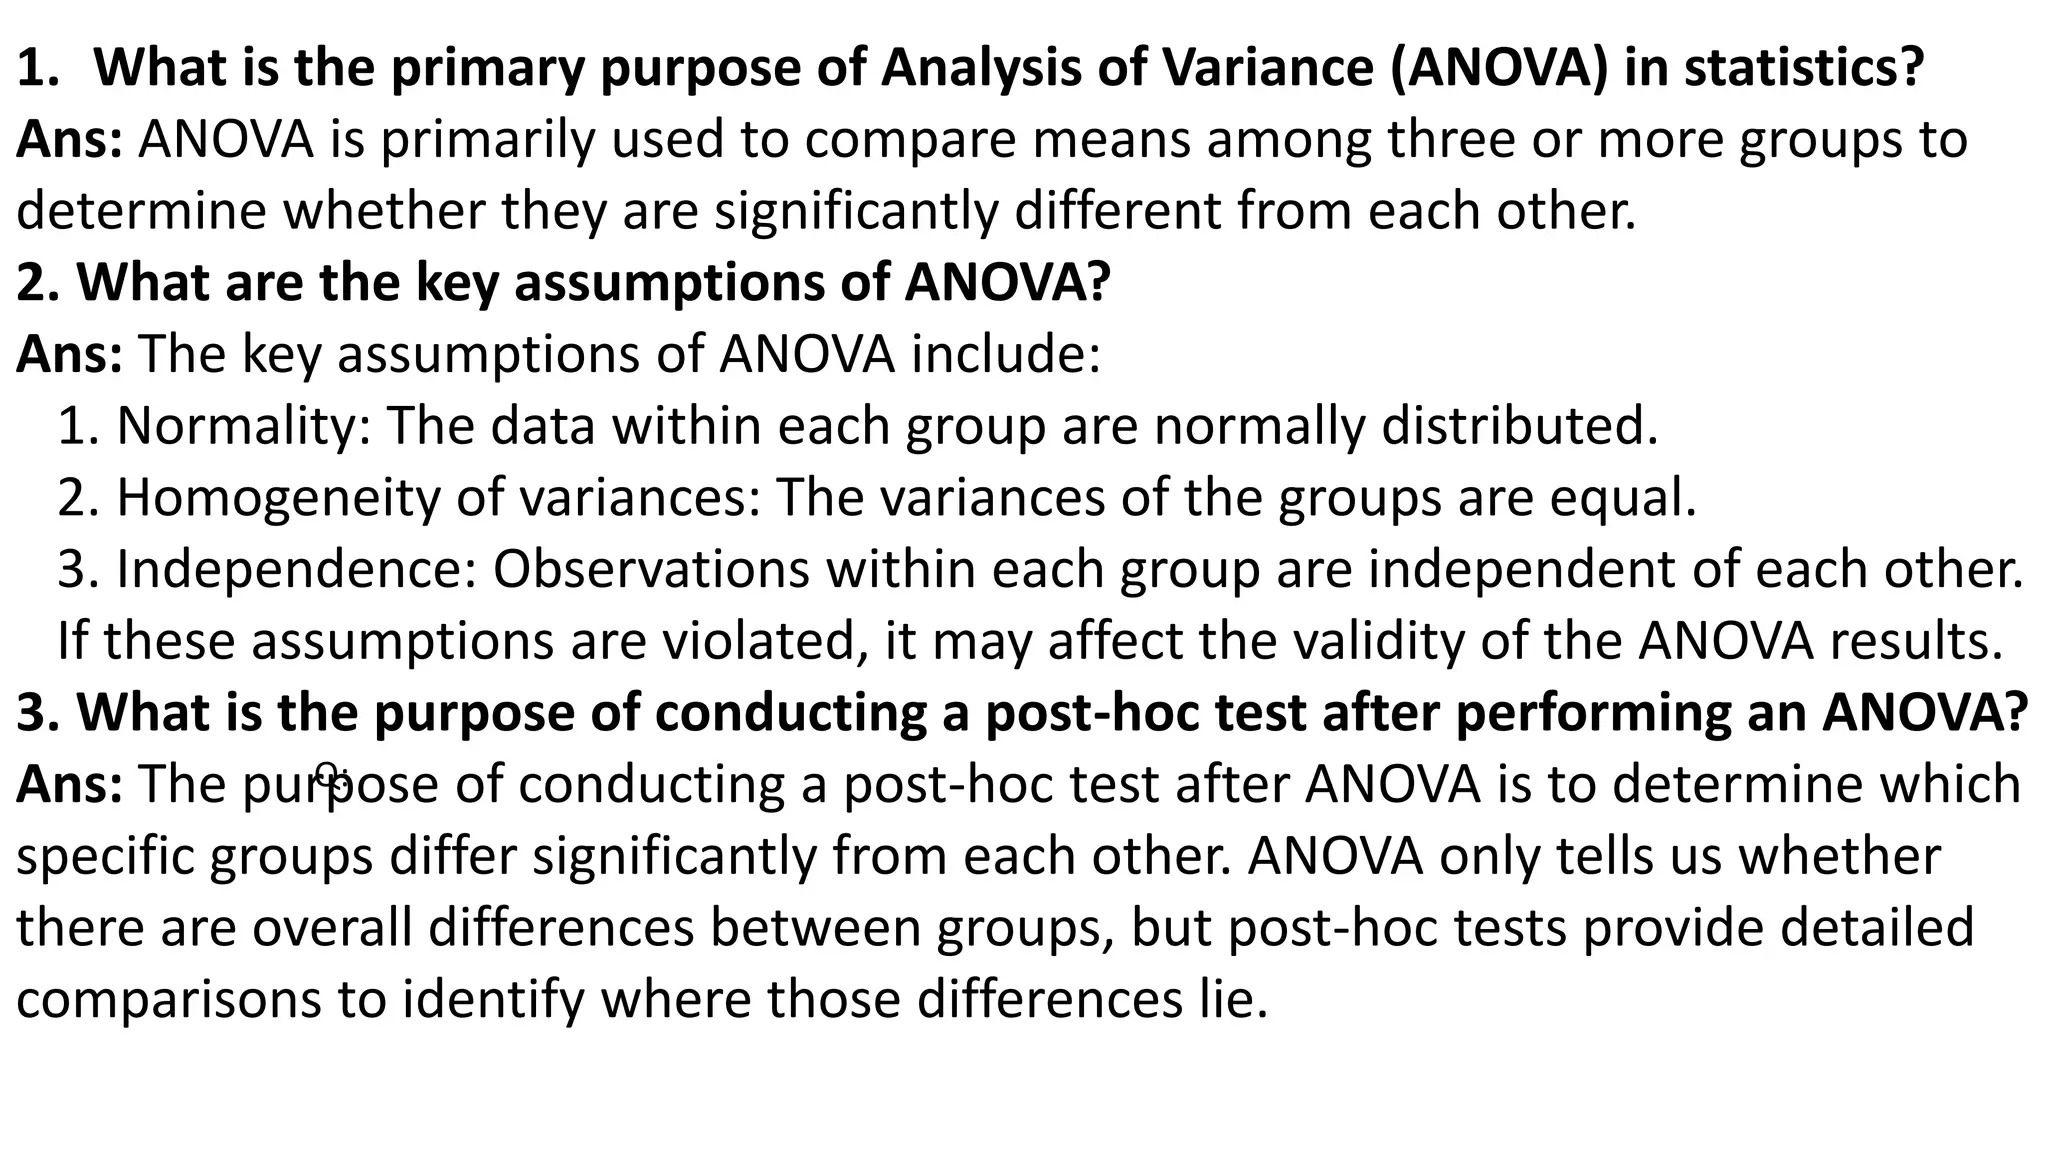
ANOVA Parametric test: Biostatics and Research Methodology
1. Parametric Test: ANOVA
Ms. Nigar K.Mujawar
Assistant Professor,
Shri.Balasaheb Mane Shikshan Prasarak Mandal Ambap
Womens College of Pharmacy, Peth-Vadgaon,
Kolhapur, MH, INDIA.
1
2. ANOVA
Purpose: Analysis of Variance (ANOVA) is a statistical method used to
compare means between three or more groups to determine if there are
significant differences.
Key Characteristics:
1. Compares variability between groups to variability within groups.
2. Useful when comparing means across multiple groups simultaneously.
Types:
1. One-Way ANOVA: Compares means across one categorical independent
variable with three or more levels/groups.
2. Two-Way ANOVA: Examines the interaction between two independent
variables on one dependent variable.
3. Types of ANOVA
1. One-Way ANOVA:
- Compares means across three or more independent groups on one factor.
- Example: Comparing teaching methods on student performance.
2. Two-Way ANOVA:
- Compares means across groups defined by two factors simultaneously.
- Examines main effects and interaction effects.
- Example: Studying diet and exercise on weight loss.
3. Factorial ANOVA:
- Handles multiple independent variables with multiple levels.
- Analyzes main effects and interactions.
- Example: Investigating temperature, humidity, and soil type on plant growth.
4. Repeated Measures ANOVA:
- Compares means across groups with repeated measurements.
- Considers correlations between measurements.
- Example: Evaluating drug treatment on patients' pain levels.
5. Mixed ANOVA:
- Combines between-subjects and within-subjects factors.
- Suitable for designs with both independent groups and repeated measures.
- Example: Assessing training program effects on performance across age groups.
4. Steps:
1. Define null (no difference) and alternative (difference exists) hypotheses.
2. Collect data from multiple groups.
3. Check assumptions, including normality and homogeneity of variances.
4. Calculate the F-statistic (The F-statistic is a ratio of two variances, typically used in analysis
of variance (ANOVA) and regression analysis, to test the null hypothesis that the variances of the
populations from which the samples are drawn are equal.) using the ratio of between-group
variance to within-group variance.
5. Determine degrees of freedom for both between-group and within-group variability.
6. Find the critical value or calculate the p-value associated with the F-statistic.
7. Interpret results: Reject the null hypothesis if the p-value is less than the significance level.
Outcome:
1. If the p-value is low (less than the significance level), there’s evidence to suggest at least one
group mean is significantly different.
2. If the p-value is high, fail to reject the null hypothesis, indicating no significant difference
between group means.
5. Assumptions of ANOVA
1. Independence: Observations within each group are independent of each other.
2. Normality: Data within each group follows a normal distribution.
3. Homogeneity of Variances (Homoscedasticity): The variances of the
populations from which the groups are sampled are equal.
4. Random Sampling: Samples are selected randomly from the population or are
representative of it.
6. Sr. No Basis for Comparison One-Way ANOVA Two-Way ANOVA
1 Definition One-way ANOVA compares means
across three or more independent
groups on one factor (independent
variable).
Two-way ANOVA compares means across
two factors simultaneously.
2 Independent Variable One Two
3 Compares Three or more levels of one factor Effect of multiple level of two factors
4 Design of Experiments Need to satisfy only two samples All the principles need to be satisfied.
5 Number of
observations
Need to be the same in each group Need to be equal in each group
6 Example Comparing the mean test scores of
students across different teaching
methods (Teaching Method A, B, C).
Examining the effect of both Teaching
Method (Factor 1) and Gender (Factor 2)
on test scores.
7. Factors It involves only one factor (e.g.,
Teaching Method) with multiple
levels (e.g., Method A, B, C).
It involves two factors (e.g.,
Teaching Method and Gender) and
their interactions.
Explain the difference between one-way ANOVA and two-way ANOVA.
7. Write the difference between ANOVA and student t-test
Sr.
No.
Comparison ANOVA Student t test
1 Number of
Groups
comparing means across three or more groups. comparing means between two groups
only.
2 Purpose ANOVA assesses whether there are significant
differences in means across multiple groups.
The t-test determines whether there is a
significant difference between the means
of two groups.
3 Assumption
s
ANOVA assumes equal variances and normality
within groups across all compared groups.
The t-test assumes equal variances and
normality within each of the two groups
being compared.
4 Statistical
Test
ANOVA uses the F-test to determine significance. The t-test uses the t-statistic to assess
significance.
5 Degrees of
Freedom
ANOVA has separate degrees of freedom for
both between-group and within-group
variations.
The t-test has degrees of freedom
calculated based on the sample sizes of
the two groups being compared.
6 Sample
Size
It is more powerful and suitable for larger
sample sizes.
It is considered appropriate when the
sample sizes in each group are relatively
small (usually less than 30).
8. Sr.
No.
Comparison ANOVA Student t test
7
Variables
ANOVA is used to compare the means of
multiple groups based on multiple
independent variables.
The t-test is used to compare the means of
two groups based on one independent
variable.
8
Statistic
ANOVA produces an F-statistic that assesses
the overall difference among the means of
three or more groups.
The t-test generates a single value called the t-
statistic, which quantifies the difference
between the means of the two groups being
compared.
9 Interpret ANOVA results can be more complex to
interpret.
The results of a t-test are relatively easy to
interpret.
10 Error ANOVA has more scope for errors The t test is less likely to commit an error
11 Test ANOVA is a one-sided test because it has no
negative variance.
T-test can be performed in a double sided or
single sided.
12 Example When one crop is being cultivated from
different seed varieties.
Sample from class A & B students who have
taken a psychology course may have different
mean and standard deviations
9. Null and alternative hypotheses for ANOVA:
Null Hypothesis (H0):There is no significant difference in means among the
groups.
Alternative Hypothesis (H1): At least one group mean is significantly
different from the others.
In symbols, these hypotheses can be represented as:
1. Null Hypothesis (H0): μ1 = μ2 = μ3 = ... = μk (where μ represents the
population mean of each group).
2. Alternative Hypothesis (H1): At least one μi (where i = 1, 2, ..., k) is
different from the others.
10. What does it mean if the p-value in ANOVA is less than the significance
level?
If the p-value in ANOVA is less than the significance level (usually denoted by
α, typically set at 0.05), it means that there is sufficient evidence to reject the
null hypothesis.
In other words:
1. The observed differences in means among the groups are unlikely to have
occurred by random chance alone.
2. At least one group mean is significantly different from the others.
Therefore, a p-value less than the significance level indicates that there are
statistically significant differences among the groups being compared.
11. One-way ANOVA Observation table
Between Groups: Represents the variability explained by differences between the group means.
Within Groups: Represents the variability within each group, which is not explained by differences between the
group means.
Total: Represents the total variability in the data.
You would need to calculate the values for SSB, SSW, and SST based on your data and experimental design. Then,
you can calculate the degrees of freedom (dfBetween, dfWithin, dfTotal), mean squares (MSB, MSW), and F-ratio
(F) to assess the significance of the between-group differences. Finally, you would compare the obtained F-ratio
to the critical value from the F-distribution and determine the statistical significance of the between-group
differences.
Source
Sum of
Squares (SS)
Degrees of
Freedom (df)
Mean
Square (MS) F-ratio (F) p-value (p)
Between
Groups
SSB dfBetween MSB F p
Within
Groups
SSW dfWithin MSW
Total SST dfTotal
12. One-Way ANOVA:
Merits:
1. Simple to understand and implement.
2. Efficient for comparing means across multiple groups on a single factor.
3. Useful for analyzing the main effect of one independent variable on the
dependent variable.
4. Suitable for experimental designs with one categorical independent variable.
Demerits:
1. Limited in assessing interactions between multiple factors.
2. Does not account for the combined effects of multiple independent variables.
3. Requires assumptions of equal variances and normality to be met.
13. The key aspects of a one-way ANOVA with a randomized block design using
bullet points:
Design Characteristics:
- Blocks: Homogeneous groups of experimental units.
- Randomization: Treatments randomly assigned within each block.
Advantages:
1. Reduced Variability: Decreases variability within each block.
2. Increased Precision: Improves precision of treatment effect estimates.
3. Controlled Confounding: Helps control for confounding variables within blocks.
Considerations:
- Block Selection: Blocks chosen based on factors relevant to the study.
- Randomization Procedure: Random assignment of treatments within blocks.
- Analysis: Conduct one-way ANOVA treating blocks as random and treatments as fixed factors.
In summary, one-way ANOVA with randomized block design controls for confounding variables,
reduces variability, and improves precision of treatment effect estimates. It's particularly useful
when there are known sources of variability that can be accounted for by blocking.
14. Source
Sum of Squares
(SS)
Degrees of
Freedom (df)
Mean Square
(MS) F-ratio (F) p-value (p)
Factor A SSA dfA MSA F(A) p(A)
Factor B SSB dfB MSB F(B) p(B)
Interaction (AB) SSAB dfAB MSAB F(AB) p(AB)
Within Groups SSW dfWithin MSW
Total SST dfTotal
Two-Way ANOVA
Factor A: Represents the variability explained by the levels of Factor A.
Factor B: Represents the variability explained by the levels of Factor B.
Interaction (AB): Represents the combined effect of Factors A and B.
Within Groups: Represents the variability within each combination of Factor A and Factor B, not explained by the factors
themselves.
Total: Represents the total variability in the data.
You would need to calculate the values for SSA, SSB, SSAB, SSW, and SST based on your data and experimental design. Then,
you can calculate the degrees of freedom (dfA, dfB, dfAB, dfWithin, dfTotal), mean squares (MSA, MSB, MSAB, MSW), and F-
ratios (F(A), F(B), F(AB)) to assess the significance of each factor and their interaction. Finally, you would compare the
obtained F-ratios to critical values from the F-distribution and determine the statistical significance of each factor and
interaction.
15. Two-Way ANOVA:
Merits:
1. - Allows simultaneous comparison of means across groups defined by two independent
factors.
2. - Can assess main effects of each factor and their interaction effect on the dependent
variable.
3. - Provides more comprehensive insights into the relationships between multiple factors
and the dependent variable.
4. - Suitable for experimental designs with two categorical independent variables.
Demerits:
1. - More complex to interpret compared to one-way ANOVA.
2. - Requires larger sample sizes to ensure sufficient power, especially with interactions.
3. - Assumptions of equal variances and normality need to be met for accurate results.
4. - Prone to multicollinearity issues if independent variables are highly correlated.
16. Two-way block design:
- Design Characteristics:
- Utilizes two factors (independent variables) and blocks.
- Blocks are homogeneous groups of experimental units.
- Treatments are randomly assigned within each block for each combination of factor levels.
- Advantages:
- Controls for potential confounding variables within blocks.
- Reduces variability within each block.
- Allows for the assessment of main effects of each factor and their interaction.
- Considerations:
- Careful selection of blocks and factors based on relevance to the study.
- Randomization of treatments within blocks and across factor levels.
- Statistical analysis involves a two-way ANOVA with blocks treated as a random factor and
factors as fixed factors.
In summary, a two-way block design incorporates two factors, blocks, and randomization
to control for confounding variables and reduce variability, enabling the assessment of main
effects and interactions between factors.
17. Applications of ANOVA
1. Comparing means across multiple groups simultaneously
2. Analyzing the effectiveness of different treatments or interventions
3. Investigating the impact of categorical variables on a continuous outcome
4. Assessing differences in means between levels of a factor in experimental
designs
5. Examining variability in response to various experimental conditions
6. Evaluating the influence of factors such as age, gender, or location on a
dependent variable
7. Conducting quality control analysis in manufacturing processes
8. Testing for differences in group means in survey research or opinion polls
9. Assessing the impact of different teaching methods on student performance
10. Analyzing data from clinical trials to compare treatment outcomes across
multiple groups
18. 1. What is the primary purpose of Analysis of Variance (ANOVA) in statistics?
Ans: ANOVA is primarily used to compare means among three or more groups to
determine whether they are significantly different from each other.
2. What are the key assumptions of ANOVA?
Ans: The key assumptions of ANOVA include:
1. Normality: The data within each group are normally distributed.
2. Homogeneity of variances: The variances of the groups are equal.
3. Independence: Observations within each group are independent of each other.
If these assumptions are violated, it may affect the validity of the ANOVA results.
3. What is the purpose of conducting a post-hoc test after performing an ANOVA?
Ans: The purpose of conducting a post-hoc test after ANOVA is to determine which
specific groups differ significantly from each other. ANOVA only tells us whether
there are overall differences between groups, but post-hoc tests provide detailed
comparisons to identify where those differences lie.
Q: