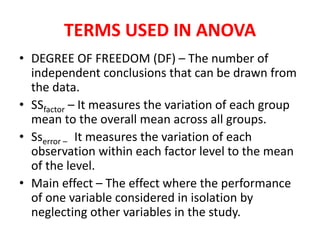
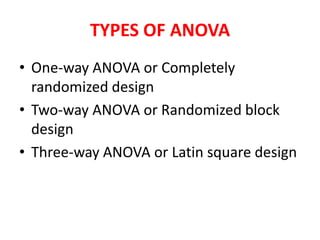
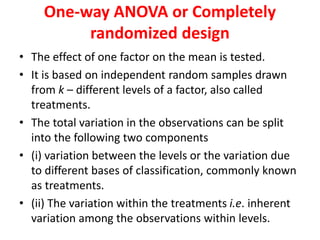
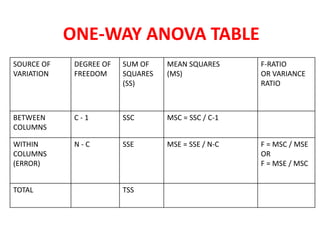
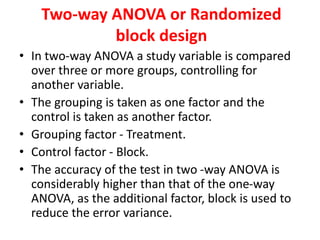
SlideShare a Scribd company logo
BIOINSTRUMENTATION AND
RESEARCH METHODOLOGY
UNIT IV – BIOSTATISTICS
TOPIC: ANOVA – ONE WAY & TWO WAY
ABARNA M P
II – M.Sc., BIOTECHNOLOGY
21PBT810
ANALYSIS OF VARIANCE (ANOVA)
• Powerful statistical tool for tests of significance.
• The test of significance using t-distribution is an
adequate procedure only for testing the
significance of the difference between two
sample means.
• When we have three or more samples to consider
at a time, an alternative procedure is needed for
testing the hypothesis that all the samples are
drawn from the same population i.e., they have
the same means.
• PURPOSE OF ANOVA: To test the homogeneity of
several means.
• ANOVA – A hypothesis testing procedure that is
used to evaluate the mean differences between
two or more treatments (or) populations.
• Invented by R.A. FISHER – Fisher’s ANOVA.
• Similar to t-test and z-test – used to compare
means and also the relative variance between
them.
• It is used to test the statistical significance of the
relationship between a dependent variable (Y)
and a single or multiple independent variable (X).
• Helps to figure out if the null hypothesis has to be
rejected or accepted.
TERMS USED IN ANOVA
• DEGREE OF FREEDOM (DF) – The number of
independent conclusions that can be drawn from
the data.
• SSfactor – It measures the variation of each group
mean to the overall mean across all groups.
• Sserror – It measures the variation of each
observation within each factor level to the mean
of the level.
• Main effect – The effect where the performance
of one variable considered in isolation by
neglecting other variables in the study.
• Interaction – This effect occurs where the effect of
one variable is different across levels of one or more
other variables.
• Mean square error (MSE) – Divide the sum of
squares of the residual error by the degrees of
freedom.
• F- test – The null hypothesis that the category means
are equal in the population is tested by F statistic
based on the ratio of mean square related to X and
MSE.
• P – value – It is the smallest level of significance that
would lead to rejection of the null hypothesis (H0).
ASSUMPTIONS FOR ANOVA TEST
• The observations follow normal distribution.
• The samples are independent.
• The population variances are equal and
unknown.
STEPS INVOLVED IN ANOVA
CALCULATION
• Establish the hypothesis.
• Find out the mean.
• Calculation of SStotal , Ssbetween and Sswithin
(SStotal - Ssbetween)
• ANOVA table
• Conclusion and Interpretation.
SOURCE OF
VARIATION
DEGREE OF
FREEDOM
SUM OF
SQUARES
(SS)
MEAN SQUARES
(MS)
F-RATIO
BETWEEN K - 1 SSbetween SSbetween / K-1 = MSbetween
WITHIN
(ERROR)
N - K SSwithin SSwithin/ N-K = MSwithin F = MSbetween
/MSwithin
TOTAL SStotal
ANOVA TABLE
EXAMPLE
• The following data represent the gain in
weight (in kg) of a species of edible fish
cultured in 4 diet formulations (D1, D2, D3
and D4) for a period of 3 months. Analyze
these data for significant difference among
the diet formulations in terms of gain in
weight.
D1 D2 D3 D4
4 8 5 1
5 7 7 4
1 9 8 1
3 6 6 3
2 10 9 1
TYPES OF ANOVA
• One-way ANOVA or Completely
randomized design
• Two-way ANOVA or Randomized block
design
• Three-way ANOVA or Latin square design
One-way ANOVA or Completely
randomized design
• The effect of one factor on the mean is tested.
• It is based on independent random samples drawn
from k – different levels of a factor, also called
treatments.
• The total variation in the observations can be split
into the following two components
• (i) variation between the levels or the variation due
to different bases of classification, commonly known
as treatments.
• (ii) The variation within the treatments i.e. inherent
variation among the observations within levels.
SOURCE OF
VARIATION
DEGREE OF
FREEDOM
SUM OF
SQUARES
(SS)
MEAN SQUARES
(MS)
F-RATIO
OR VARIANCE
RATIO
BETWEEN
COLUMNS
C - 1 SSC MSC = SSC / C-1
WITHIN
COLUMNS
(ERROR)
N - C SSE MSE = SSE / N-C F = MSC / MSE
OR
F = MSE / MSC
TOTAL TSS
ONE-WAY ANOVA TABLE
EXAMPLE FOR ONE-WAY ANOVA
Merits and Demerits of One-Way
ANOVA
• Merits
Layout is very simple and easy to
understand.
Gives maximum degrees of freedom for
error.
• Demerits
Population variances of experimental units
for different treatments need to be equal.
Verification of normality assumption may
be difficult.
Two-way ANOVA or Randomized
block design
• In two-way ANOVA a study variable is compared
over three or more groups, controlling for
another variable.
• The grouping is taken as one factor and the
control is taken as another factor.
• Grouping factor - Treatment.
• Control factor - Block.
• The accuracy of the test in two -way ANOVA is
considerably higher than that of the one-way
ANOVA, as the additional factor, block is used to
reduce the error variance.
• The total variation present in the
observations can be split into the following
three components:
• (i) The variation between treatments (groups)
• (ii) The variation between blocks.
• (ii) The variation inherent within a particular
setting or combination of treatment and
block.
DATA REPRESENTATION FOR TWO-WAY
ANOVA
SOURCE OF
VARIATION
DEGREE OF
FREEDOM
SUM OF
SQUARES
(SS)
MEAN
SQUARES
(MS)
F-RATIO
OR VARIANCE
RATIO
COLUMN
(TREATMENTS)
C - 1 SSC MSC = SSC/C-1 Fc = MSC/MSE
OR
Fc = MSE/MSC
ROW
(BLOCKS)
R - 1 SSR MSR = SSR/R-1 Fr = MSR/MSE
OR
Fr = MSE/MSR
ERROR (R-1)(C-1) or
N-C-R+1
SSE MSE =
SSE/(R-1)(C-1)
TOTAL TSS
TWO-WAY ANOVA TABLE
EXAMPLE FOR TWO-WAY ANOVA
Merits and Demerits of two-way
ANOVA
• Merits
Any number of blocks and treatments can be used.
Number of units in each block should be equal.
It is the most used design in view of the smaller total
sample size since we are studying two variable at a
time.
• Demerits
If the number of treatments is large enough, then it
becomes difficult to maintain the homogeneity of
the blocks.
If there is a missing value, it cannot be ignored. It
has to be replaced with some function of the existing
values and certain adjustments have to be made in
the analysis. This makes the analysis slightly complex.
THANK YOU

More Related Content

What's hot

Experimental designs
Experimental designsExperimental designs
Experimental designs
rx_sonali
 
Standard error
Standard error Standard error
Standard error
Satyaki Mishra
 
non parametric statistics
non parametric statisticsnon parametric statistics
non parametric statistics
Anchal Garg
 
ANOVA TEST by shafeek
ANOVA TEST by shafeekANOVA TEST by shafeek
ANOVA TEST by shafeek
Shafeek S
 
Analysis of variance
Analysis of varianceAnalysis of variance
Analysis of variance
Dr NEETHU ASOKAN
 
Standard error of the mean
Standard error of the meanStandard error of the mean
One way anova final ppt.
One way anova final ppt.One way anova final ppt.
One way anova final ppt.
Aadab Mushrib
 
Regression
RegressionRegression
Regression
Buddy Krishna
 
Student's t test
Student's t testStudent's t test
Student's t test
Shahla Yasmin
 
Parametric tests
Parametric testsParametric tests
Parametric tests
heena45
 
factorial design
factorial designfactorial design
factorial design
Mahesh Marathe
 
F test and ANOVA
F test and ANOVAF test and ANOVA
F test and ANOVA
MEENURANJI
 
PROBABILITY
PROBABILITYPROBABILITY
PROBABILITY
manas das
 
Correlation
CorrelationCorrelation
Correlation
Anish Maman
 
Standard error-Biostatistics
Standard error-BiostatisticsStandard error-Biostatistics
Standard error-Biostatistics
Sudha Rameshwari
 
T test
T testT test
Parametric and nonparametric test
Parametric and nonparametric testParametric and nonparametric test
Parametric and nonparametric test
ponnienselvi
 
FREQUENCY DISTRIBUTION.pptx
FREQUENCY DISTRIBUTION.pptxFREQUENCY DISTRIBUTION.pptx
FREQUENCY DISTRIBUTION.pptx
SreeLatha98
 
Student t test
Student t testStudent t test
Student t test
Dr Shovan Padhy, MD
 
Z-test
Z-testZ-test
Z-test
femymoni
 

What's hot (20)

Experimental designs
Experimental designsExperimental designs
Experimental designs
 
Standard error
Standard error Standard error
Standard error
 
non parametric statistics
non parametric statisticsnon parametric statistics
non parametric statistics
 
ANOVA TEST by shafeek
ANOVA TEST by shafeekANOVA TEST by shafeek
ANOVA TEST by shafeek
 
Analysis of variance
Analysis of varianceAnalysis of variance
Analysis of variance
 
Standard error of the mean
Standard error of the meanStandard error of the mean
Standard error of the mean
 
One way anova final ppt.
One way anova final ppt.One way anova final ppt.
One way anova final ppt.
 
Regression
RegressionRegression
Regression
 
Student's t test
Student's t testStudent's t test
Student's t test
 
Parametric tests
Parametric testsParametric tests
Parametric tests
 
factorial design
factorial designfactorial design
factorial design
 
F test and ANOVA
F test and ANOVAF test and ANOVA
F test and ANOVA
 
PROBABILITY
PROBABILITYPROBABILITY
PROBABILITY
 
Correlation
CorrelationCorrelation
Correlation
 
Standard error-Biostatistics
Standard error-BiostatisticsStandard error-Biostatistics
Standard error-Biostatistics
 
T test
T testT test
T test
 
Parametric and nonparametric test
Parametric and nonparametric testParametric and nonparametric test
Parametric and nonparametric test
 
FREQUENCY DISTRIBUTION.pptx
FREQUENCY DISTRIBUTION.pptxFREQUENCY DISTRIBUTION.pptx
FREQUENCY DISTRIBUTION.pptx
 
Student t test
Student t testStudent t test
Student t test
 
Z-test
Z-testZ-test
Z-test
 

Similar to Anova - One way and two way

Shovan anova main
Shovan anova mainShovan anova main
Shovan anova main
Dr Shovan Padhy, MD
 
Parametric test - t Test, ANOVA, ANCOVA, MANOVA
Parametric test  - t Test, ANOVA, ANCOVA, MANOVAParametric test  - t Test, ANOVA, ANCOVA, MANOVA
Parametric test - t Test, ANOVA, ANCOVA, MANOVA
Princy Francis M
 
Anova, ancova, manova thiyagu
Anova, ancova, manova   thiyaguAnova, ancova, manova   thiyagu
Anova, ancova, manova thiyagu
Thiyagu K
 
Workshop on Data Analysis and Result Interpretation in Social Science Researc...
Workshop on Data Analysis and Result Interpretation in Social Science Researc...Workshop on Data Analysis and Result Interpretation in Social Science Researc...
Workshop on Data Analysis and Result Interpretation in Social Science Researc...
Academy for Higher Education and Social Science Research
 
Analysis of data in research
Analysis of data in researchAnalysis of data in research
Analysis of data in research
Abhijeet Birari
 
Statr session 19 and 20
Statr session 19 and 20Statr session 19 and 20
Statr session 19 and 20
Ruru Chowdhury
 
mean comparison.pptx
mean comparison.pptxmean comparison.pptx
mean comparison.pptx
FenembarMekonnen
 
mean comparison.pptx
mean comparison.pptxmean comparison.pptx
mean comparison.pptx
FenembarMekonnen
 
Applied statistics lecture_8
Applied statistics lecture_8Applied statistics lecture_8
Applied statistics lecture_8
Daria Bogdanova
 
Anova; analysis of variance
Anova; analysis of varianceAnova; analysis of variance
Anova; analysis of variance
Dr. Priyamvada Saarsar
 
Statistics for Anaesthesiologists
Statistics for AnaesthesiologistsStatistics for Anaesthesiologists
Statistics for Anaesthesiologists
xeonfusion
 
Anova single factor
Anova single factorAnova single factor
Anova single factor
Dhruv Patel
 
1 ANOVA.ppt
1 ANOVA.ppt1 ANOVA.ppt
1 ANOVA.ppt
Alemayehu70
 
Anova (f test) and mean differentiation
Anova (f test) and mean differentiationAnova (f test) and mean differentiation
Anova (f test) and mean differentiation
Subramani Parasuraman
 
Parametric & non-parametric
Parametric & non-parametricParametric & non-parametric
Parametric & non-parametric
SoniaBabaee
 
(Individuals With Disabilities Act Transformation Over the Years)D
(Individuals With Disabilities Act Transformation Over the Years)D(Individuals With Disabilities Act Transformation Over the Years)D
(Individuals With Disabilities Act Transformation Over the Years)D
SilvaGraf83
 
(Individuals With Disabilities Act Transformation Over the Years)D
(Individuals With Disabilities Act Transformation Over the Years)D(Individuals With Disabilities Act Transformation Over the Years)D
(Individuals With Disabilities Act Transformation Over the Years)D
MoseStaton39
 
Analysis of Covariance.pptx
Analysis of Covariance.pptxAnalysis of Covariance.pptx
Analysis of Covariance.pptx
Sunita Poudel
 
Ch7 Analysis of Variance (ANOVA)
Ch7 Analysis of Variance (ANOVA)Ch7 Analysis of Variance (ANOVA)
Ch7 Analysis of Variance (ANOVA)
Farhan Alfin
 
Analysis of Variance (ANOVA)
Analysis of Variance (ANOVA)Analysis of Variance (ANOVA)
Analysis of Variance (ANOVA)
Avjinder (Avi) Kaler
 

Similar to Anova - One way and two way (20)

Shovan anova main
Shovan anova mainShovan anova main
Shovan anova main
 
Parametric test - t Test, ANOVA, ANCOVA, MANOVA
Parametric test  - t Test, ANOVA, ANCOVA, MANOVAParametric test  - t Test, ANOVA, ANCOVA, MANOVA
Parametric test - t Test, ANOVA, ANCOVA, MANOVA
 
Anova, ancova, manova thiyagu
Anova, ancova, manova   thiyaguAnova, ancova, manova   thiyagu
Anova, ancova, manova thiyagu
 
Workshop on Data Analysis and Result Interpretation in Social Science Researc...
Workshop on Data Analysis and Result Interpretation in Social Science Researc...Workshop on Data Analysis and Result Interpretation in Social Science Researc...
Workshop on Data Analysis and Result Interpretation in Social Science Researc...
 
Analysis of data in research
Analysis of data in researchAnalysis of data in research
Analysis of data in research
 
Statr session 19 and 20
Statr session 19 and 20Statr session 19 and 20
Statr session 19 and 20
 
mean comparison.pptx
mean comparison.pptxmean comparison.pptx
mean comparison.pptx
 
mean comparison.pptx
mean comparison.pptxmean comparison.pptx
mean comparison.pptx
 
Applied statistics lecture_8
Applied statistics lecture_8Applied statistics lecture_8
Applied statistics lecture_8
 
Anova; analysis of variance
Anova; analysis of varianceAnova; analysis of variance
Anova; analysis of variance
 
Statistics for Anaesthesiologists
Statistics for AnaesthesiologistsStatistics for Anaesthesiologists
Statistics for Anaesthesiologists
 
Anova single factor
Anova single factorAnova single factor
Anova single factor
 
1 ANOVA.ppt
1 ANOVA.ppt1 ANOVA.ppt
1 ANOVA.ppt
 
Anova (f test) and mean differentiation
Anova (f test) and mean differentiationAnova (f test) and mean differentiation
Anova (f test) and mean differentiation
 
Parametric & non-parametric
Parametric & non-parametricParametric & non-parametric
Parametric & non-parametric
 
(Individuals With Disabilities Act Transformation Over the Years)D
(Individuals With Disabilities Act Transformation Over the Years)D(Individuals With Disabilities Act Transformation Over the Years)D
(Individuals With Disabilities Act Transformation Over the Years)D
 
(Individuals With Disabilities Act Transformation Over the Years)D
(Individuals With Disabilities Act Transformation Over the Years)D(Individuals With Disabilities Act Transformation Over the Years)D
(Individuals With Disabilities Act Transformation Over the Years)D
 
Analysis of Covariance.pptx
Analysis of Covariance.pptxAnalysis of Covariance.pptx
Analysis of Covariance.pptx
 
Ch7 Analysis of Variance (ANOVA)
Ch7 Analysis of Variance (ANOVA)Ch7 Analysis of Variance (ANOVA)
Ch7 Analysis of Variance (ANOVA)
 
Analysis of Variance (ANOVA)
Analysis of Variance (ANOVA)Analysis of Variance (ANOVA)
Analysis of Variance (ANOVA)
 

Recently uploaded

EWOCS-I: The catalog of X-ray sources in Westerlund 1 from the Extended Weste...
EWOCS-I: The catalog of X-ray sources in Westerlund 1 from the Extended Weste...EWOCS-I: The catalog of X-ray sources in Westerlund 1 from the Extended Weste...
EWOCS-I: The catalog of X-ray sources in Westerlund 1 from the Extended Weste...
Sérgio Sacani
 
The binding of cosmological structures by massless topological defects
The binding of cosmological structures by massless topological defectsThe binding of cosmological structures by massless topological defects
The binding of cosmological structures by massless topological defects
Sérgio Sacani
 
Cytokines and their role in immune regulation.pptx
Cytokines and their role in immune regulation.pptxCytokines and their role in immune regulation.pptx
Cytokines and their role in immune regulation.pptx
Hitesh Sikarwar
 
Oedema_types_causes_pathophysiology.pptx
Oedema_types_causes_pathophysiology.pptxOedema_types_causes_pathophysiology.pptx
Oedema_types_causes_pathophysiology.pptx
muralinath2
 
8.Isolation of pure cultures and preservation of cultures.pdf
8.Isolation of pure cultures and preservation of cultures.pdf8.Isolation of pure cultures and preservation of cultures.pdf
8.Isolation of pure cultures and preservation of cultures.pdf
by6843629
 
Eukaryotic Transcription Presentation.pptx
Eukaryotic Transcription Presentation.pptxEukaryotic Transcription Presentation.pptx
Eukaryotic Transcription Presentation.pptx
RitabrataSarkar3
 
Shallowest Oil Discovery of Turkiye.pptx
Shallowest Oil Discovery of Turkiye.pptxShallowest Oil Discovery of Turkiye.pptx
Shallowest Oil Discovery of Turkiye.pptx
Gokturk Mehmet Dilci
 
THEMATIC APPERCEPTION TEST(TAT) cognitive abilities, creativity, and critic...
THEMATIC  APPERCEPTION  TEST(TAT) cognitive abilities, creativity, and critic...THEMATIC  APPERCEPTION  TEST(TAT) cognitive abilities, creativity, and critic...
THEMATIC APPERCEPTION TEST(TAT) cognitive abilities, creativity, and critic...
Abdul Wali Khan University Mardan,kP,Pakistan
 
Medical Orthopedic PowerPoint Templates.pptx
Medical Orthopedic PowerPoint Templates.pptxMedical Orthopedic PowerPoint Templates.pptx
Medical Orthopedic PowerPoint Templates.pptx
terusbelajar5
 
NuGOweek 2024 Ghent programme overview flyer
NuGOweek 2024 Ghent programme overview flyerNuGOweek 2024 Ghent programme overview flyer
NuGOweek 2024 Ghent programme overview flyer
pablovgd
 
Describing and Interpreting an Immersive Learning Case with the Immersion Cub...
Describing and Interpreting an Immersive Learning Case with the Immersion Cub...Describing and Interpreting an Immersive Learning Case with the Immersion Cub...
Describing and Interpreting an Immersive Learning Case with the Immersion Cub...
Leonel Morgado
 
molar-distalization in orthodontics-seminar.pptx
molar-distalization in orthodontics-seminar.pptxmolar-distalization in orthodontics-seminar.pptx
molar-distalization in orthodontics-seminar.pptx
Anagha Prasad
 
Equivariant neural networks and representation theory
Equivariant neural networks and representation theoryEquivariant neural networks and representation theory
Equivariant neural networks and representation theory
Daniel Tubbenhauer
 
The use of Nauplii and metanauplii artemia in aquaculture (brine shrimp).pptx
The use of Nauplii and metanauplii artemia in aquaculture (brine shrimp).pptxThe use of Nauplii and metanauplii artemia in aquaculture (brine shrimp).pptx
The use of Nauplii and metanauplii artemia in aquaculture (brine shrimp).pptx
MAGOTI ERNEST
 
在线办理(salfor毕业证书)索尔福德大学毕业证毕业完成信一模一样
在线办理(salfor毕业证书)索尔福德大学毕业证毕业完成信一模一样在线办理(salfor毕业证书)索尔福德大学毕业证毕业完成信一模一样
在线办理(salfor毕业证书)索尔福德大学毕业证毕业完成信一模一样
vluwdy49
 
Sharlene Leurig - Enabling Onsite Water Use with Net Zero Water
Sharlene Leurig - Enabling Onsite Water Use with Net Zero WaterSharlene Leurig - Enabling Onsite Water Use with Net Zero Water
Sharlene Leurig - Enabling Onsite Water Use with Net Zero Water
Texas Alliance of Groundwater Districts
 
Thornton ESPP slides UK WW Network 4_6_24.pdf
Thornton ESPP slides UK WW Network 4_6_24.pdfThornton ESPP slides UK WW Network 4_6_24.pdf
Thornton ESPP slides UK WW Network 4_6_24.pdf
European Sustainable Phosphorus Platform
 
Basics of crystallography, crystal systems, classes and different forms
Basics of crystallography, crystal systems, classes and different formsBasics of crystallography, crystal systems, classes and different forms
Basics of crystallography, crystal systems, classes and different forms
MaheshaNanjegowda
 
Remote Sensing and Computational, Evolutionary, Supercomputing, and Intellige...
Remote Sensing and Computational, Evolutionary, Supercomputing, and Intellige...Remote Sensing and Computational, Evolutionary, Supercomputing, and Intellige...
Remote Sensing and Computational, Evolutionary, Supercomputing, and Intellige...
University of Maribor
 
SAR of Medicinal Chemistry 1st by dk.pdf
SAR of Medicinal Chemistry 1st by dk.pdfSAR of Medicinal Chemistry 1st by dk.pdf
SAR of Medicinal Chemistry 1st by dk.pdf
KrushnaDarade1
 

Recently uploaded (20)

EWOCS-I: The catalog of X-ray sources in Westerlund 1 from the Extended Weste...
EWOCS-I: The catalog of X-ray sources in Westerlund 1 from the Extended Weste...EWOCS-I: The catalog of X-ray sources in Westerlund 1 from the Extended Weste...
EWOCS-I: The catalog of X-ray sources in Westerlund 1 from the Extended Weste...
 
The binding of cosmological structures by massless topological defects
The binding of cosmological structures by massless topological defectsThe binding of cosmological structures by massless topological defects
The binding of cosmological structures by massless topological defects
 
Cytokines and their role in immune regulation.pptx
Cytokines and their role in immune regulation.pptxCytokines and their role in immune regulation.pptx
Cytokines and their role in immune regulation.pptx
 
Oedema_types_causes_pathophysiology.pptx
Oedema_types_causes_pathophysiology.pptxOedema_types_causes_pathophysiology.pptx
Oedema_types_causes_pathophysiology.pptx
 
8.Isolation of pure cultures and preservation of cultures.pdf
8.Isolation of pure cultures and preservation of cultures.pdf8.Isolation of pure cultures and preservation of cultures.pdf
8.Isolation of pure cultures and preservation of cultures.pdf
 
Eukaryotic Transcription Presentation.pptx
Eukaryotic Transcription Presentation.pptxEukaryotic Transcription Presentation.pptx
Eukaryotic Transcription Presentation.pptx
 
Shallowest Oil Discovery of Turkiye.pptx
Shallowest Oil Discovery of Turkiye.pptxShallowest Oil Discovery of Turkiye.pptx
Shallowest Oil Discovery of Turkiye.pptx
 
THEMATIC APPERCEPTION TEST(TAT) cognitive abilities, creativity, and critic...
THEMATIC  APPERCEPTION  TEST(TAT) cognitive abilities, creativity, and critic...THEMATIC  APPERCEPTION  TEST(TAT) cognitive abilities, creativity, and critic...
THEMATIC APPERCEPTION TEST(TAT) cognitive abilities, creativity, and critic...
 
Medical Orthopedic PowerPoint Templates.pptx
Medical Orthopedic PowerPoint Templates.pptxMedical Orthopedic PowerPoint Templates.pptx
Medical Orthopedic PowerPoint Templates.pptx
 
NuGOweek 2024 Ghent programme overview flyer
NuGOweek 2024 Ghent programme overview flyerNuGOweek 2024 Ghent programme overview flyer
NuGOweek 2024 Ghent programme overview flyer
 
Describing and Interpreting an Immersive Learning Case with the Immersion Cub...
Describing and Interpreting an Immersive Learning Case with the Immersion Cub...Describing and Interpreting an Immersive Learning Case with the Immersion Cub...
Describing and Interpreting an Immersive Learning Case with the Immersion Cub...
 
molar-distalization in orthodontics-seminar.pptx
molar-distalization in orthodontics-seminar.pptxmolar-distalization in orthodontics-seminar.pptx
molar-distalization in orthodontics-seminar.pptx
 
Equivariant neural networks and representation theory
Equivariant neural networks and representation theoryEquivariant neural networks and representation theory
Equivariant neural networks and representation theory
 
The use of Nauplii and metanauplii artemia in aquaculture (brine shrimp).pptx
The use of Nauplii and metanauplii artemia in aquaculture (brine shrimp).pptxThe use of Nauplii and metanauplii artemia in aquaculture (brine shrimp).pptx
The use of Nauplii and metanauplii artemia in aquaculture (brine shrimp).pptx
 
在线办理(salfor毕业证书)索尔福德大学毕业证毕业完成信一模一样
在线办理(salfor毕业证书)索尔福德大学毕业证毕业完成信一模一样在线办理(salfor毕业证书)索尔福德大学毕业证毕业完成信一模一样
在线办理(salfor毕业证书)索尔福德大学毕业证毕业完成信一模一样
 
Sharlene Leurig - Enabling Onsite Water Use with Net Zero Water
Sharlene Leurig - Enabling Onsite Water Use with Net Zero WaterSharlene Leurig - Enabling Onsite Water Use with Net Zero Water
Sharlene Leurig - Enabling Onsite Water Use with Net Zero Water
 
Thornton ESPP slides UK WW Network 4_6_24.pdf
Thornton ESPP slides UK WW Network 4_6_24.pdfThornton ESPP slides UK WW Network 4_6_24.pdf
Thornton ESPP slides UK WW Network 4_6_24.pdf
 
Basics of crystallography, crystal systems, classes and different forms
Basics of crystallography, crystal systems, classes and different formsBasics of crystallography, crystal systems, classes and different forms
Basics of crystallography, crystal systems, classes and different forms
 
Remote Sensing and Computational, Evolutionary, Supercomputing, and Intellige...
Remote Sensing and Computational, Evolutionary, Supercomputing, and Intellige...Remote Sensing and Computational, Evolutionary, Supercomputing, and Intellige...
Remote Sensing and Computational, Evolutionary, Supercomputing, and Intellige...
 
SAR of Medicinal Chemistry 1st by dk.pdf
SAR of Medicinal Chemistry 1st by dk.pdfSAR of Medicinal Chemistry 1st by dk.pdf
SAR of Medicinal Chemistry 1st by dk.pdf
 

Anova - One way and two way

  • 1. BIOINSTRUMENTATION AND RESEARCH METHODOLOGY UNIT IV – BIOSTATISTICS TOPIC: ANOVA – ONE WAY & TWO WAY ABARNA M P II – M.Sc., BIOTECHNOLOGY 21PBT810
  • 2. ANALYSIS OF VARIANCE (ANOVA) • Powerful statistical tool for tests of significance. • The test of significance using t-distribution is an adequate procedure only for testing the significance of the difference between two sample means. • When we have three or more samples to consider at a time, an alternative procedure is needed for testing the hypothesis that all the samples are drawn from the same population i.e., they have the same means. • PURPOSE OF ANOVA: To test the homogeneity of several means.
  • 3. • ANOVA – A hypothesis testing procedure that is used to evaluate the mean differences between two or more treatments (or) populations. • Invented by R.A. FISHER – Fisher’s ANOVA. • Similar to t-test and z-test – used to compare means and also the relative variance between them. • It is used to test the statistical significance of the relationship between a dependent variable (Y) and a single or multiple independent variable (X). • Helps to figure out if the null hypothesis has to be rejected or accepted.
  • 4. TERMS USED IN ANOVA • DEGREE OF FREEDOM (DF) – The number of independent conclusions that can be drawn from the data. • SSfactor – It measures the variation of each group mean to the overall mean across all groups. • Sserror – It measures the variation of each observation within each factor level to the mean of the level. • Main effect – The effect where the performance of one variable considered in isolation by neglecting other variables in the study.
  • 5. • Interaction – This effect occurs where the effect of one variable is different across levels of one or more other variables. • Mean square error (MSE) – Divide the sum of squares of the residual error by the degrees of freedom. • F- test – The null hypothesis that the category means are equal in the population is tested by F statistic based on the ratio of mean square related to X and MSE. • P – value – It is the smallest level of significance that would lead to rejection of the null hypothesis (H0).
  • 6. ASSUMPTIONS FOR ANOVA TEST • The observations follow normal distribution. • The samples are independent. • The population variances are equal and unknown.
  • 7. STEPS INVOLVED IN ANOVA CALCULATION • Establish the hypothesis. • Find out the mean. • Calculation of SStotal , Ssbetween and Sswithin (SStotal - Ssbetween) • ANOVA table • Conclusion and Interpretation.
  • 8. SOURCE OF VARIATION DEGREE OF FREEDOM SUM OF SQUARES (SS) MEAN SQUARES (MS) F-RATIO BETWEEN K - 1 SSbetween SSbetween / K-1 = MSbetween WITHIN (ERROR) N - K SSwithin SSwithin/ N-K = MSwithin F = MSbetween /MSwithin TOTAL SStotal ANOVA TABLE
  • 9. EXAMPLE • The following data represent the gain in weight (in kg) of a species of edible fish cultured in 4 diet formulations (D1, D2, D3 and D4) for a period of 3 months. Analyze these data for significant difference among the diet formulations in terms of gain in weight. D1 D2 D3 D4 4 8 5 1 5 7 7 4 1 9 8 1 3 6 6 3 2 10 9 1
  • 10. TYPES OF ANOVA • One-way ANOVA or Completely randomized design • Two-way ANOVA or Randomized block design • Three-way ANOVA or Latin square design
  • 11. One-way ANOVA or Completely randomized design • The effect of one factor on the mean is tested. • It is based on independent random samples drawn from k – different levels of a factor, also called treatments. • The total variation in the observations can be split into the following two components • (i) variation between the levels or the variation due to different bases of classification, commonly known as treatments. • (ii) The variation within the treatments i.e. inherent variation among the observations within levels.
  • 12.
  • 13. SOURCE OF VARIATION DEGREE OF FREEDOM SUM OF SQUARES (SS) MEAN SQUARES (MS) F-RATIO OR VARIANCE RATIO BETWEEN COLUMNS C - 1 SSC MSC = SSC / C-1 WITHIN COLUMNS (ERROR) N - C SSE MSE = SSE / N-C F = MSC / MSE OR F = MSE / MSC TOTAL TSS ONE-WAY ANOVA TABLE
  • 15. Merits and Demerits of One-Way ANOVA • Merits Layout is very simple and easy to understand. Gives maximum degrees of freedom for error. • Demerits Population variances of experimental units for different treatments need to be equal. Verification of normality assumption may be difficult.
  • 16. Two-way ANOVA or Randomized block design • In two-way ANOVA a study variable is compared over three or more groups, controlling for another variable. • The grouping is taken as one factor and the control is taken as another factor. • Grouping factor - Treatment. • Control factor - Block. • The accuracy of the test in two -way ANOVA is considerably higher than that of the one-way ANOVA, as the additional factor, block is used to reduce the error variance.
  • 17. • The total variation present in the observations can be split into the following three components: • (i) The variation between treatments (groups) • (ii) The variation between blocks. • (ii) The variation inherent within a particular setting or combination of treatment and block.
  • 18. DATA REPRESENTATION FOR TWO-WAY ANOVA
  • 19. SOURCE OF VARIATION DEGREE OF FREEDOM SUM OF SQUARES (SS) MEAN SQUARES (MS) F-RATIO OR VARIANCE RATIO COLUMN (TREATMENTS) C - 1 SSC MSC = SSC/C-1 Fc = MSC/MSE OR Fc = MSE/MSC ROW (BLOCKS) R - 1 SSR MSR = SSR/R-1 Fr = MSR/MSE OR Fr = MSE/MSR ERROR (R-1)(C-1) or N-C-R+1 SSE MSE = SSE/(R-1)(C-1) TOTAL TSS TWO-WAY ANOVA TABLE
  • 21. Merits and Demerits of two-way ANOVA • Merits Any number of blocks and treatments can be used. Number of units in each block should be equal. It is the most used design in view of the smaller total sample size since we are studying two variable at a time. • Demerits If the number of treatments is large enough, then it becomes difficult to maintain the homogeneity of the blocks. If there is a missing value, it cannot be ignored. It has to be replaced with some function of the existing values and certain adjustments have to be made in the analysis. This makes the analysis slightly complex.
  • 22.