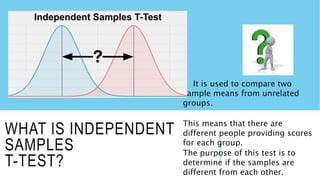
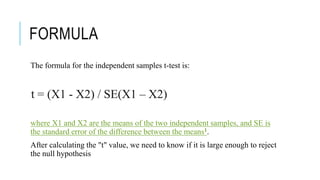
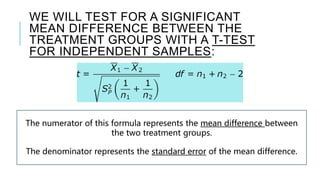
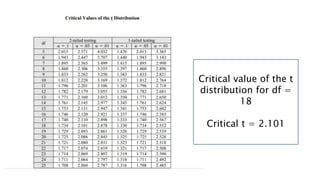
INDEPENDENT SAMPLES T-
TEST
(2-SAMPLE T-TEST)
Dr. Riddhi Vyas
1st Year
MPH (2023-25)
School of Public Health
WHAT IS INDEPENDENT
SAMPLES
T-TEST?
It is used to compare two
sample means from unrelated
groups.
This means that there are
different people providing scores
for each group.
The purpose of this test is to
determine if the samples are
different from each other.
INDEPENDENT T-TEST
This procedure is an inferential
statistical hypothesis test, meaning it uses
samples to draw conclusions about
populations.
The independent samples t test is also
known as the two sample t test.
The P value is defined as the probability
under the assumption of no effect or no
difference (null hypothesis), of obtaining a
result equal to or more extreme than what
was actually observed.
The P stands for probability and measures
how likely it is that any observed difference
between groups is due to chance.
P VALUE…..
If the p-value is less than your significance
level (e.g., 0.05), you can reject the null
hypothesis.
The difference between the two means is
statistically significant.
Your sample provides strong enough evidence to
conclude that the two population means are not
equal.
YOUR DATA MUST BE
CONTINUOUS…..
T tests require continuous data.
Continuous variables can take on
any numeric value, and the scale
can be meaningfully divided into
smaller increments, including
fractional and decimal values.
For example, when you measure
temperature, weight, and height,
you have continuous data.
THE GROUPS ARE
INDEPENDENT
Independent samples contain different sets of items in each sample.
Independent samples t tests compare two distinct samples.
Hence, it’s a two sample t test. If you have the same people or items in both groups,
you can use the paired t-test.
WHAT IS T VALUE ??
The very term t-test reflects that the test results are based purely on t-values.
T-value is what statisticians refer to as a test statistic, and it is calculated
from your sample data during hypothesis tests.
It is then used to compare your data to what is expected under null
hypothesis.
If the resulting t-value is extreme enough, it means that you have
encountered a deviation from the null hypothesis, significant enough to allow
you to reject the null.
FORMULA
The formula for the independent samples t-test is:
t = (X1 - X2) / SE(X1 – X2)
where X1 and X2 are the means of the two independent samples, and SE is
the standard error of the difference between the means1.
After calculating the "t" value, we need to know if it is large enough to reject
the null hypothesis
VICTOR BISSONNETTE
RESOURCES FOR THE LEARNING AND TEACHING OF STATISTICS AND
BEHAVIORAL SCIENCE
Twenty participants were given a list of 20 words to process.
The 20 participants were randomly assigned to one of two treatment
conditions.
1) Half were instructed to count the number of vowels in each word
(shallow processing).
2) Half were instructed to judge whether the object described by each
word would be useful if one were stranded on a desert island (deep
processing).
After a brief distractor task, all subjects were given a surprise free recall
task. The number of words correctly recalled was recorded for each
Shallow
Processing:
13 12 11 9 11 13 14 14 14 15
Deep
Processing:
12 15 14 14 13 12 15 14 16 17
WE WILL TEST FOR A SIGNIFICANT
MEAN DIFFERENCE BETWEEN THE
TREATMENT GROUPS WITH A T-TEST
FOR INDEPENDENT SAMPLES:
The numerator of this formula represents the mean difference between
the two treatment groups.
The denominator represents the standard error of the mean difference.
COMPUTE THE MEAN AND VARIANCE
FOR EACH GROUP. YOU WILL FIND THAT:
Treatment Group: Shallow Deep
Mean: 12.600 14.200
Variance: 3.378 2.622
n: 10 10
COMPUTE THE POOLED
VARIANCE:
COMPUTE THE VALUE OF
THE T :
Critical value of the t
distribution for df =
18
Critical t = 2.101
CONCLUSION
Since the obtained t (-2.07) is not greater in absolute value than
the critical t (2.101)
We would conclude that there is not a significant difference in
recall between the two treatment groups.
REFERENCES :
T Test for Independent Samples Solution | Victor Bissonnette
(berry.edu)
https://www.ibm.com/docs/en/spss-statistics/25.0.0?topic=tests-
independent-samples-t-test
https://m.youtube.com/watch?v=c9ombGmaEy8
THANK YOU !!!!

Independent Samples t-test.pptx

  • 1.
    INDEPENDENT SAMPLES T- TEST (2-SAMPLET-TEST) Dr. Riddhi Vyas 1st Year MPH (2023-25) School of Public Health
  • 2.
    WHAT IS INDEPENDENT SAMPLES T-TEST? Itis used to compare two sample means from unrelated groups. This means that there are different people providing scores for each group. The purpose of this test is to determine if the samples are different from each other.
  • 3.
    INDEPENDENT T-TEST This procedureis an inferential statistical hypothesis test, meaning it uses samples to draw conclusions about populations. The independent samples t test is also known as the two sample t test.
  • 4.
    The P valueis defined as the probability under the assumption of no effect or no difference (null hypothesis), of obtaining a result equal to or more extreme than what was actually observed. The P stands for probability and measures how likely it is that any observed difference between groups is due to chance.
  • 5.
    P VALUE….. If thep-value is less than your significance level (e.g., 0.05), you can reject the null hypothesis. The difference between the two means is statistically significant. Your sample provides strong enough evidence to conclude that the two population means are not equal.
  • 6.
    YOUR DATA MUSTBE CONTINUOUS….. T tests require continuous data. Continuous variables can take on any numeric value, and the scale can be meaningfully divided into smaller increments, including fractional and decimal values. For example, when you measure temperature, weight, and height, you have continuous data.
  • 7.
    THE GROUPS ARE INDEPENDENT Independentsamples contain different sets of items in each sample. Independent samples t tests compare two distinct samples. Hence, it’s a two sample t test. If you have the same people or items in both groups, you can use the paired t-test.
  • 8.
    WHAT IS TVALUE ?? The very term t-test reflects that the test results are based purely on t-values. T-value is what statisticians refer to as a test statistic, and it is calculated from your sample data during hypothesis tests. It is then used to compare your data to what is expected under null hypothesis. If the resulting t-value is extreme enough, it means that you have encountered a deviation from the null hypothesis, significant enough to allow you to reject the null.
  • 9.
    FORMULA The formula forthe independent samples t-test is: t = (X1 - X2) / SE(X1 – X2) where X1 and X2 are the means of the two independent samples, and SE is the standard error of the difference between the means1. After calculating the "t" value, we need to know if it is large enough to reject the null hypothesis
  • 10.
    VICTOR BISSONNETTE RESOURCES FORTHE LEARNING AND TEACHING OF STATISTICS AND BEHAVIORAL SCIENCE Twenty participants were given a list of 20 words to process. The 20 participants were randomly assigned to one of two treatment conditions. 1) Half were instructed to count the number of vowels in each word (shallow processing). 2) Half were instructed to judge whether the object described by each word would be useful if one were stranded on a desert island (deep processing). After a brief distractor task, all subjects were given a surprise free recall task. The number of words correctly recalled was recorded for each
  • 11.
    Shallow Processing: 13 12 119 11 13 14 14 14 15 Deep Processing: 12 15 14 14 13 12 15 14 16 17
  • 12.
    WE WILL TESTFOR A SIGNIFICANT MEAN DIFFERENCE BETWEEN THE TREATMENT GROUPS WITH A T-TEST FOR INDEPENDENT SAMPLES: The numerator of this formula represents the mean difference between the two treatment groups. The denominator represents the standard error of the mean difference.
  • 13.
    COMPUTE THE MEANAND VARIANCE FOR EACH GROUP. YOU WILL FIND THAT: Treatment Group: Shallow Deep Mean: 12.600 14.200 Variance: 3.378 2.622 n: 10 10
  • 14.
  • 15.
  • 16.
    Critical value ofthe t distribution for df = 18 Critical t = 2.101
  • 17.
    CONCLUSION Since the obtainedt (-2.07) is not greater in absolute value than the critical t (2.101) We would conclude that there is not a significant difference in recall between the two treatment groups.
  • 18.
    REFERENCES : T Testfor Independent Samples Solution | Victor Bissonnette (berry.edu) https://www.ibm.com/docs/en/spss-statistics/25.0.0?topic=tests- independent-samples-t-test https://m.youtube.com/watch?v=c9ombGmaEy8
  • 19.