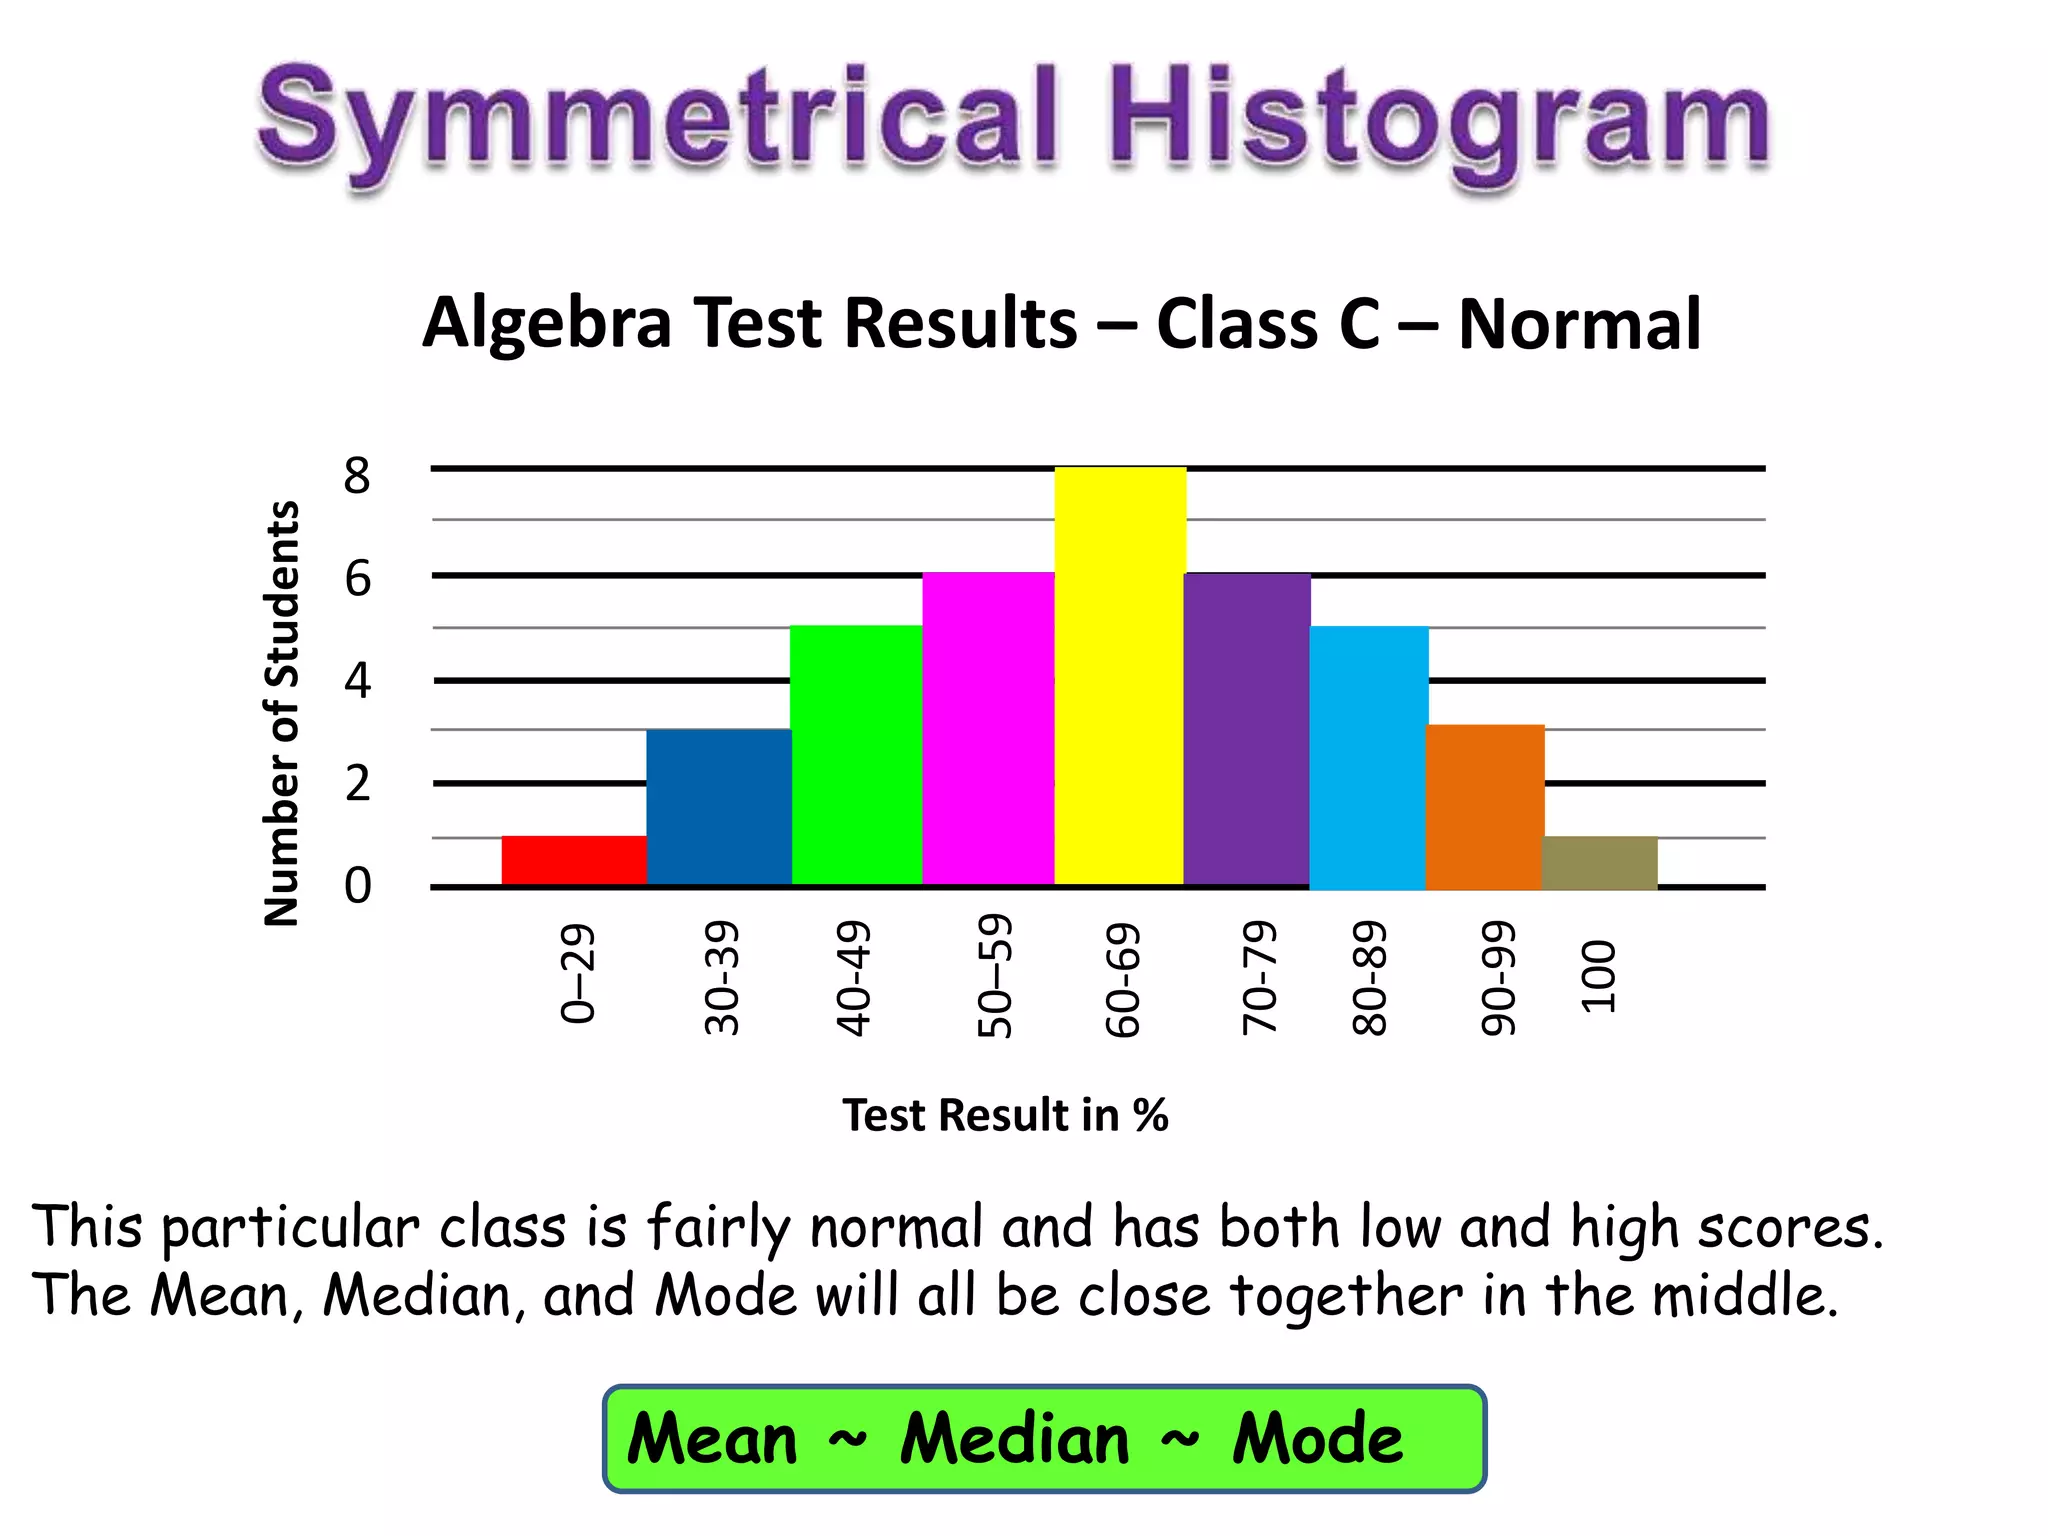
0–29
8
6
4
2
0
Test Result in %
The Shape of Graphed Results involves Symmetry and Skew
0–29
8
6
4
2
0
Test Result in %
There are a small number of students who have done well, which makes
this Graph stretch out horizontally to the right.
Going to the Right is Positive, so it has “Positive Skew”
0–29
8
6
4
2
0
Test Result in %
The Kangaroo fits onto our graph with its tail going to the RIGHT.
Going to the Right is Positive, so it has “Positive Skew”
0–29
8
6
4
2
0
Test Result in %
This particular group has lots of Low scores and has not performed well.
The Mode will be to the left of the Median, and the Mean to the right.
Mode < Median < Mean
0–29
8
6
4
2
0
Test Result in %
There are a small number of students who have done poorly, which
makes this Graph stretch out horizontally to the left.
Going to the Left is Negative, so it has “Negative Skew”
0–29
8
6
4
2
0
Test Result in %
The Kangaroo fits onto our graph with its tail going to the LEFT.
Going to the Left is Negative, so it has “Negative Skew”
0–29
8
6
4
2
0
Test Result in %
This particular class has lots of High scores and has performed very well.
The Mode will be to the right of the Median, and the Mean to the left.
Mean < Median < Mode
0–29
8
6
4
2
0
Test Result in %
This particular class is fairly normal and has both low and high scores.
This graph stretches out evenly on both sides of the Mode at 60-69.
The Graph is “Symmetrical”
0–29
8
6
4
2
0
Test Result in %
Two identical Kangaroos show this graph is a mirror image type shape.
The Graph is “Symmetrical”
0–29
8
6
4
2
0
Test Result in %
This particular class is fairly normal and has both low and high scores.
The Mean, Median, and Mode will all be close together in the middle.
Mean ~ Median ~ Mode
The Kangaroo fits onto our graph with its tail going to the RIGHT.
Going to the Right is Positive, so it has “Positive Skew”
Stem Leaf
0 1 1 2 4 7 8
1 2 2 3 5 6 6 8 9
2 1 5 6 7 7 8 8 9 9 9
3 2 4 4 5 7 7 8
4 1 3 5 8
5 2 3 7
6 2 3 4
7 2 6
8 3
9 2
Look at the S&L Plot
sideways, and form a
rotated 90 degrees view
StemLeaf
0112478
122356689
21567788999
32445778
41358
5237
6234
726
83
92
The Kangaroo fits onto our graph with its tail going to the LEFT.
Going to the Left is Negative, so it has “Negative Skew”
Stem Leaf
0 1
1 2
2 1 5
3 2 4 8
4 1 3 5
5 2 3 7
6 2 3 4 5 6 6 7 7
7 2 2 5 5 6 7 7 7 8 8 9
8 1 3 4 4 5 6 6 7 7 7
9 2 3 4 5 6 6 7 8
StemLeaf
01
12
215
3248
4135
5237
623456677
722556777889
81344566777
923456678
Look at the S&L Plot sideways
to form a rotated 90 degrees view
Stem Leaf
0 1 2
1 2 4 6
2 1 5 6 6
3 2 4 8 8 9
4 1 3 5 6 7 7 8
5 2 3 4 5 6 6 9 9 9
6 2 3 4 5 6 6 7
7 2 2 5 5 6
8 1 3 4 7
9 2 3 5
Look from the side of
the S&L Plot and form a
rotated 90 degrees view
StemLeaf
012
1246
21566
324889
41356778
5234566999
62345667
722556
81347
9235
Two identical Kangaroos show this graph is a mirror image type shape.
The S&L Plot is “Symmetrical”
SYMMETRIC RIGHT LEFT
DATA SKEWED SKEWED
3 7 3 58 3 0
4 36 4 013345569 4 5
5 017 5 2446 5
6 1120 6 17 6 2
7 356789 7 7 17
8 0158 8 2 8 2445
9 43 9 5 9 012235569
10 0 10 0 10 000
http://passyworldofmathematics.wordpress.com/

Symmetry and Skew

  • 1.
    0–29 8 6 4 2 0 Test Result in% The Shape of Graphed Results involves Symmetry and Skew
  • 2.
    0–29 8 6 4 2 0 Test Result in% There are a small number of students who have done well, which makes this Graph stretch out horizontally to the right. Going to the Right is Positive, so it has “Positive Skew”
  • 3.
    0–29 8 6 4 2 0 Test Result in% The Kangaroo fits onto our graph with its tail going to the RIGHT. Going to the Right is Positive, so it has “Positive Skew”
  • 4.
    0–29 8 6 4 2 0 Test Result in% This particular group has lots of Low scores and has not performed well. The Mode will be to the left of the Median, and the Mean to the right. Mode < Median < Mean
  • 5.
    0–29 8 6 4 2 0 Test Result in% There are a small number of students who have done poorly, which makes this Graph stretch out horizontally to the left. Going to the Left is Negative, so it has “Negative Skew”
  • 6.
    0–29 8 6 4 2 0 Test Result in% The Kangaroo fits onto our graph with its tail going to the LEFT. Going to the Left is Negative, so it has “Negative Skew”
  • 7.
    0–29 8 6 4 2 0 Test Result in% This particular class has lots of High scores and has performed very well. The Mode will be to the right of the Median, and the Mean to the left. Mean < Median < Mode
  • 8.
    0–29 8 6 4 2 0 Test Result in% This particular class is fairly normal and has both low and high scores. This graph stretches out evenly on both sides of the Mode at 60-69. The Graph is “Symmetrical”
  • 9.
    0–29 8 6 4 2 0 Test Result in% Two identical Kangaroos show this graph is a mirror image type shape. The Graph is “Symmetrical”
  • 10.
    0–29 8 6 4 2 0 Test Result in% This particular class is fairly normal and has both low and high scores. The Mean, Median, and Mode will all be close together in the middle. Mean ~ Median ~ Mode
  • 11.
    The Kangaroo fitsonto our graph with its tail going to the RIGHT. Going to the Right is Positive, so it has “Positive Skew” Stem Leaf 0 1 1 2 4 7 8 1 2 2 3 5 6 6 8 9 2 1 5 6 7 7 8 8 9 9 9 3 2 4 4 5 7 7 8 4 1 3 5 8 5 2 3 7 6 2 3 4 7 2 6 8 3 9 2 Look at the S&L Plot sideways, and form a rotated 90 degrees view StemLeaf 0112478 122356689 21567788999 32445778 41358 5237 6234 726 83 92
  • 12.
    The Kangaroo fitsonto our graph with its tail going to the LEFT. Going to the Left is Negative, so it has “Negative Skew” Stem Leaf 0 1 1 2 2 1 5 3 2 4 8 4 1 3 5 5 2 3 7 6 2 3 4 5 6 6 7 7 7 2 2 5 5 6 7 7 7 8 8 9 8 1 3 4 4 5 6 6 7 7 7 9 2 3 4 5 6 6 7 8 StemLeaf 01 12 215 3248 4135 5237 623456677 722556777889 81344566777 923456678 Look at the S&L Plot sideways to form a rotated 90 degrees view
  • 13.
    Stem Leaf 0 12 1 2 4 6 2 1 5 6 6 3 2 4 8 8 9 4 1 3 5 6 7 7 8 5 2 3 4 5 6 6 9 9 9 6 2 3 4 5 6 6 7 7 2 2 5 5 6 8 1 3 4 7 9 2 3 5 Look from the side of the S&L Plot and form a rotated 90 degrees view StemLeaf 012 1246 21566 324889 41356778 5234566999 62345667 722556 81347 9235 Two identical Kangaroos show this graph is a mirror image type shape. The S&L Plot is “Symmetrical”
  • 14.
    SYMMETRIC RIGHT LEFT DATASKEWED SKEWED 3 7 3 58 3 0 4 36 4 013345569 4 5 5 017 5 2446 5 6 1120 6 17 6 2 7 356789 7 7 17 8 0158 8 2 8 2445 9 43 9 5 9 012235569 10 0 10 0 10 000
  • 15.