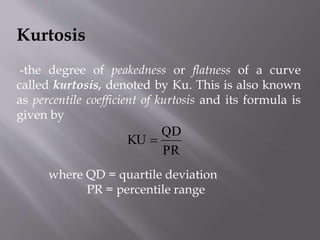
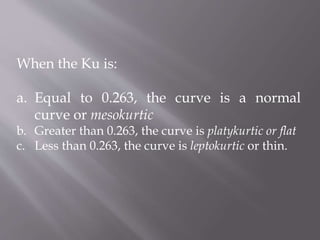
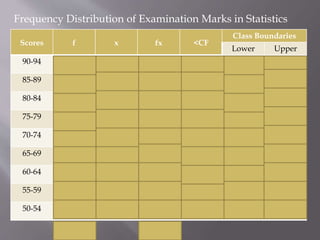
This document defines and provides formulas for kurtosis, a statistical measure of the peakedness of a distribution curve. Kurtosis values indicate whether a curve is normal/mesokurtic (Ku=0.263), flat/platykurtic (Ku>0.263), or thin/leptokurtic (Ku<0.263). It also includes an example frequency distribution of examination marks in statistics.
A basic task in numerous statistical analyses is to characterize the position and variability of a data set. Another characterization of the data includes skewness and kurtosis.
Skewness is a measure of balance, or more precisely, the lack of symmetry. A distribution, or data set, is symmetric if it looks the same to the left and right of the centre point.
Kurtosis is a measure of whether the data are heavy-tailed or light-tailed relative to a normal distribution.
In this lesson, students will be shown that it is not enough to get measures of central tendency in a data set by scrutinizing two different data sets with the same measures of central tendency. We illustrate this using data on the returns on stocks where it is not only the mean, median and mode which are the same, it is also true for other measures of location like its minimum and maximum. However, the spread of observations are different which means that to further describe the data sets we need additional measures like a measure about the dispersion of the data, i.e. range, interquartile range, variance, standard deviation, and coefficient of variation. Also, the standard deviation, as a measure of dispersion can be viewed as a measure of risk, specifically in the case of making investments in stock market. The smaller the value of the standard deviation, the smaller is the risk.
Measure of dispersion has two types Absolute measure and Graphical measure. There are other different types in there.
In this slide the discussed points are:
1. Dispersion & it's types
2. Definition
3. Use
4. Merits
5. Demerits
6. Formula & math
7. Graph and pictures
8. Real life application.
Measure of dispersion has two types Absolute measure and Graphical measure. There are other different types in there.
In this slide the discussed points are:
1. Dispersion & it's types
2. Definition
3. Use
4. Merits
5. Demerits
6. Formula & math
7. Graph and pictures
8. Real life application.
2. Kurtosis
-the degree of peakedness or flatness of a curve
called kurtosis, denoted by Ku. This is also known
as percentile coefficient of kurtosis and its formula is
given by
QD
PR
KU
where QD = quartile deviation
PR = percentile range
3. When the Ku is:
a. Equal to 0.263, the curve is a normal
curve or mesokurtic
b. Greater than 0.263, the curve is platykurtic or flat
c. Less than 0.263, the curve is leptokurtic or thin.
4. Frequency Distribution of Examination Marks in Statistics
Scores f x fx <CF
Class Boundaries
Lower Upper
90-94 1 92 92 60 89.5 94.5
85-89 4 87 348 59 84.5 89.5
80-84 3 82 246 55 79.5 84.5
75-79 8 77 616 52 74.5 79.5
70-74 20 72 1,440 44 69.5 74.5
65-69 15 67 1,005 24 64.5 69.5
60-64 7 62 434 9 59.5 64.5
55-59 1 57 57 2 54.5 59.5
50-54 1 52 52 1 49.5 54.5
N= 60 4, 290