Downloaded 191 times


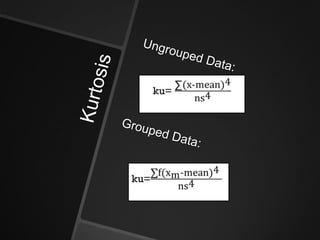
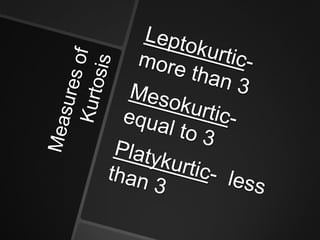


The document provides a frequency table with data missing for calculating the kurtosis of a distribution. To summarize, it asks the reader to fill in the missing data in the frequency table, then calculate the kurtosis to determine if the distribution is leptokurtic (peaked more than normal), mesokurtic (normal peakedness), or platykurtic (flatter than normal).


