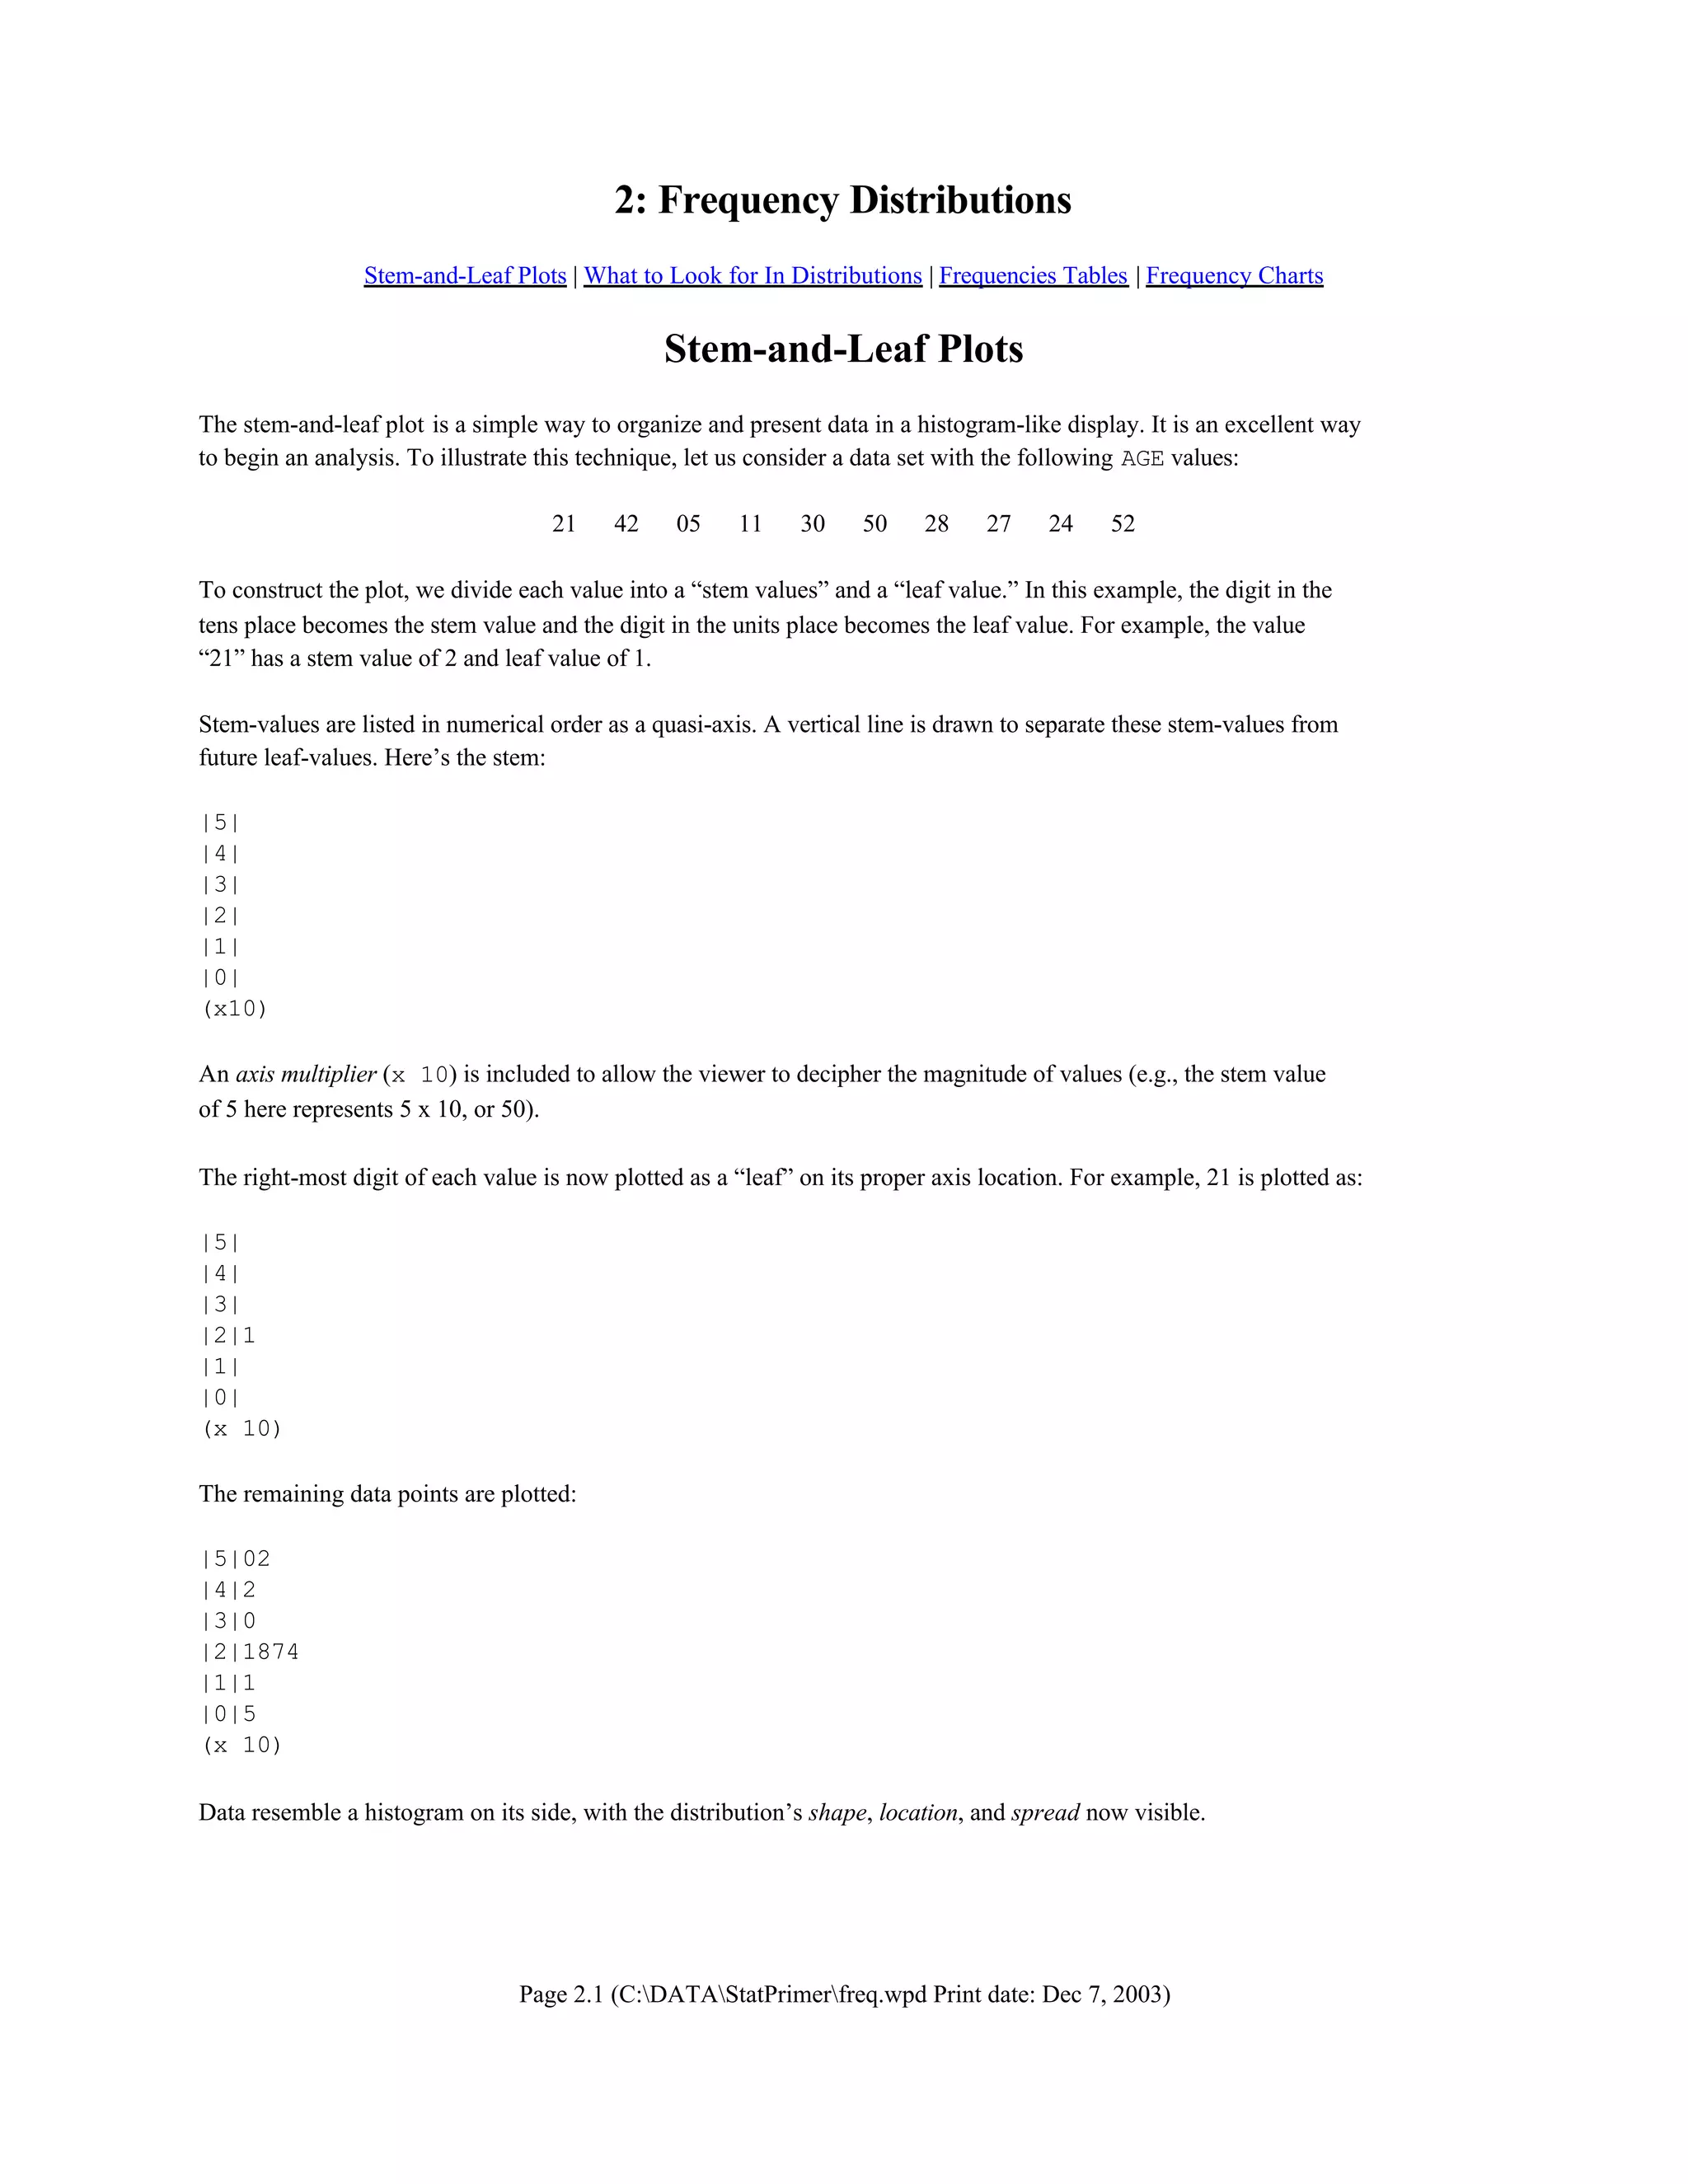
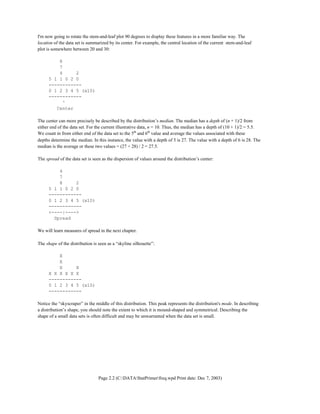
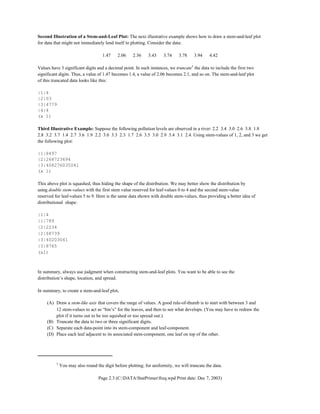
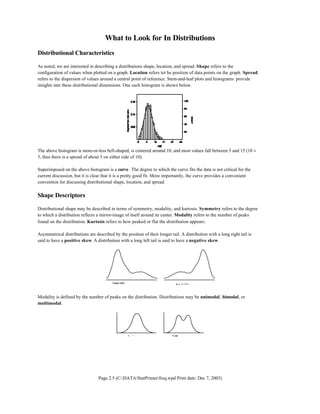
This document provides instructions for creating and interpreting stem-and-leaf plots. It explains that stem-and-leaf plots organize data into "stems" and "leaves" to display the shape, center, and spread of a distribution similar to a histogram. The document includes three examples of constructing stem-and-leaf plots from different data sets and discusses how to interpret the plots, including identifying the median. It also briefly describes how to create frequency tables from raw data.
![Page 2.7 (C:DATAStatPrimerfreq.wpd Print date: Dec 7, 2003)
Frequency Tables
Frequency Tables For Raw Data
A common way to begin an analysis to count frequencies of values. There are three different types of frequencies:
Frequency counts (fi): The number of times a value occurs in a data set.
Relative frequencies (pi) : Frequency counts expressed as percentages of the total.
Cumulative [relative] frequencies (ci): Relative frequencies up to and including the current rank-ordered value.
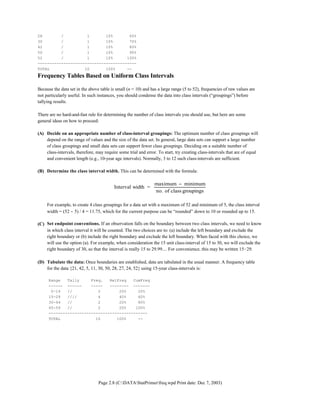
An example of a frequency table of ages from a large survey is:
AGE | Freq Rel.Freq Cum.Freq.
------+-----------------------
3 | 2 0.3% 0.3%
4 | 9 1.4% 1.7%
5 | 28 4.3% 6.0%
6 | 37 5.7% 11.6%
7 | 54 8.3% 19.9%
8 | 85 13.0% 32.9%
9 | 94 14.4% 47.2%
10 | 81 12.4% 59.6%
11 | 90 13.8% 73.4%
12 | 57 8.7% 82.1%
13 | 43 6.6% 88.7%
14 | 25 3.8% 92.5%
15 | 19 2.9% 95.4%
16 | 13 2.0% 97.4%
17 | 8 1.2% 98.6%
18 | 6 0.9% 99.5%
19 | 3 0.5% 100.0%
------+-----------------------
Total | 654 100.0%
Notice how the frequency column sums to n and the relative frequency column sums to 100%.
To construct a frequency table for raw data:
(A) List all value in ascending order. (If a value appears more than once, list it once only. You’ll tally
frequencies as a separate step.)
(B) Tally frequencies (fi) with tick marks or some other accounting mechanism. List this information in the
Freq column of the table.
(C) Sum the frequency counts to determine the total sample size: n = Σfi
(D) Calculate the relative frequency (pi) of each value as the proportion of the total: pi = fi / n.
(E) Determine cumulative frequencies (ci) by adding the cumulative frequency from the prior level to the
relative frequency of the current level (ci = pi + ci−1).
A frequency table for the small data set {21, 42, 5, 11, 30, 50, 28, 27, 24, 52} is:
Value Tally Freq. RelFreq CumFreq
------ ------ ----- -------- -------
5 / 1 10% 10%
11 / 1 10% 20%
21 / 1 10% 30%
24 / 1 10% 40%
27 / 1 10% 50%](https://image.slidesharecdn.com/3-150220110044-conversion-gate02/85/3-frequency-distribution-7-320.jpg)