Downloaded 192 times
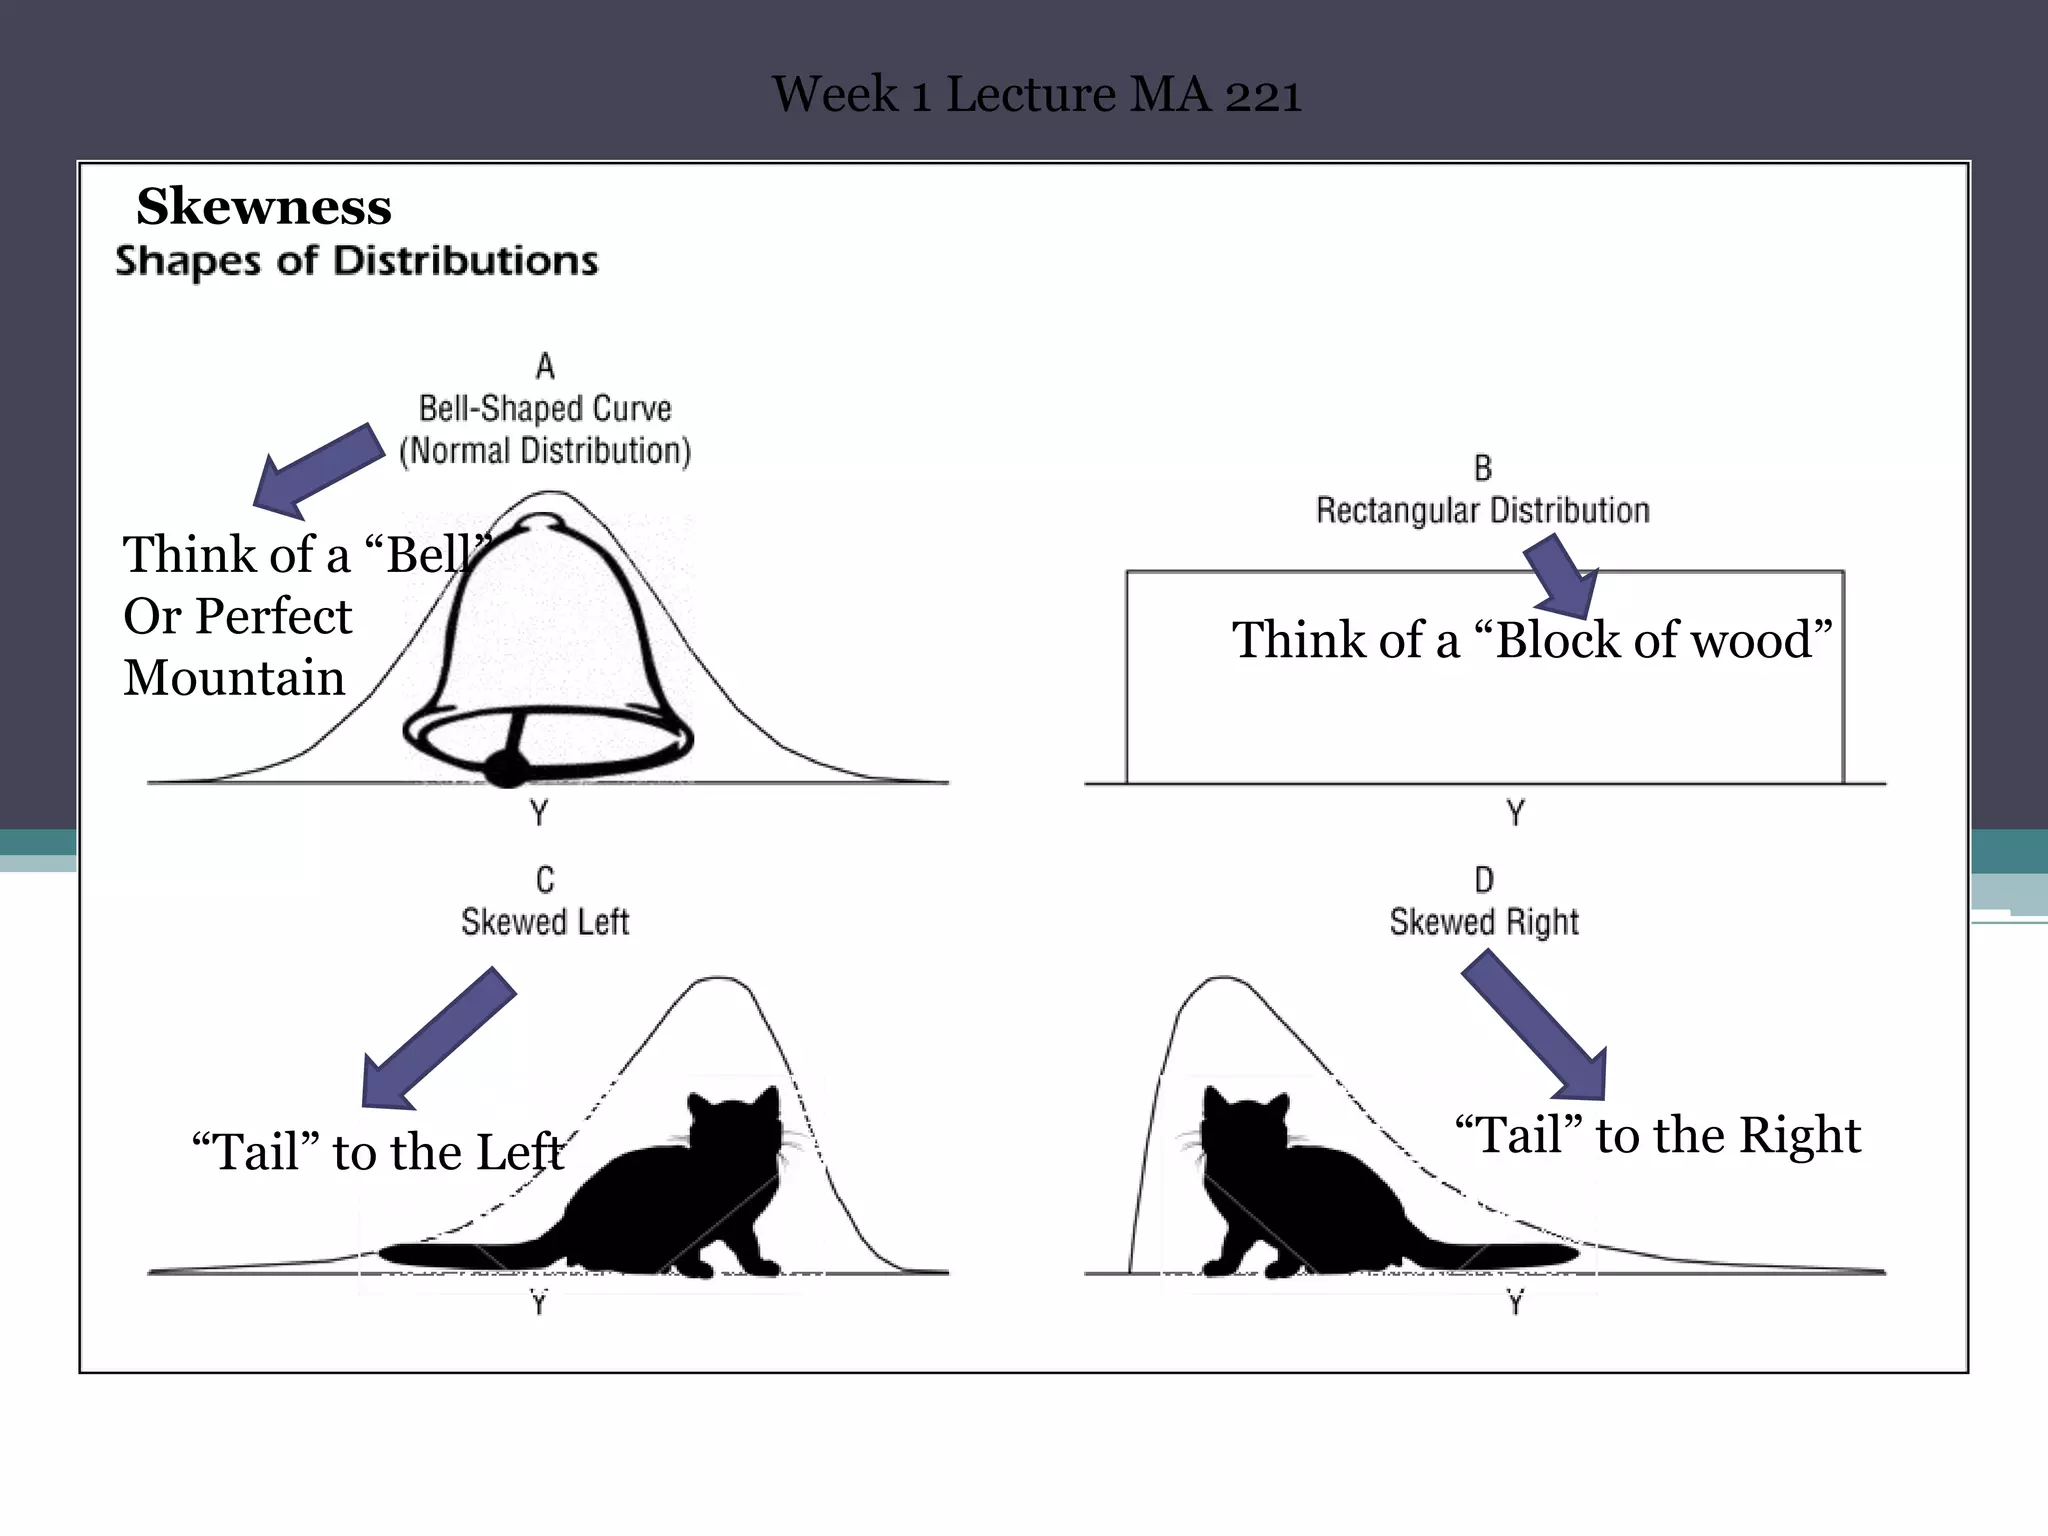
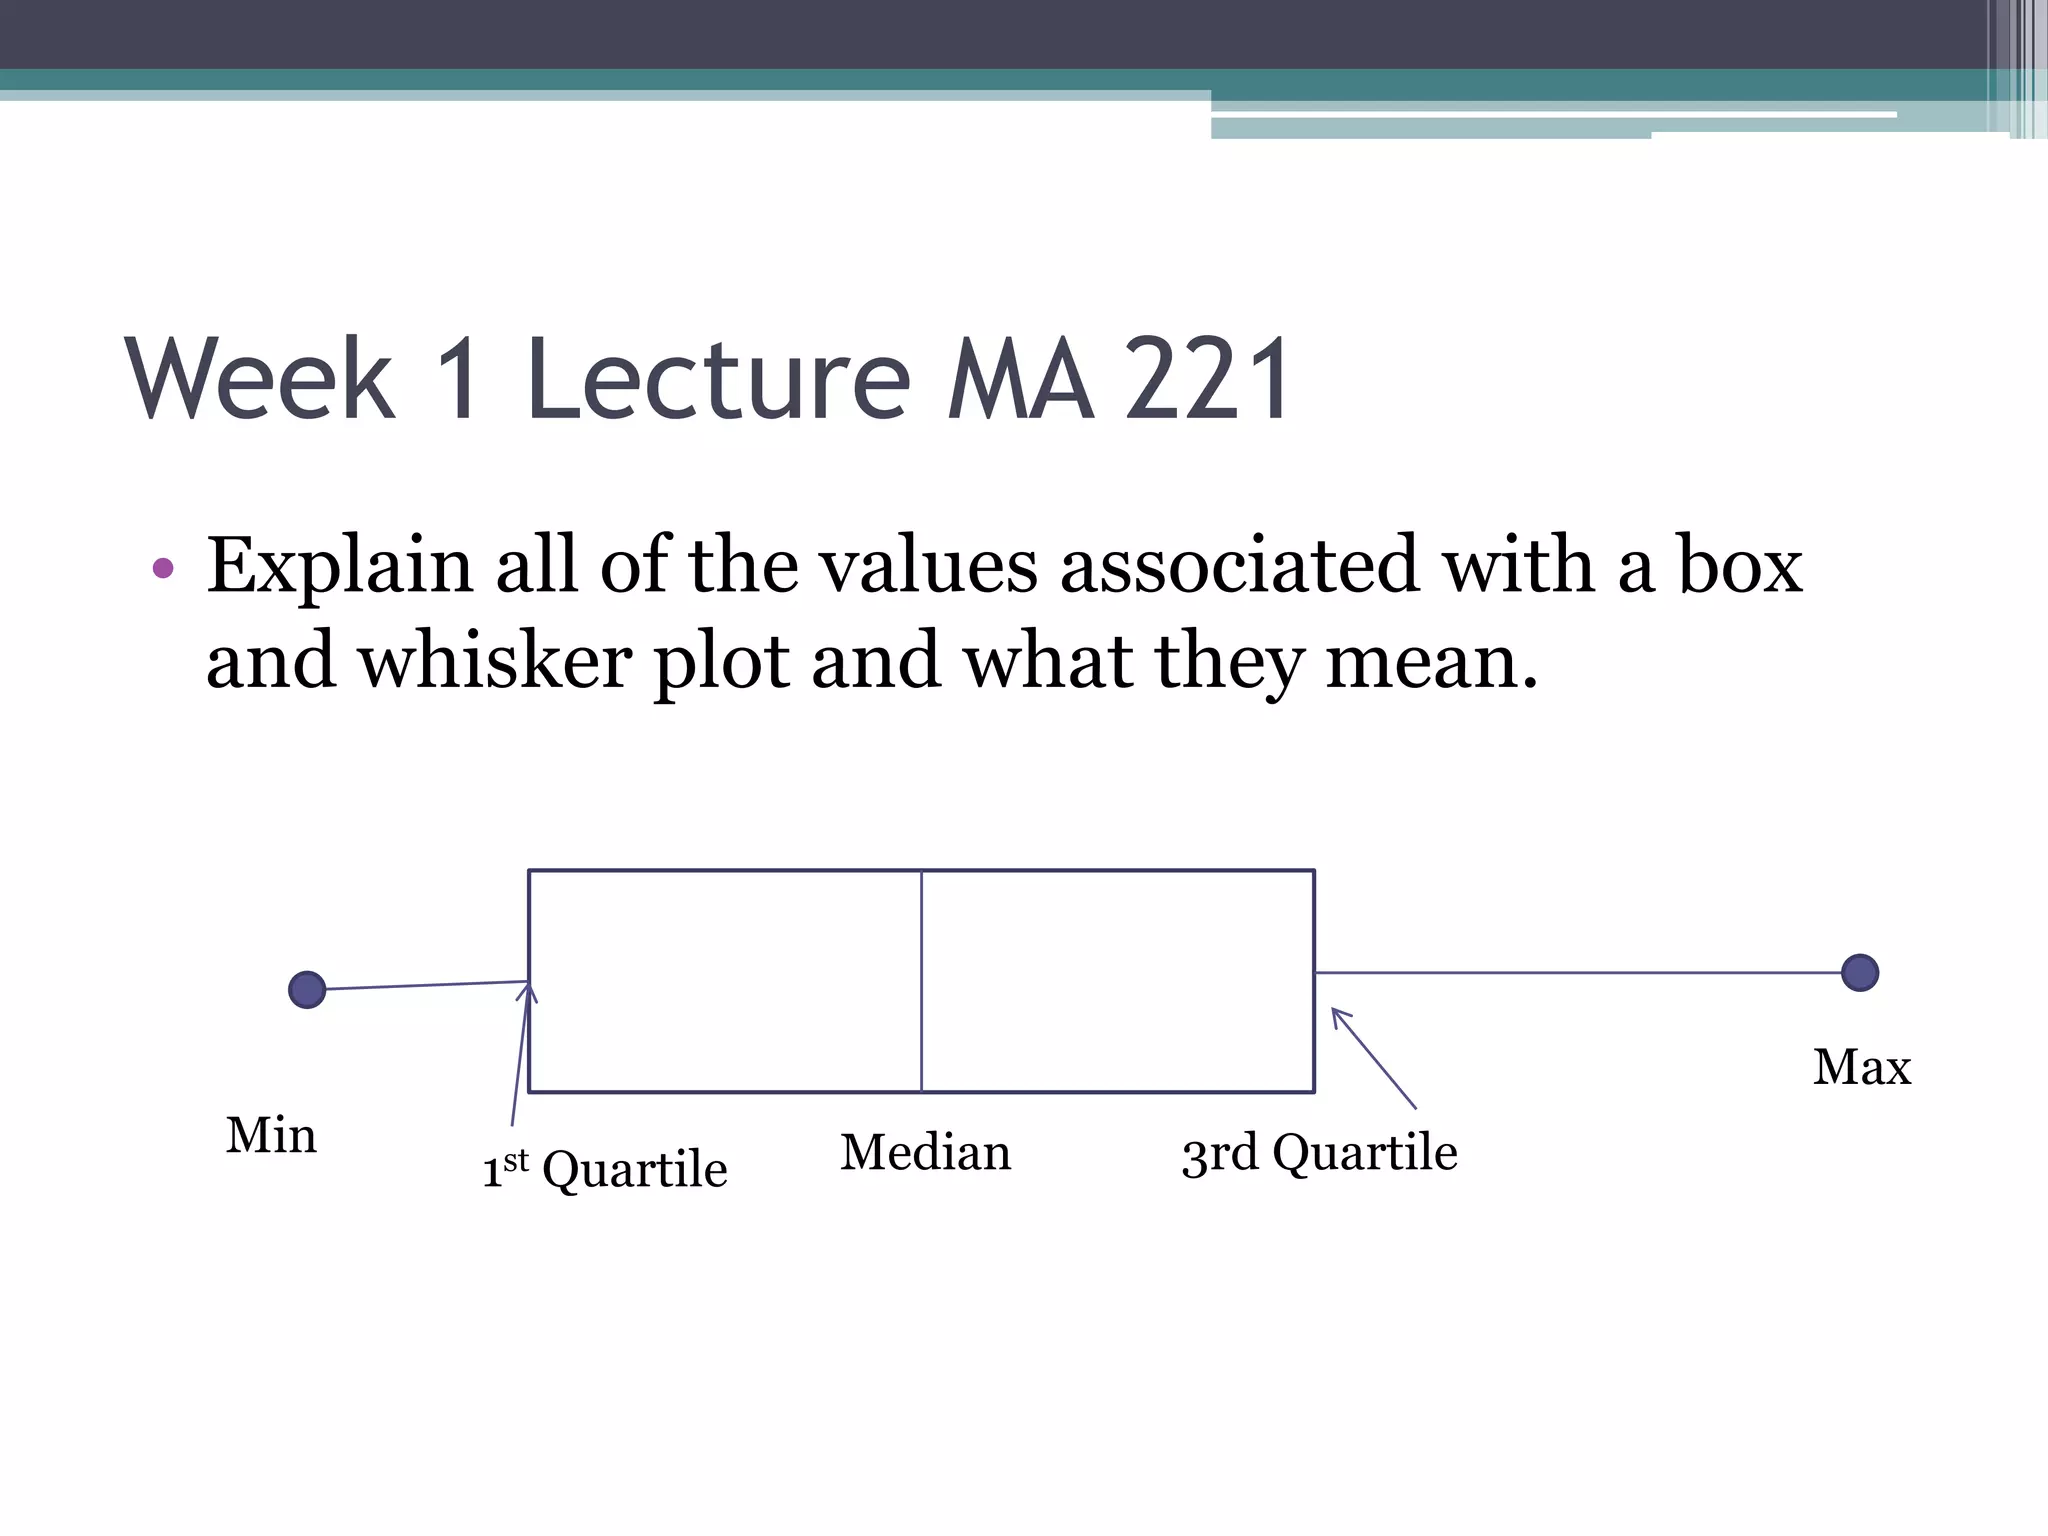


This document contains the notes from Week 1 of a statistics lecture for MA 221. It includes definitions of key statistical concepts like population vs. sample, parameter vs. statistic, qualitative vs. quantitative variables, and levels of measurement. It also provides examples of determining these classifications and describes different data collection methods. The document explains measures of center, range, mean, standard deviation, and the empirical rule. It defines terms associated with a box and whisker plot and z-scores.