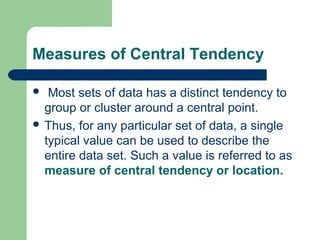
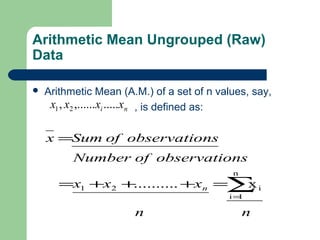
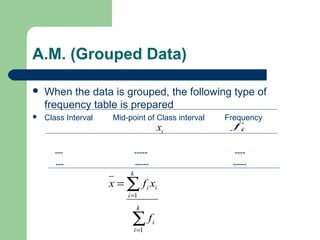
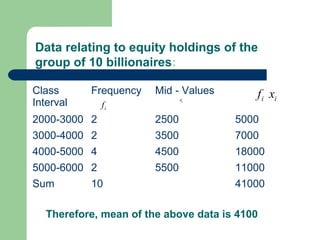
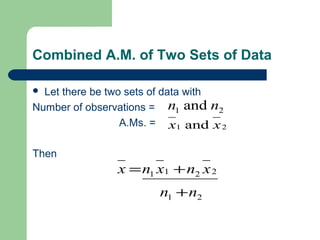
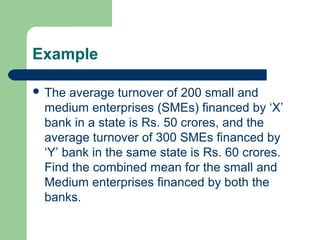
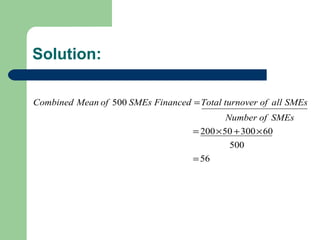
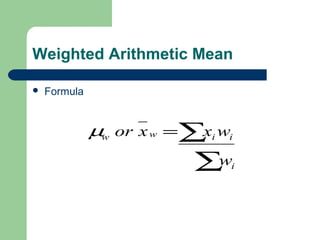
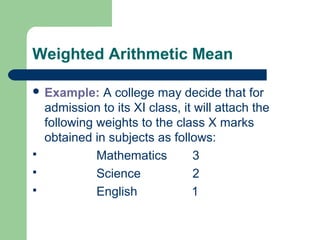
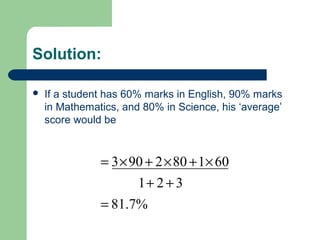
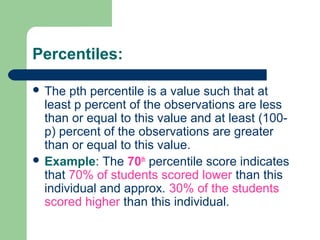
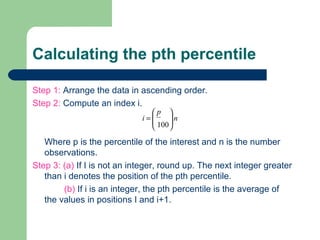
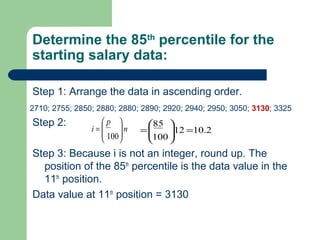
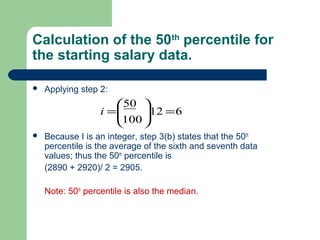
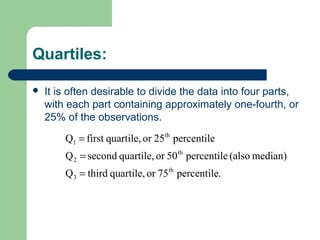
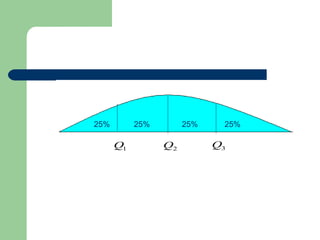
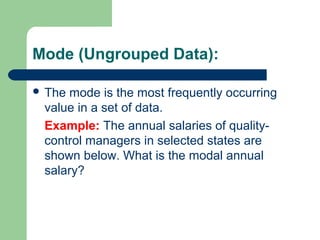
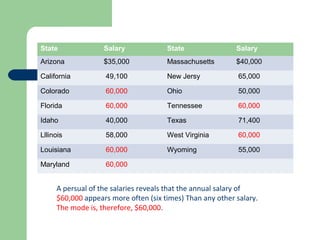
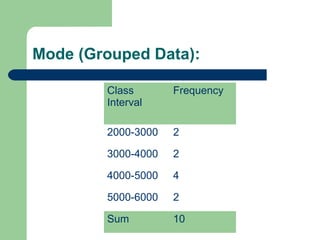
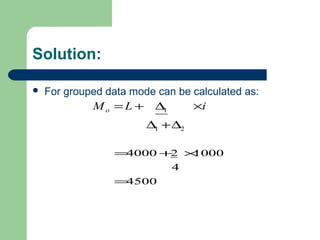
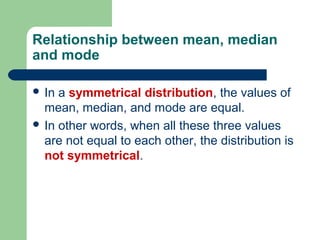
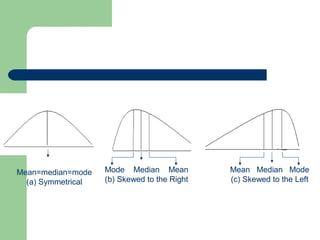
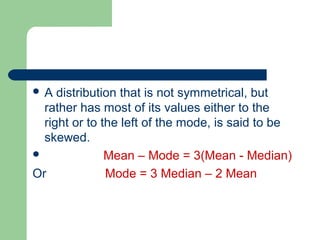
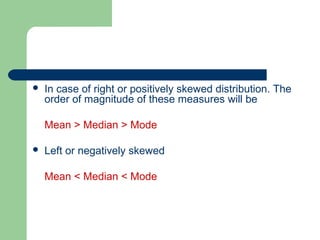
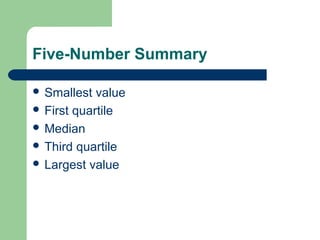
SUMMARY MEASURES
Measures of Central
Tendency
Measures of Central Tendency
 Most sets of data has a distinct tendency to
group or cluster around a central point.
 Thus, for any particular set of data, a single
typical value can be used to describe the
entire data set. Such a value is referred to as
measure of central tendency or location.
Objectives of Averaging
 To get single value that describes the
characteristic of the entire group.
 To facilitate comparison.
Measures of Central Tendency
 Arithmetic Mean
 Median, Quartiles, Percentiles and Deciles
 Mode
Arithmetic Mean Ungrouped (Raw)
Data
 Arithmetic Mean (A.M.) of a set of n values, say,
, is defined as:ni xxxx .....,......, 21
nn
xxx
nsobservatioofNumber
nsobservatioofSumx
n x..........
n
1i
i21 ∑=
=+++=
=
Example:
 The data (next slide) gives value of equity holdings
of 10 of the India’s billionaires.
Name Equity Holdings (Millions of Rs.)
Kiran Mazumdar-Shaw 2717
The Nilekani family 2796
The Punj family 3098
K.K. Birla 3534
The Murthi family 4310
Keshub Mahindra 4506
The Kirloskar family 4745
Ajay G. Piramal 4923
S.P. Hinduja 5071
Uday Kotak 5034
Solution
4073.4
10
40734
10
5034.........27962717
=
=
+++=
x
x
“The sum of deviations of all the observations from A.M.
is equal to zero.”
The productivity of employees in banks, as measured by
“business per employee” for three banks, for the year 2005 –
2006, are given as follows:
Bank No. of
Employees
Business per
Employee
Total Business
Bank of
Baroda
38737 396 15339852
Bank of
India
41808 381 15928848
Corporation
Bank
10754 527 5667358
Sum 91299 1304 36936058
Solution:
404.6
91299
36936058
banksthreein theEmployeesofNumberTotal
Banksthreein theBusinessTotalemployeeperAverage
=
=
=
A.M. (Grouped Data)
 When the data is grouped, the following type of
frequency table is prepared
 Class Interval Mid-point of Class interval Frequency
--- ----- ----
--- ----- -----
ix if
∑
∑
=
=
=
k
i
i
k
i
ii
f
xfx
1
1
ix
Class
Interval
Frequency Mid - Values
2000-3000 2 2500 5000
3000-4000 2 3500 7000
4000-5000 4 4500 18000
5000-6000 2 5500 11000
Sum 10 41000
ix
if
if
Data relating to equity holdings of the
group of 10 billionaires:
Therefore, mean of the above data is 4100
Combined A.M. of Two Sets of Data
 Let there be two sets of data with
Number of observations =
A.Ms. =
Then
21 and nn
21 and xx
21
2211
nn
xnxnx
+
+=
Example
 The average turnover of 200 small and
medium enterprises (SMEs) financed by ‘X’
bank in a state is Rs. 50 crores, and the
average turnover of 300 SMEs financed by
‘Y’ bank in the same state is Rs. 60 crores.
Find the combined mean for the small and
Medium enterprises financed by both the
banks.
Solution:
56
500
6030050200
500
=
×+×=
=
SMEsofNumber
SMEsallofturnoverTotalFinancedSMEsofMeanCombined
Weighted Arithmetic Mean
 Formula
∑
∑=
i
iiww
w
wxxorµ
Weighted Arithmetic Mean
 Example: A college may decide that for
admission to its XI class, it will attach the
following weights to the class X marks
obtained in subjects as follows:
 Mathematics 3
 Science 2
 English 1
Solution:
 If a student has 60% marks in English, 90% marks
in Mathematics, and 80% in Science, his ‘average’
score would be
%7.81
321
601802903
=
++
×+×+×=
MEDIAN (Ungrouped Data)
 The median is the value in the middle when
data is arranged in ascending order.
MEDIAN
Arrange the data in ascending order (smallest value to largest value)
(a)For an odd number of observations the median is the middle
value.
(b) For an even number of observations, the median is the average
of two middle values.
MEDIAN
Arrange the data in ascending order (smallest value to largest value)
(a)For an odd number of observations the median is the middle
value.
(b) For an even number of observations, the median is the average
of two middle values.
Table: 2
 Monthly starting salaries for a sample of 12
Business School Graduates.
Graduate Monthly Starting
Salary ($)
Graduate Monthly Starting
Salary ($)
1 2850 7 2890
2 2950 8 3130
3 3050 9 2940
4 2880 10 3325
5 2755 11 2920
6 2710 12 2880
We first arrange the data in ascending order.
2710; 2755; 2850; 2880; 2880; 2890; 2920; 2940; 2950; 3050; 3130; 3325
Because n = 12 is even, we identify the middle two values:
2890 and 2920. The median is the average of these values.
Median =
Middle two values
2
290529202890 =+
Median (Grouped Data)
 The median for the grouped data can be
calculated from the following formula:
f
ipcfNLMedian -2/ ×+=
ixClass
Interval
Frequency Cumulative
Frequency
2000-3000 2 2
3000-4000 2 4
4000-5000 4 8
5000-6000 2 10
Sum 10
if
Data relating to equity holdings of the
group of 10 billionaires:
Solution
f
ipcfNLMedian -2/ ×+=
4250
4
1000454000
52/102/
=
×−+=
==
Median
N
Percentiles:
 The pth percentile is a value such that at
least p percent of the observations are less
than or equal to this value and at least (100-
p) percent of the observations are greater
than or equal to this value.
 Example: The 70th
percentile score indicates
that 70% of students scored lower than this
individual and approx. 30% of the students
scored higher than this individual.
Calculating the pth percentile
Step 1: Arrange the data in ascending order.
Step 2: Compute an index i.
Where p is the percentile of the interest and n is the number
observations.
Step 3: (a) If I is not an integer, round up. The next integer greater
than i denotes the position of the pth percentile.
(b) If i is an integer, the pth percentile is the average of
the values in positions I and i+1.
n
p
i
100







=
Determine the 85th
percentile for the
starting salary data:
Step 1: Arrange the data in ascending order.
Step 2:
Step 3: Because i is not an integer, round up. The
position of the 85th
percentile is the data value in the
11th
position.
Data value at 11th
position = 3130
100
n
p
i 







=
2710; 2755; 2850; 2880; 2880; 2890; 2920; 2940; 2950; 3050; 3130; 3325
2.1012
100
85
=





=
Calculation of the 50th
percentile for
the starting salary data.
 Applying step 2:
 Because I is an integer, step 3(b) states that the 50th
percentile is the average of the sixth and seventh data
values; thus the 50th
percentile is
(2890 + 2920)/ 2 = 2905.
Note: 50th
percentile is also the median.
612
100
50
=





=i
Quartiles:
 It is often desirable to divide the data into four parts,
with each part containing approximately one-fourth, or
25% of the observations.
.percentile75orquartile,thirdQ
median)(alsopercentile50orquartile,secondQ
percentile25orquartile,firstQ
th
3
th
2
th
1
=
=
=
25% 25% 25% 25%
1Q 2Q 3Q
Computation of first and third quartiles
Since i is an integer. Therefore,
100
Q1
n
p
i
For








= 312
100
25
=





=
30002/)30502950(
28652/)28802850(
3
1
=+=
=+=
Q
Q
2710; 2755; 2850; 2880; 2880; 2890; 2920; 2940; 2950; 3050; 3130; 3325
29052 =Q 30003 =Q28651 =Q
Median
Mode (Ungrouped Data):
 The mode is the most frequently occurring
value in a set of data.
Example: The annual salaries of quality-
control managers in selected states are
shown below. What is the modal annual
salary?
State Salary State Salary
Arizona $35,000 Massachusetts $40,000
California 49,100 New Jersy 65,000
Colorado 60,000 Ohio 50,000
Florida 60,000 Tennessee 60,000
Idaho 40,000 Texas 71,400
Lllinois 58,000 West Virginia 60,000
Louisiana 60,000 Wyoming 55,000
Maryland 60,000
A persual of the salaries reveals that the annual salary of
$60,000 appears more often (six times) Than any other salary.
The mode is, therefore, $60,000.
Mode (Grouped Data):
Class
Interval
Frequency
2000-3000 2
3000-4000 2
4000-5000 4
5000-6000 2
Sum 10
Solution:
 For grouped data mode can be calculated as:
21
1
∆+∆
×∆+= iLMo
4500
4
100024000
=
×+=
Relationship between mean, median
and mode
 In a symmetrical distribution, the values of
mean, median, and mode are equal.
 In other words, when all these three values
are not equal to each other, the distribution is
not symmetrical.
Mean=median=mode
(a) Symmetrical
Mode Median Mean
(b) Skewed to the Right
Mean Median Mode
(c) Skewed to the Left
 A distribution that is not symmetrical, but
rather has most of its values either to the
right or to the left of the mode, is said to be
skewed.
 Mean – Mode = 3(Mean - Median)
Or Mode = 3 Median – 2 Mean
 In case of right or positively skewed distribution. The
order of magnitude of these measures will be
Mean > Median > Mode
 Left or negatively skewed
Mean < Median < Mode
Five-Number Summary
 Smallest value
 First quartile
 Median
 Third quartile
 Largest value

Summary measures

  • 1.
  • 2.
    Measures of CentralTendency  Most sets of data has a distinct tendency to group or cluster around a central point.  Thus, for any particular set of data, a single typical value can be used to describe the entire data set. Such a value is referred to as measure of central tendency or location.
  • 3.
    Objectives of Averaging To get single value that describes the characteristic of the entire group.  To facilitate comparison.
  • 4.
    Measures of CentralTendency  Arithmetic Mean  Median, Quartiles, Percentiles and Deciles  Mode
  • 5.
    Arithmetic Mean Ungrouped(Raw) Data  Arithmetic Mean (A.M.) of a set of n values, say, , is defined as:ni xxxx .....,......, 21 nn xxx nsobservatioofNumber nsobservatioofSumx n x.......... n 1i i21 ∑= =+++= =
  • 6.
    Example:  The data(next slide) gives value of equity holdings of 10 of the India’s billionaires.
  • 7.
    Name Equity Holdings(Millions of Rs.) Kiran Mazumdar-Shaw 2717 The Nilekani family 2796 The Punj family 3098 K.K. Birla 3534 The Murthi family 4310 Keshub Mahindra 4506 The Kirloskar family 4745 Ajay G. Piramal 4923 S.P. Hinduja 5071 Uday Kotak 5034
  • 8.
    Solution 4073.4 10 40734 10 5034.........27962717 = = +++= x x “The sum ofdeviations of all the observations from A.M. is equal to zero.”
  • 9.
    The productivity ofemployees in banks, as measured by “business per employee” for three banks, for the year 2005 – 2006, are given as follows: Bank No. of Employees Business per Employee Total Business Bank of Baroda 38737 396 15339852 Bank of India 41808 381 15928848 Corporation Bank 10754 527 5667358 Sum 91299 1304 36936058
  • 10.
  • 11.
    A.M. (Grouped Data) When the data is grouped, the following type of frequency table is prepared  Class Interval Mid-point of Class interval Frequency --- ----- ---- --- ----- ----- ix if ∑ ∑ = = = k i i k i ii f xfx 1 1
  • 12.
    ix Class Interval Frequency Mid -Values 2000-3000 2 2500 5000 3000-4000 2 3500 7000 4000-5000 4 4500 18000 5000-6000 2 5500 11000 Sum 10 41000 ix if if Data relating to equity holdings of the group of 10 billionaires: Therefore, mean of the above data is 4100
  • 13.
    Combined A.M. ofTwo Sets of Data  Let there be two sets of data with Number of observations = A.Ms. = Then 21 and nn 21 and xx 21 2211 nn xnxnx + +=
  • 14.
    Example  The averageturnover of 200 small and medium enterprises (SMEs) financed by ‘X’ bank in a state is Rs. 50 crores, and the average turnover of 300 SMEs financed by ‘Y’ bank in the same state is Rs. 60 crores. Find the combined mean for the small and Medium enterprises financed by both the banks.
  • 15.
  • 16.
    Weighted Arithmetic Mean Formula ∑ ∑= i iiww w wxxorµ
  • 17.
    Weighted Arithmetic Mean Example: A college may decide that for admission to its XI class, it will attach the following weights to the class X marks obtained in subjects as follows:  Mathematics 3  Science 2  English 1
  • 18.
    Solution:  If astudent has 60% marks in English, 90% marks in Mathematics, and 80% in Science, his ‘average’ score would be %7.81 321 601802903 = ++ ×+×+×=
  • 19.
    MEDIAN (Ungrouped Data) The median is the value in the middle when data is arranged in ascending order. MEDIAN Arrange the data in ascending order (smallest value to largest value) (a)For an odd number of observations the median is the middle value. (b) For an even number of observations, the median is the average of two middle values. MEDIAN Arrange the data in ascending order (smallest value to largest value) (a)For an odd number of observations the median is the middle value. (b) For an even number of observations, the median is the average of two middle values.
  • 20.
    Table: 2  Monthlystarting salaries for a sample of 12 Business School Graduates. Graduate Monthly Starting Salary ($) Graduate Monthly Starting Salary ($) 1 2850 7 2890 2 2950 8 3130 3 3050 9 2940 4 2880 10 3325 5 2755 11 2920 6 2710 12 2880
  • 21.
    We first arrangethe data in ascending order. 2710; 2755; 2850; 2880; 2880; 2890; 2920; 2940; 2950; 3050; 3130; 3325 Because n = 12 is even, we identify the middle two values: 2890 and 2920. The median is the average of these values. Median = Middle two values 2 290529202890 =+
  • 22.
    Median (Grouped Data) The median for the grouped data can be calculated from the following formula: f ipcfNLMedian -2/ ×+=
  • 23.
    ixClass Interval Frequency Cumulative Frequency 2000-3000 22 3000-4000 2 4 4000-5000 4 8 5000-6000 2 10 Sum 10 if Data relating to equity holdings of the group of 10 billionaires:
  • 24.
  • 25.
    Percentiles:  The pthpercentile is a value such that at least p percent of the observations are less than or equal to this value and at least (100- p) percent of the observations are greater than or equal to this value.  Example: The 70th percentile score indicates that 70% of students scored lower than this individual and approx. 30% of the students scored higher than this individual.
  • 26.
    Calculating the pthpercentile Step 1: Arrange the data in ascending order. Step 2: Compute an index i. Where p is the percentile of the interest and n is the number observations. Step 3: (a) If I is not an integer, round up. The next integer greater than i denotes the position of the pth percentile. (b) If i is an integer, the pth percentile is the average of the values in positions I and i+1. n p i 100        =
  • 27.
    Determine the 85th percentilefor the starting salary data: Step 1: Arrange the data in ascending order. Step 2: Step 3: Because i is not an integer, round up. The position of the 85th percentile is the data value in the 11th position. Data value at 11th position = 3130 100 n p i         = 2710; 2755; 2850; 2880; 2880; 2890; 2920; 2940; 2950; 3050; 3130; 3325 2.1012 100 85 =      =
  • 28.
    Calculation of the50th percentile for the starting salary data.  Applying step 2:  Because I is an integer, step 3(b) states that the 50th percentile is the average of the sixth and seventh data values; thus the 50th percentile is (2890 + 2920)/ 2 = 2905. Note: 50th percentile is also the median. 612 100 50 =      =i
  • 29.
    Quartiles:  It isoften desirable to divide the data into four parts, with each part containing approximately one-fourth, or 25% of the observations. .percentile75orquartile,thirdQ median)(alsopercentile50orquartile,secondQ percentile25orquartile,firstQ th 3 th 2 th 1 = = =
  • 30.
    25% 25% 25%25% 1Q 2Q 3Q
  • 31.
    Computation of firstand third quartiles Since i is an integer. Therefore, 100 Q1 n p i For         = 312 100 25 =      = 30002/)30502950( 28652/)28802850( 3 1 =+= =+= Q Q
  • 32.
    2710; 2755; 2850;2880; 2880; 2890; 2920; 2940; 2950; 3050; 3130; 3325 29052 =Q 30003 =Q28651 =Q Median
  • 33.
    Mode (Ungrouped Data): The mode is the most frequently occurring value in a set of data. Example: The annual salaries of quality- control managers in selected states are shown below. What is the modal annual salary?
  • 34.
    State Salary StateSalary Arizona $35,000 Massachusetts $40,000 California 49,100 New Jersy 65,000 Colorado 60,000 Ohio 50,000 Florida 60,000 Tennessee 60,000 Idaho 40,000 Texas 71,400 Lllinois 58,000 West Virginia 60,000 Louisiana 60,000 Wyoming 55,000 Maryland 60,000 A persual of the salaries reveals that the annual salary of $60,000 appears more often (six times) Than any other salary. The mode is, therefore, $60,000.
  • 35.
    Mode (Grouped Data): Class Interval Frequency 2000-30002 3000-4000 2 4000-5000 4 5000-6000 2 Sum 10
  • 36.
    Solution:  For groupeddata mode can be calculated as: 21 1 ∆+∆ ×∆+= iLMo 4500 4 100024000 = ×+=
  • 37.
    Relationship between mean,median and mode  In a symmetrical distribution, the values of mean, median, and mode are equal.  In other words, when all these three values are not equal to each other, the distribution is not symmetrical.
  • 38.
    Mean=median=mode (a) Symmetrical Mode MedianMean (b) Skewed to the Right Mean Median Mode (c) Skewed to the Left
  • 39.
     A distributionthat is not symmetrical, but rather has most of its values either to the right or to the left of the mode, is said to be skewed.  Mean – Mode = 3(Mean - Median) Or Mode = 3 Median – 2 Mean
  • 40.
     In caseof right or positively skewed distribution. The order of magnitude of these measures will be Mean > Median > Mode  Left or negatively skewed Mean < Median < Mode
  • 41.
    Five-Number Summary  Smallestvalue  First quartile  Median  Third quartile  Largest value