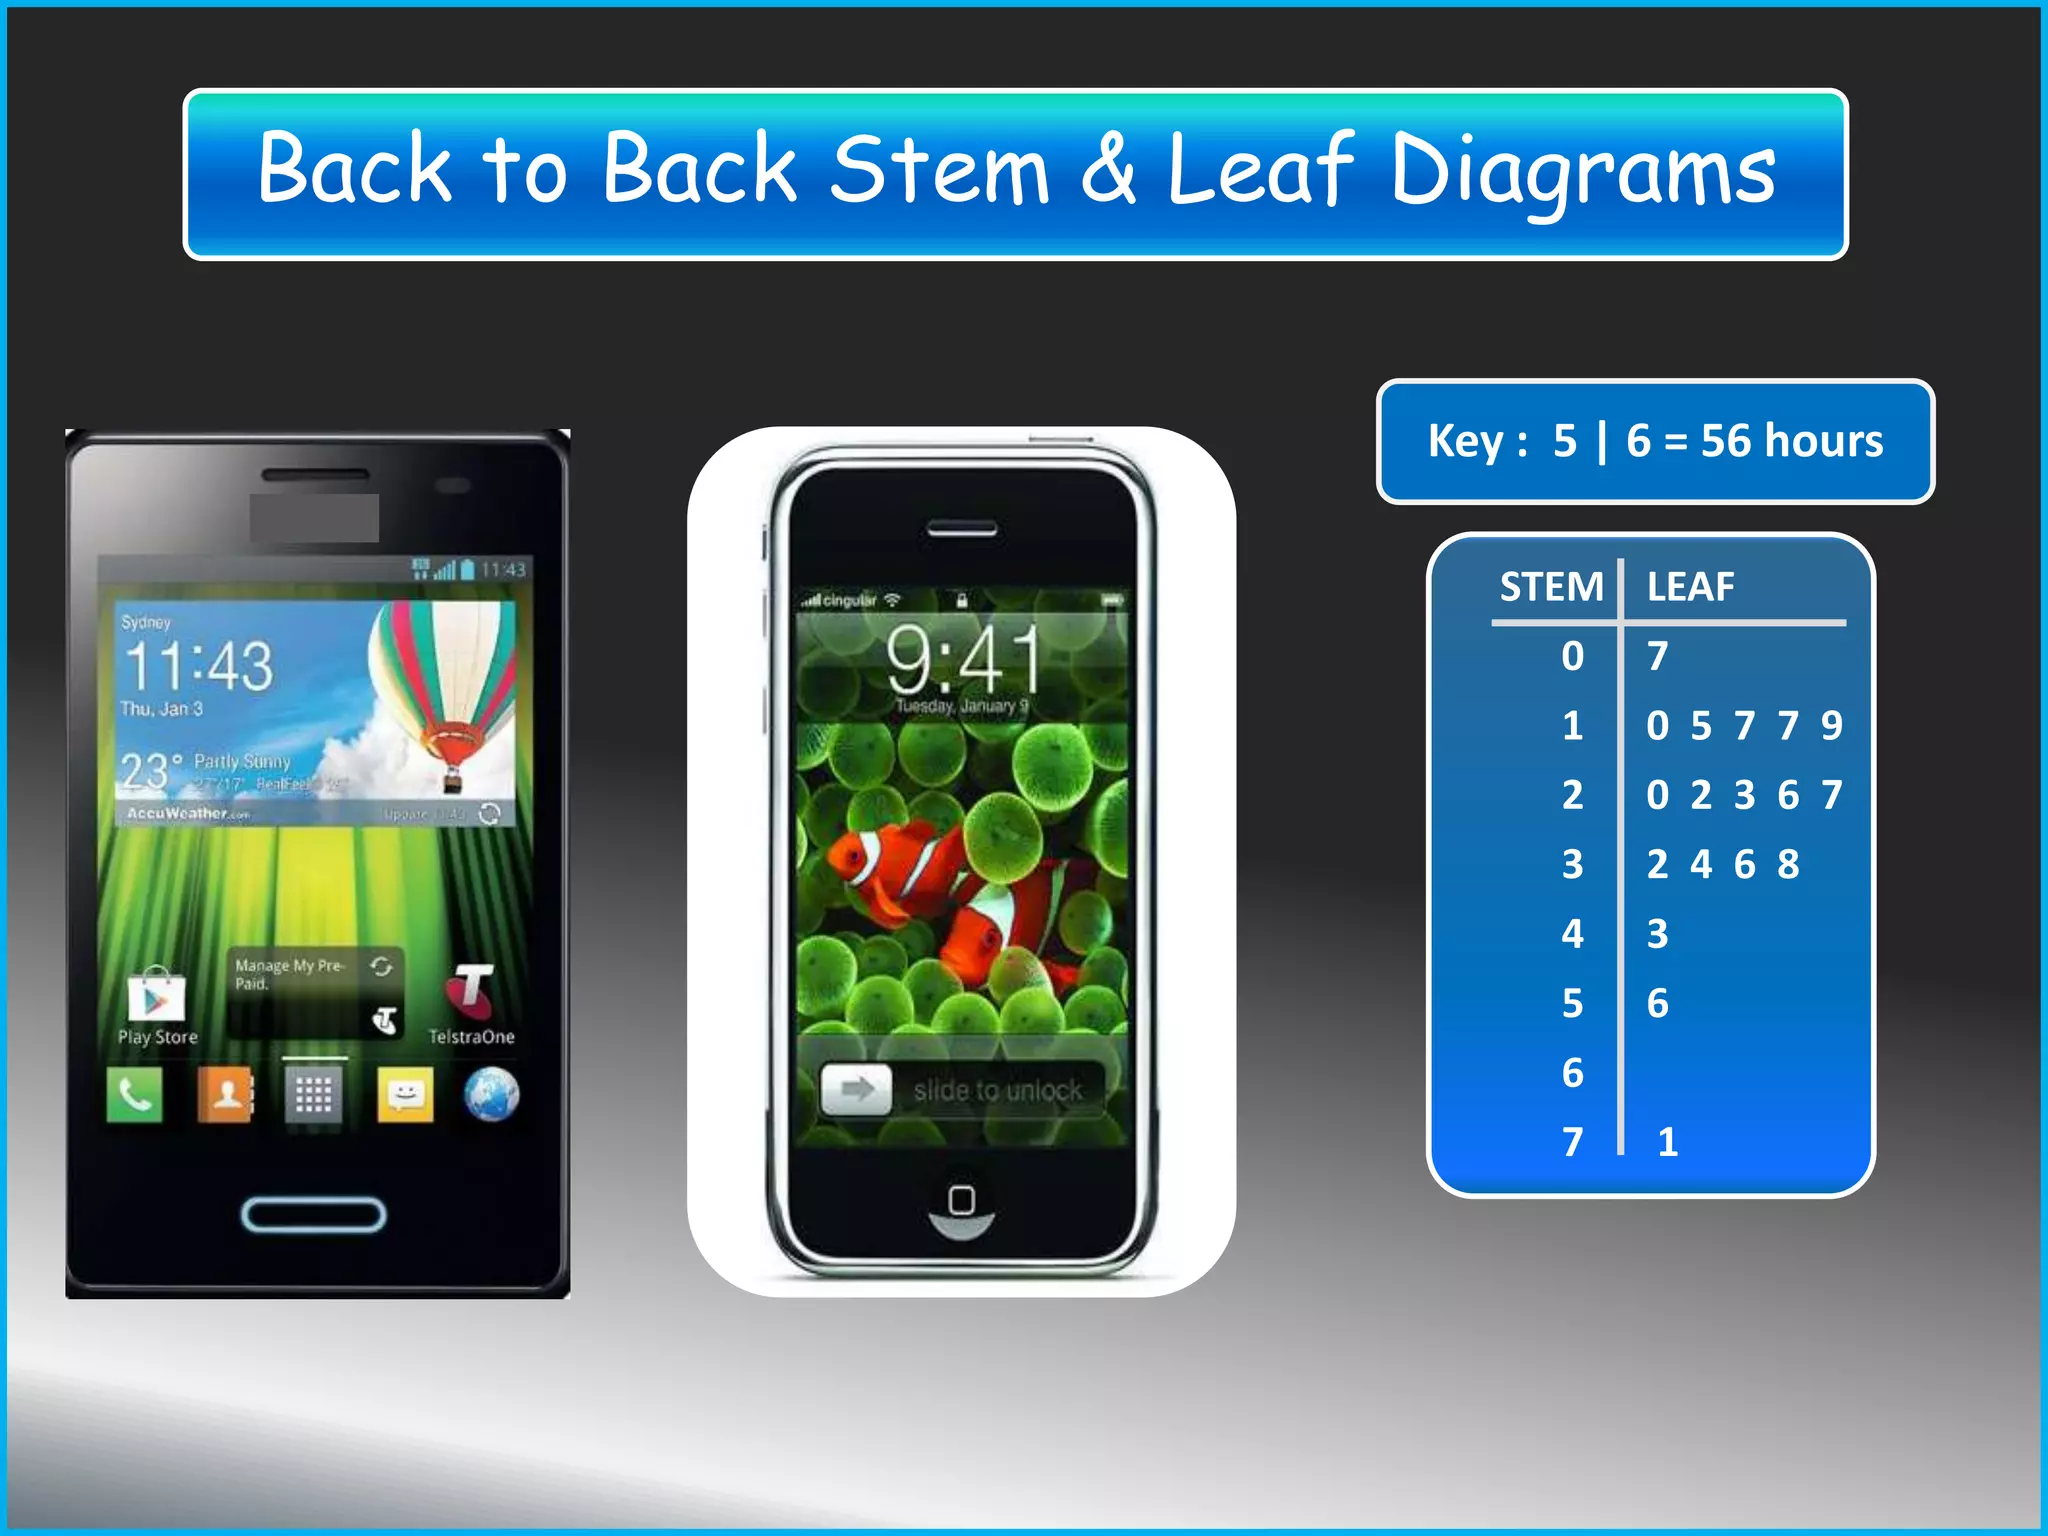
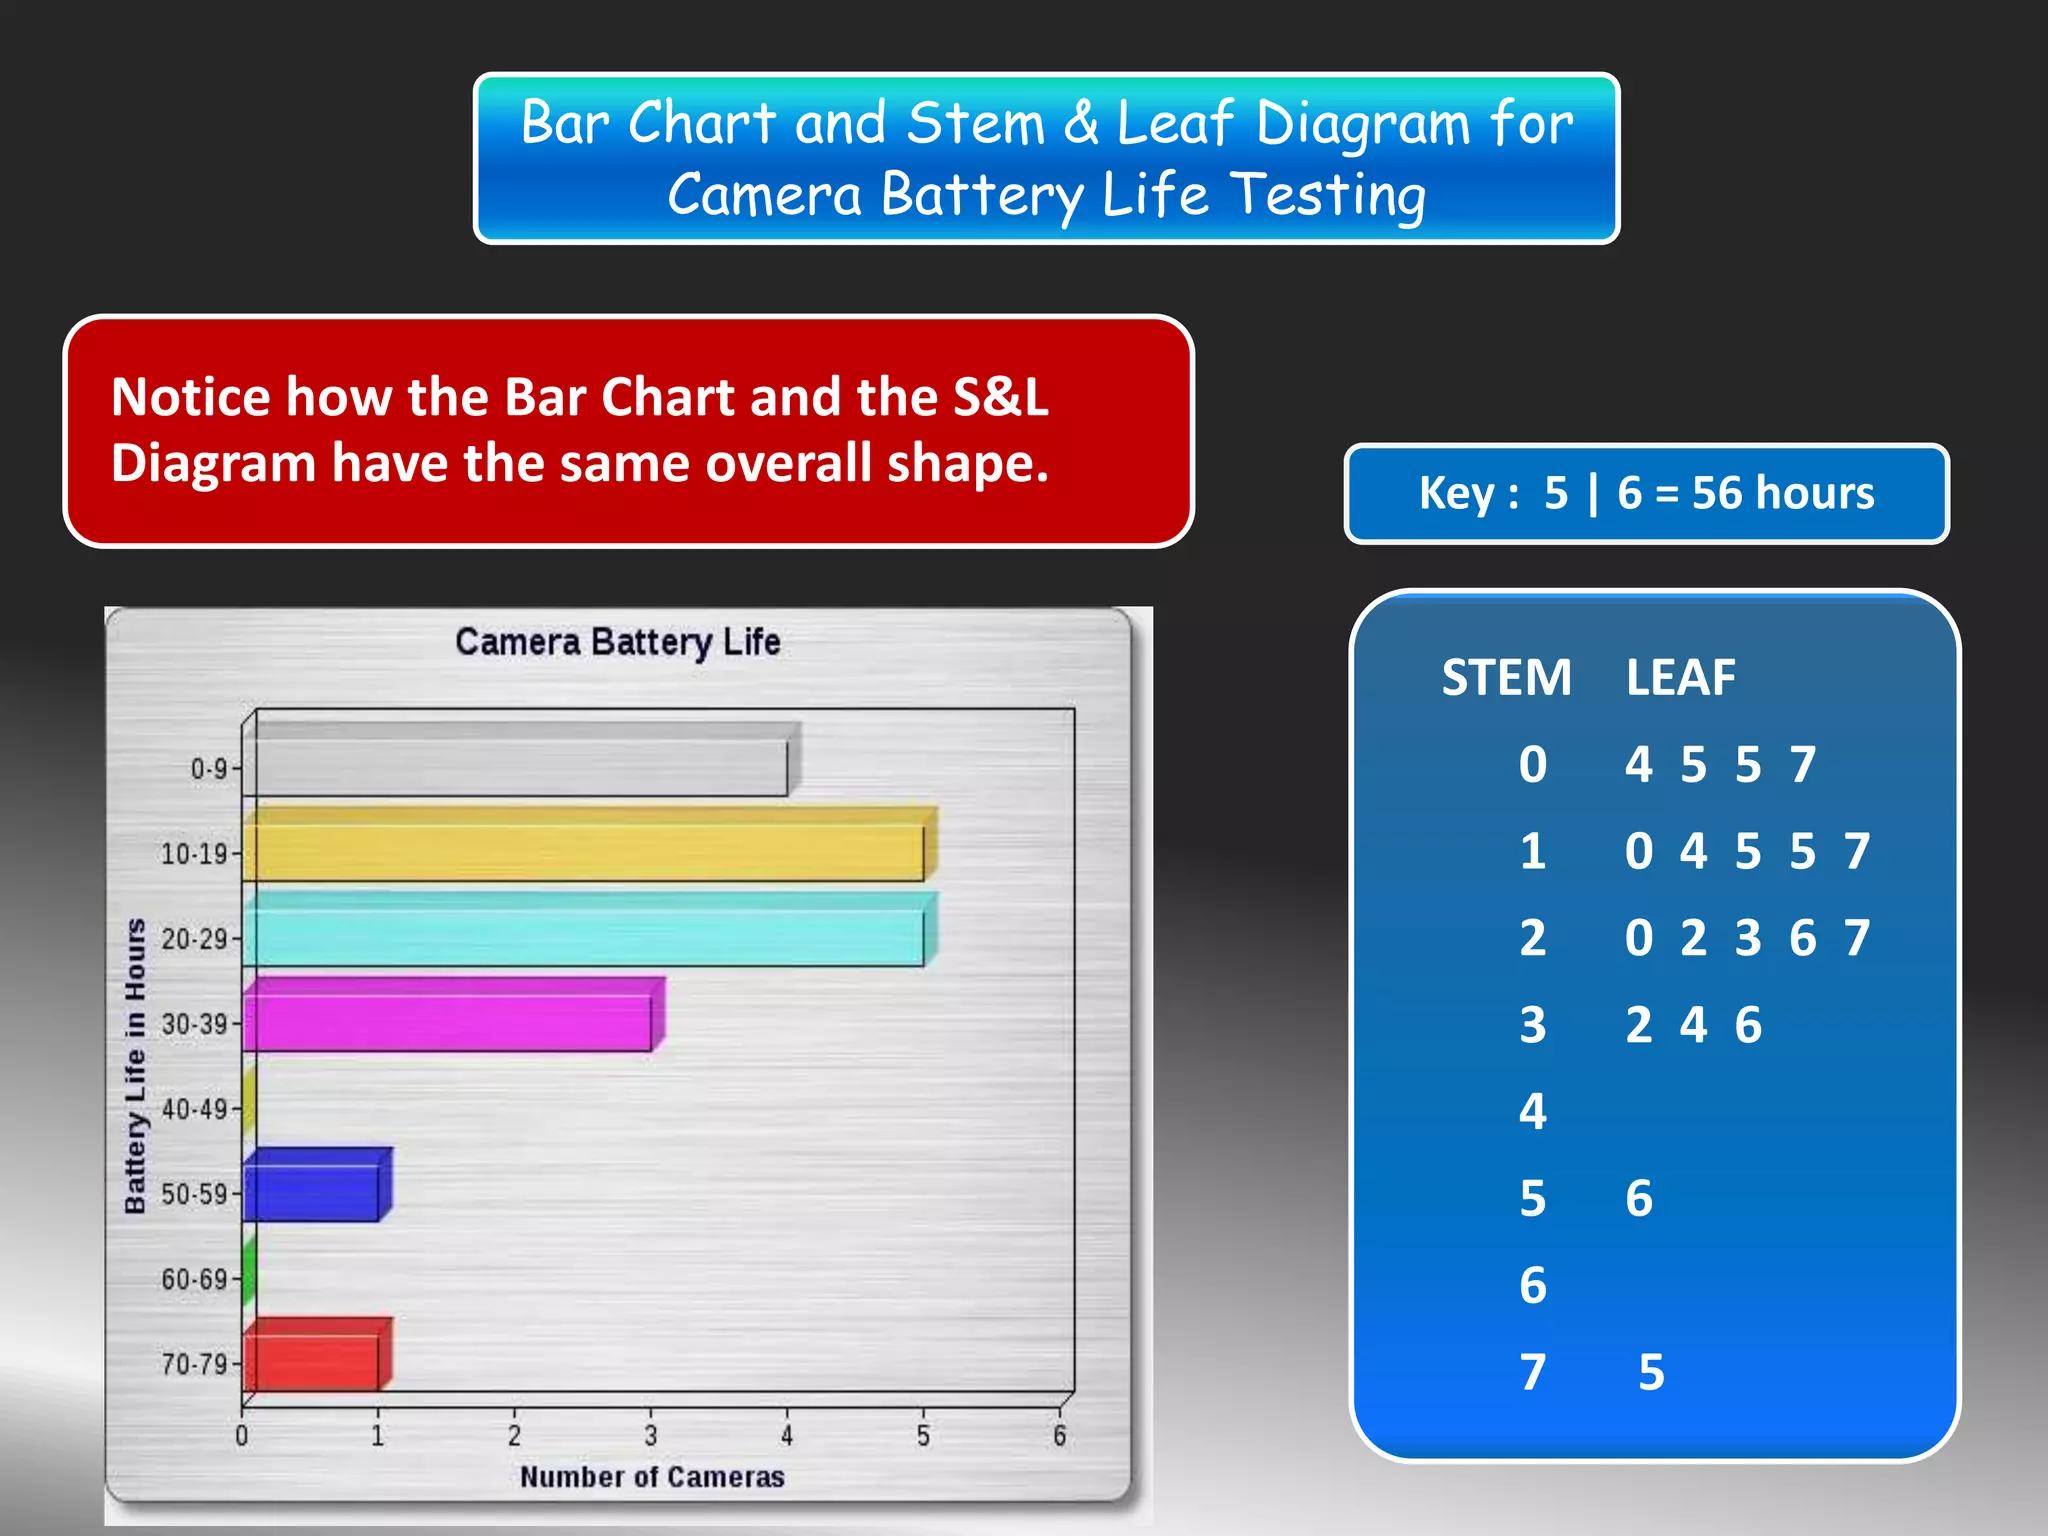
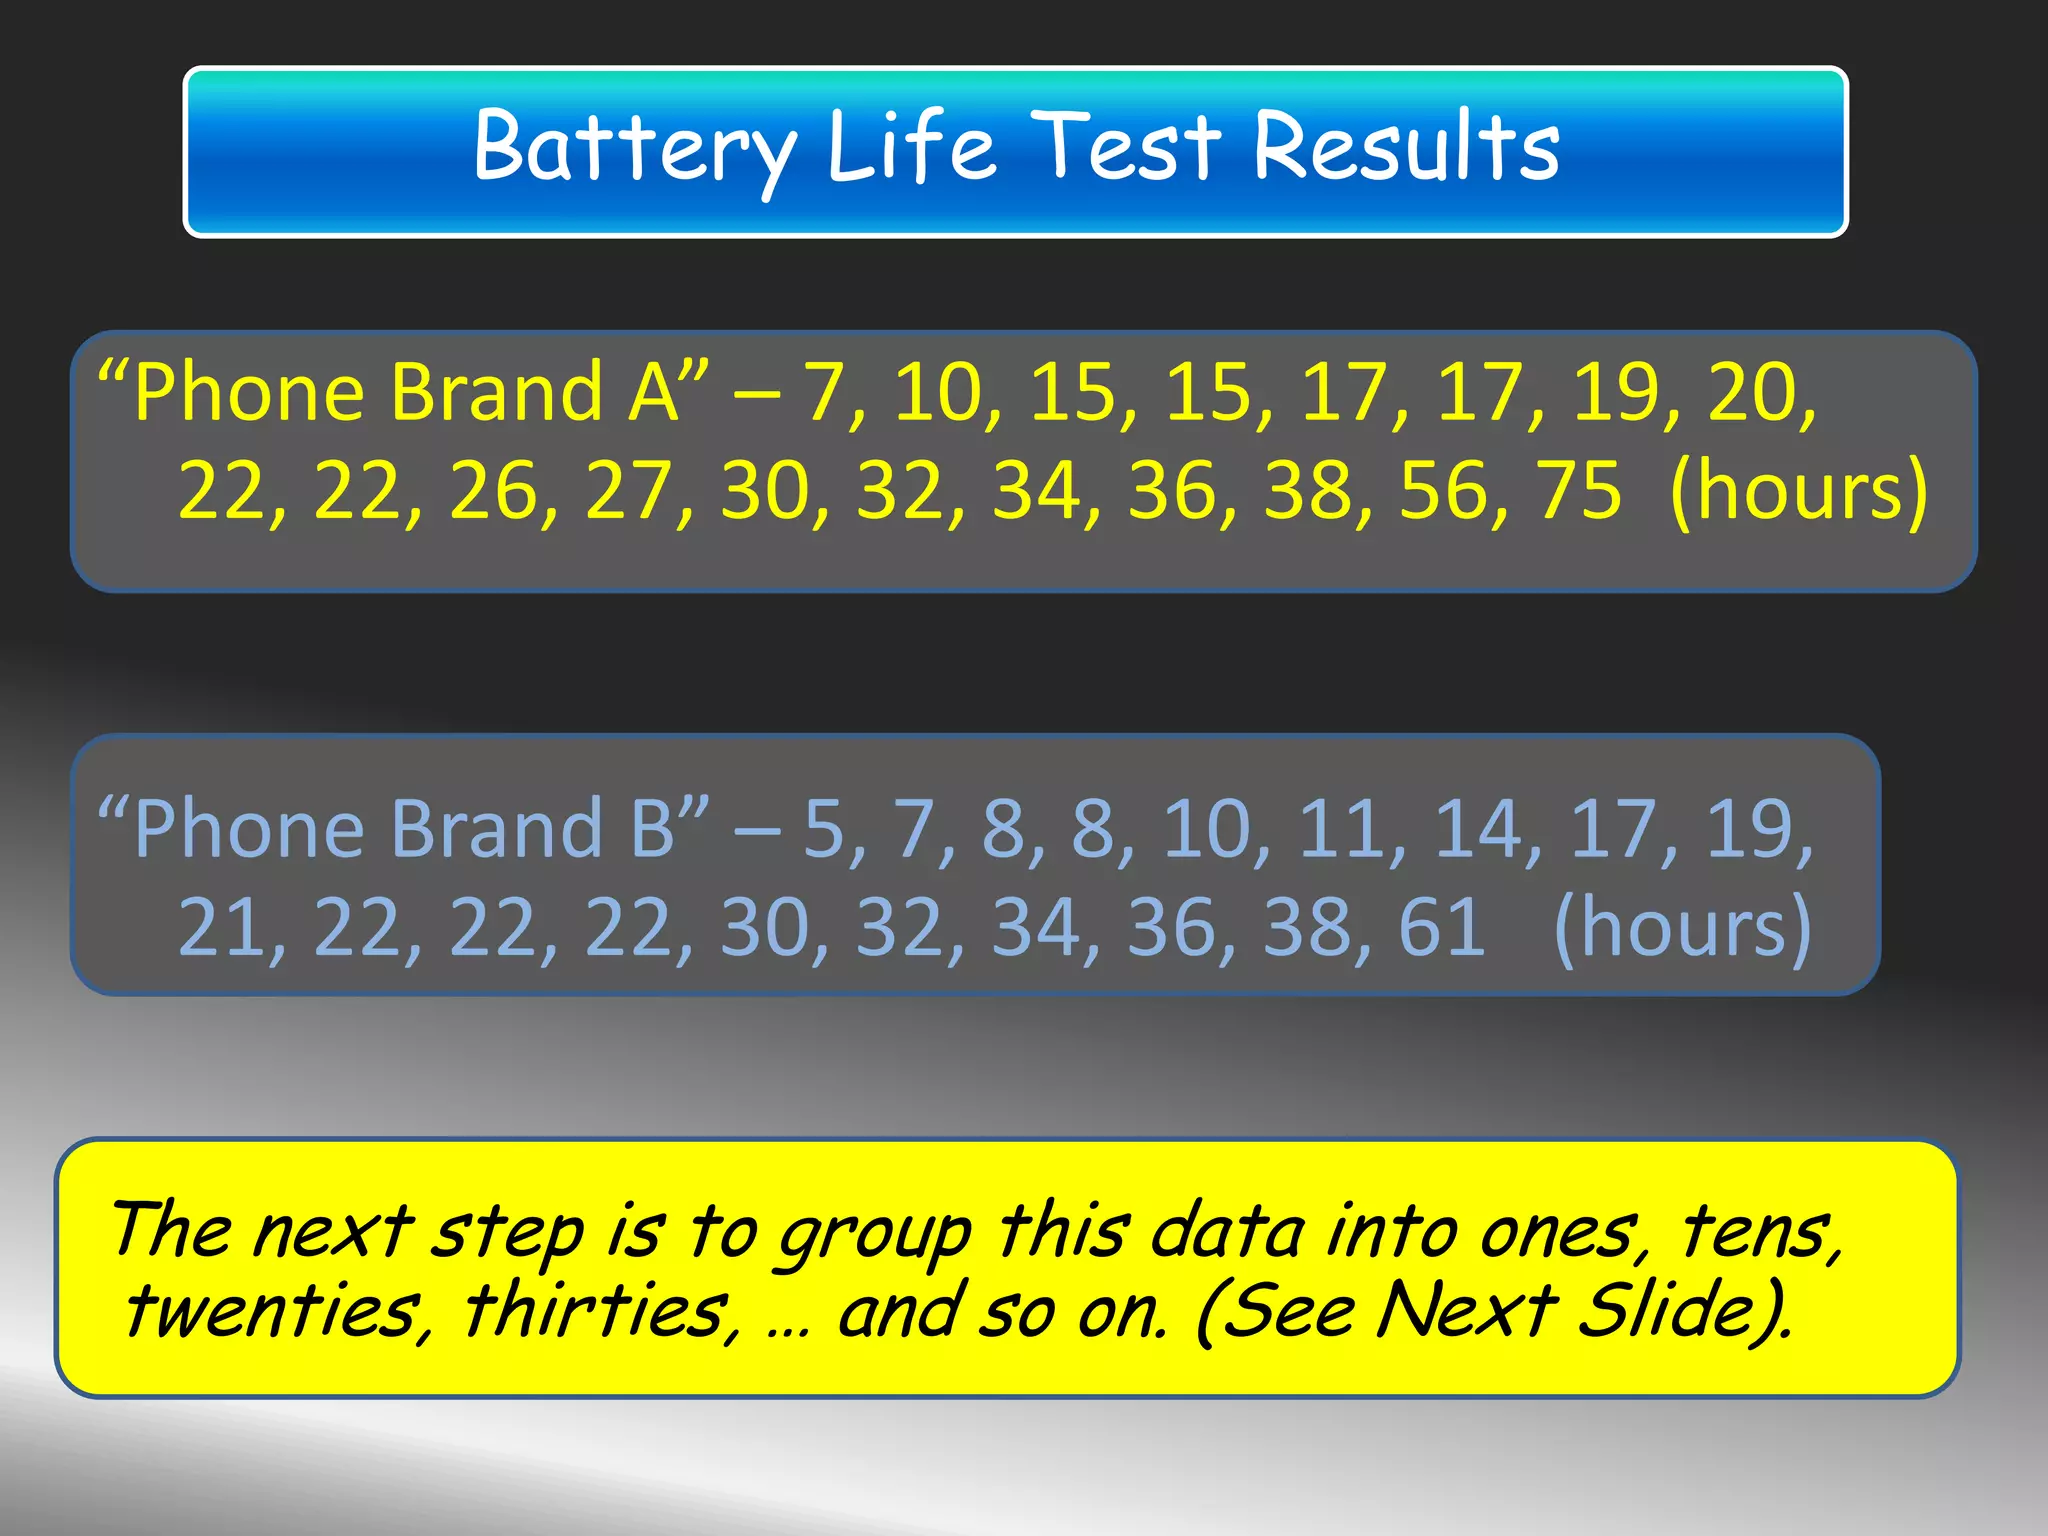
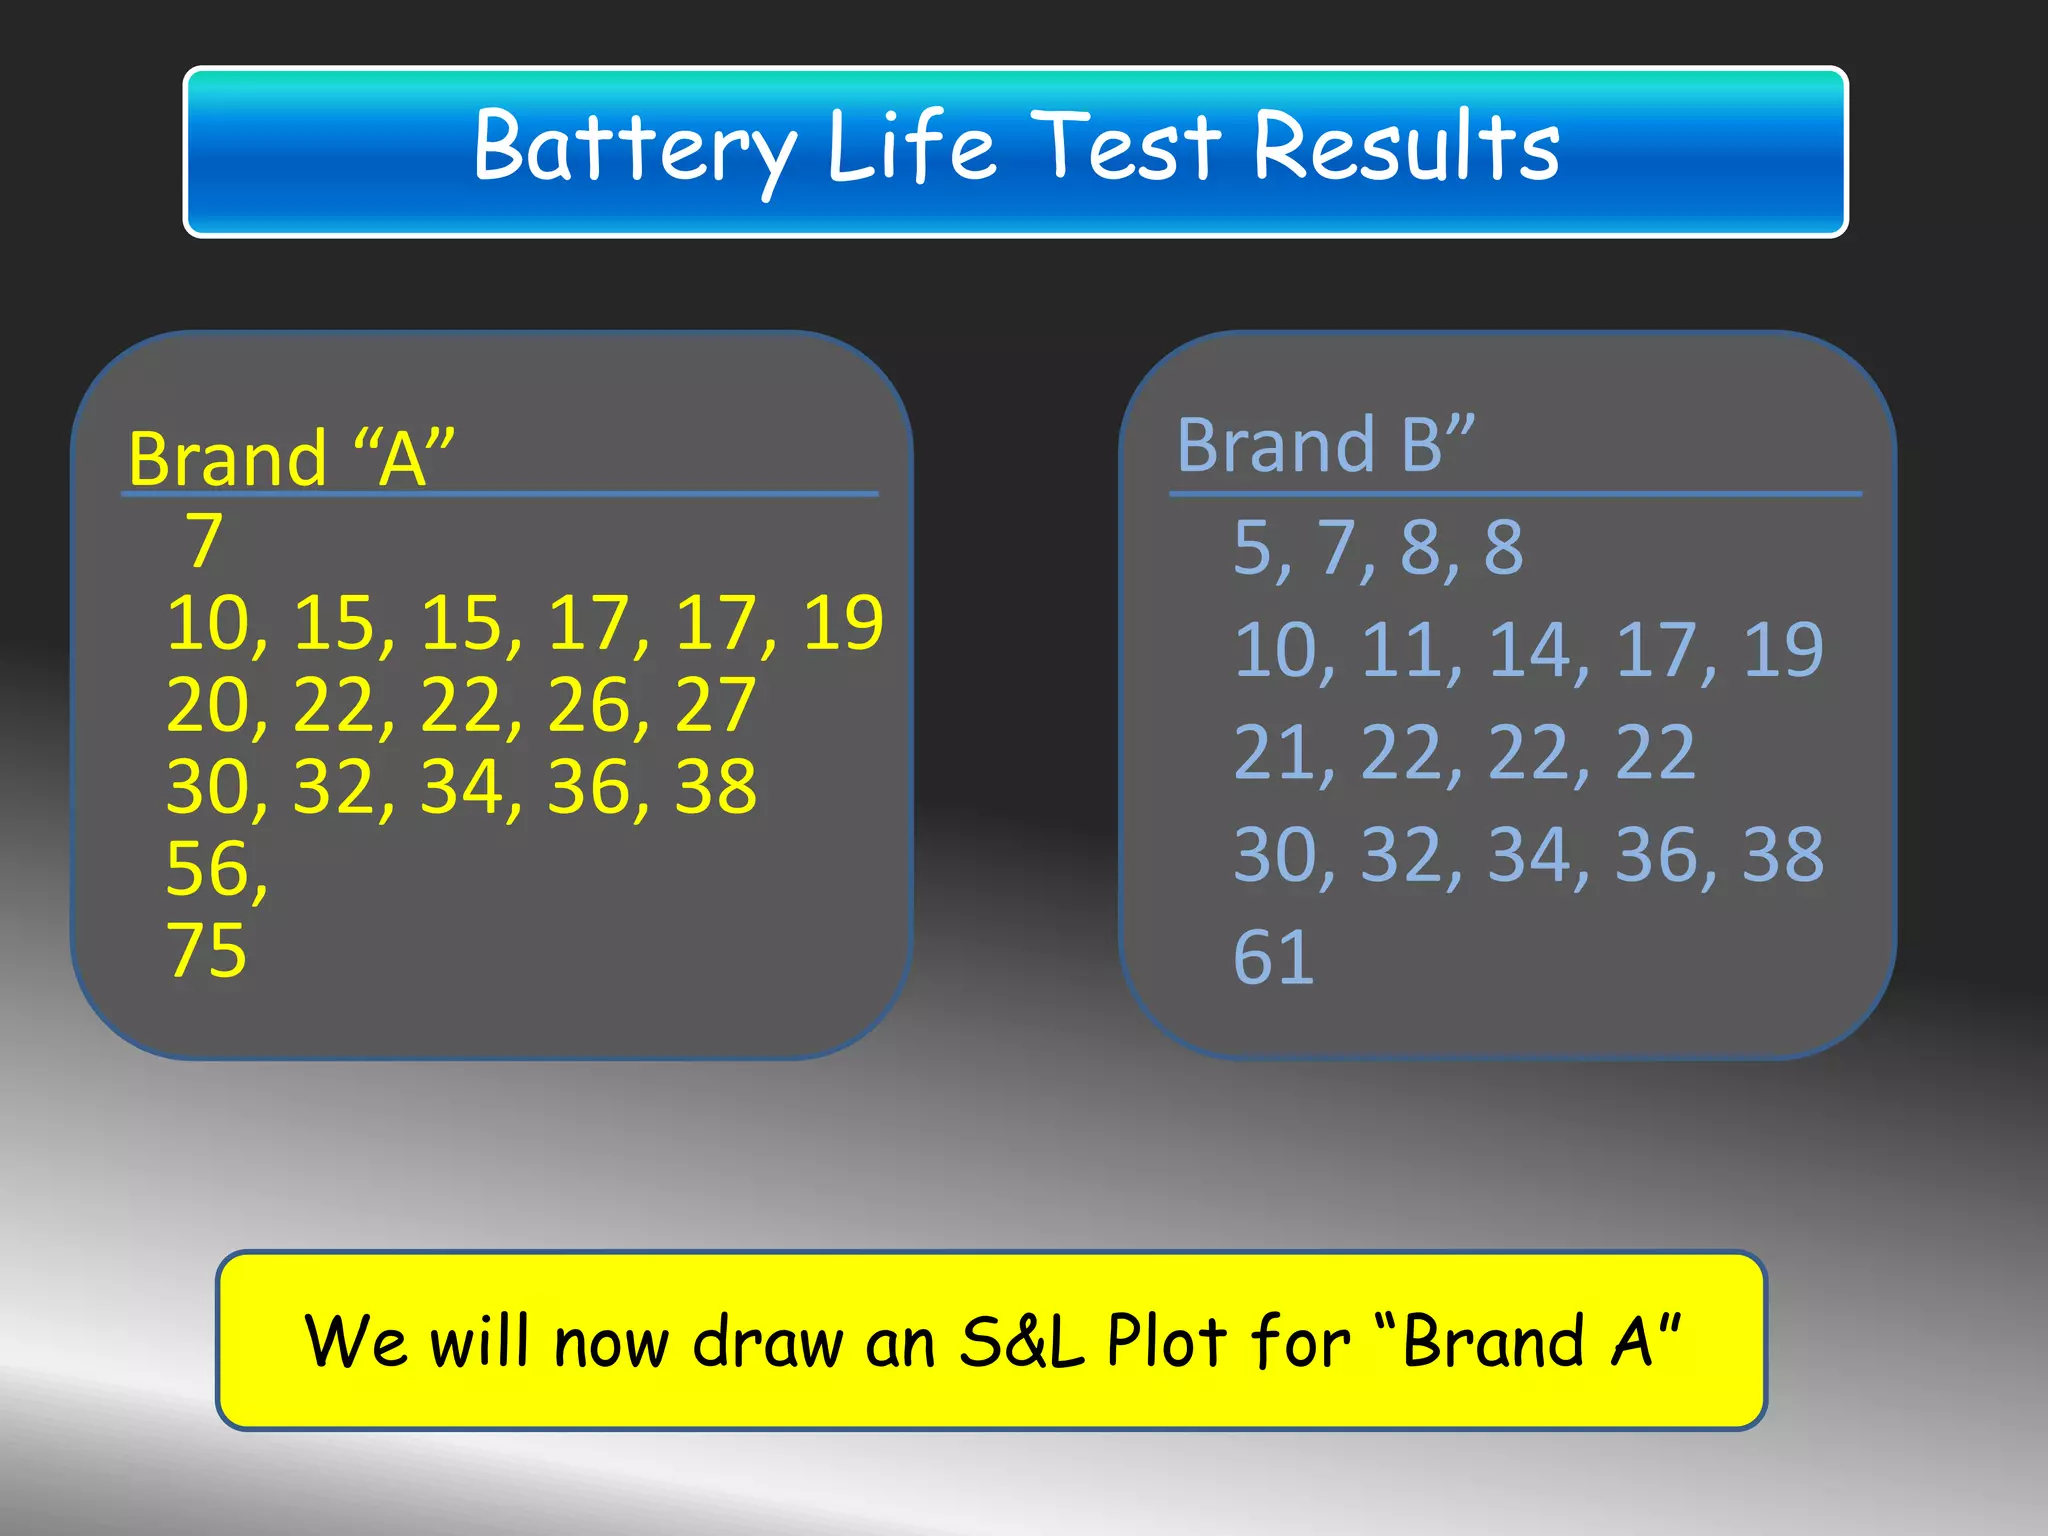
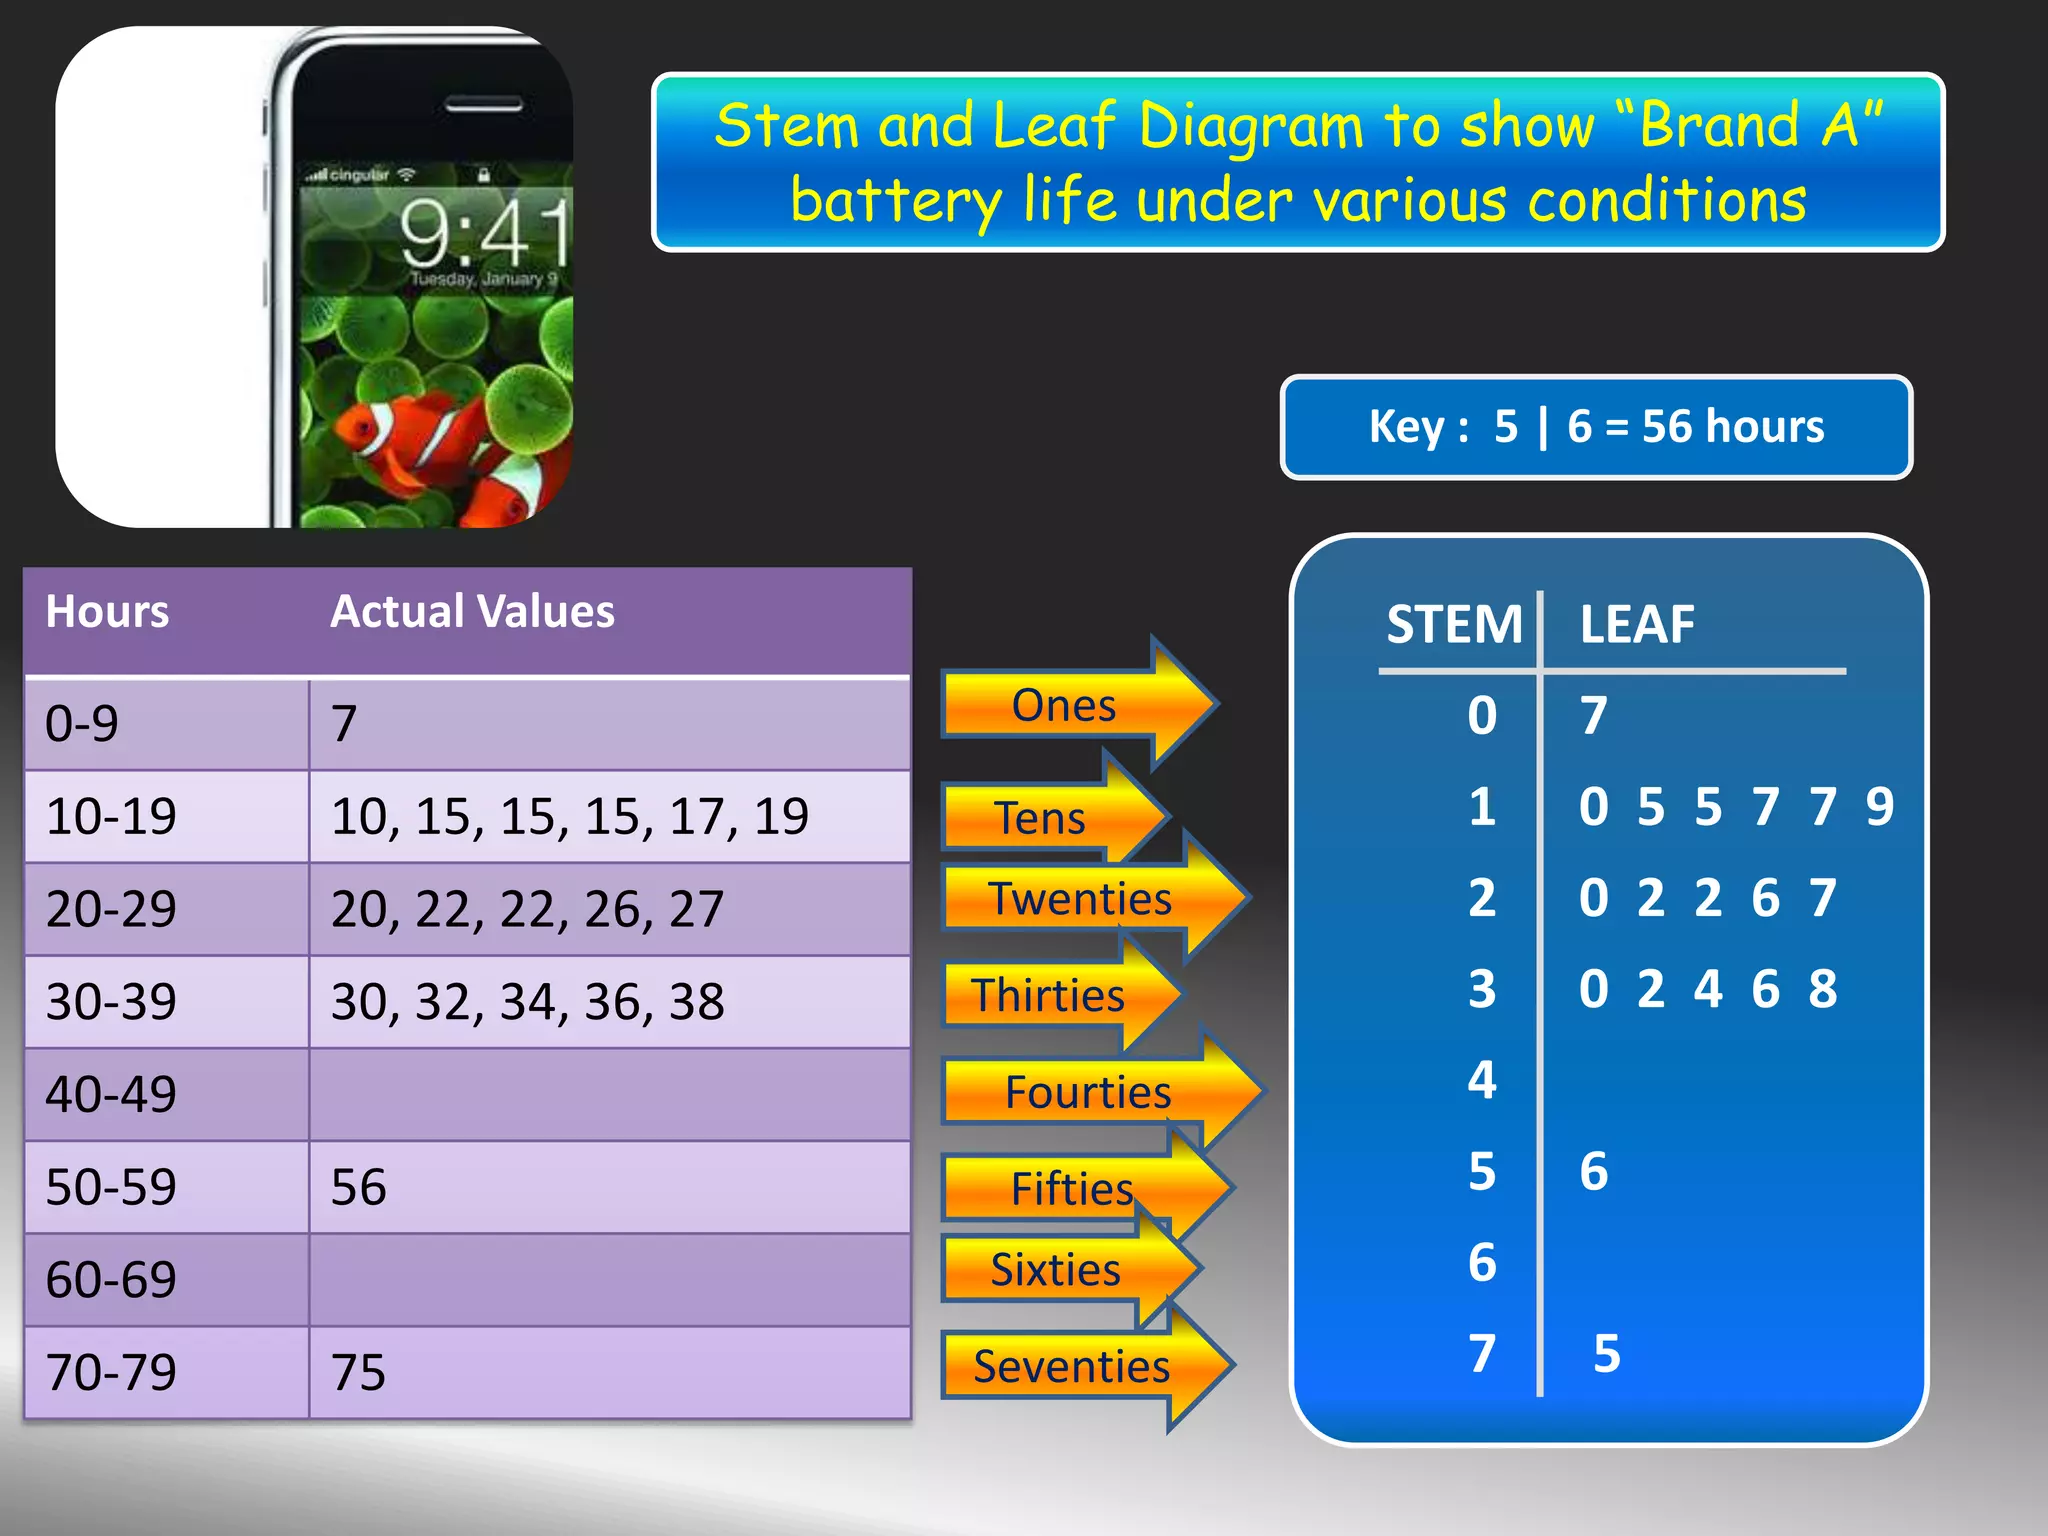
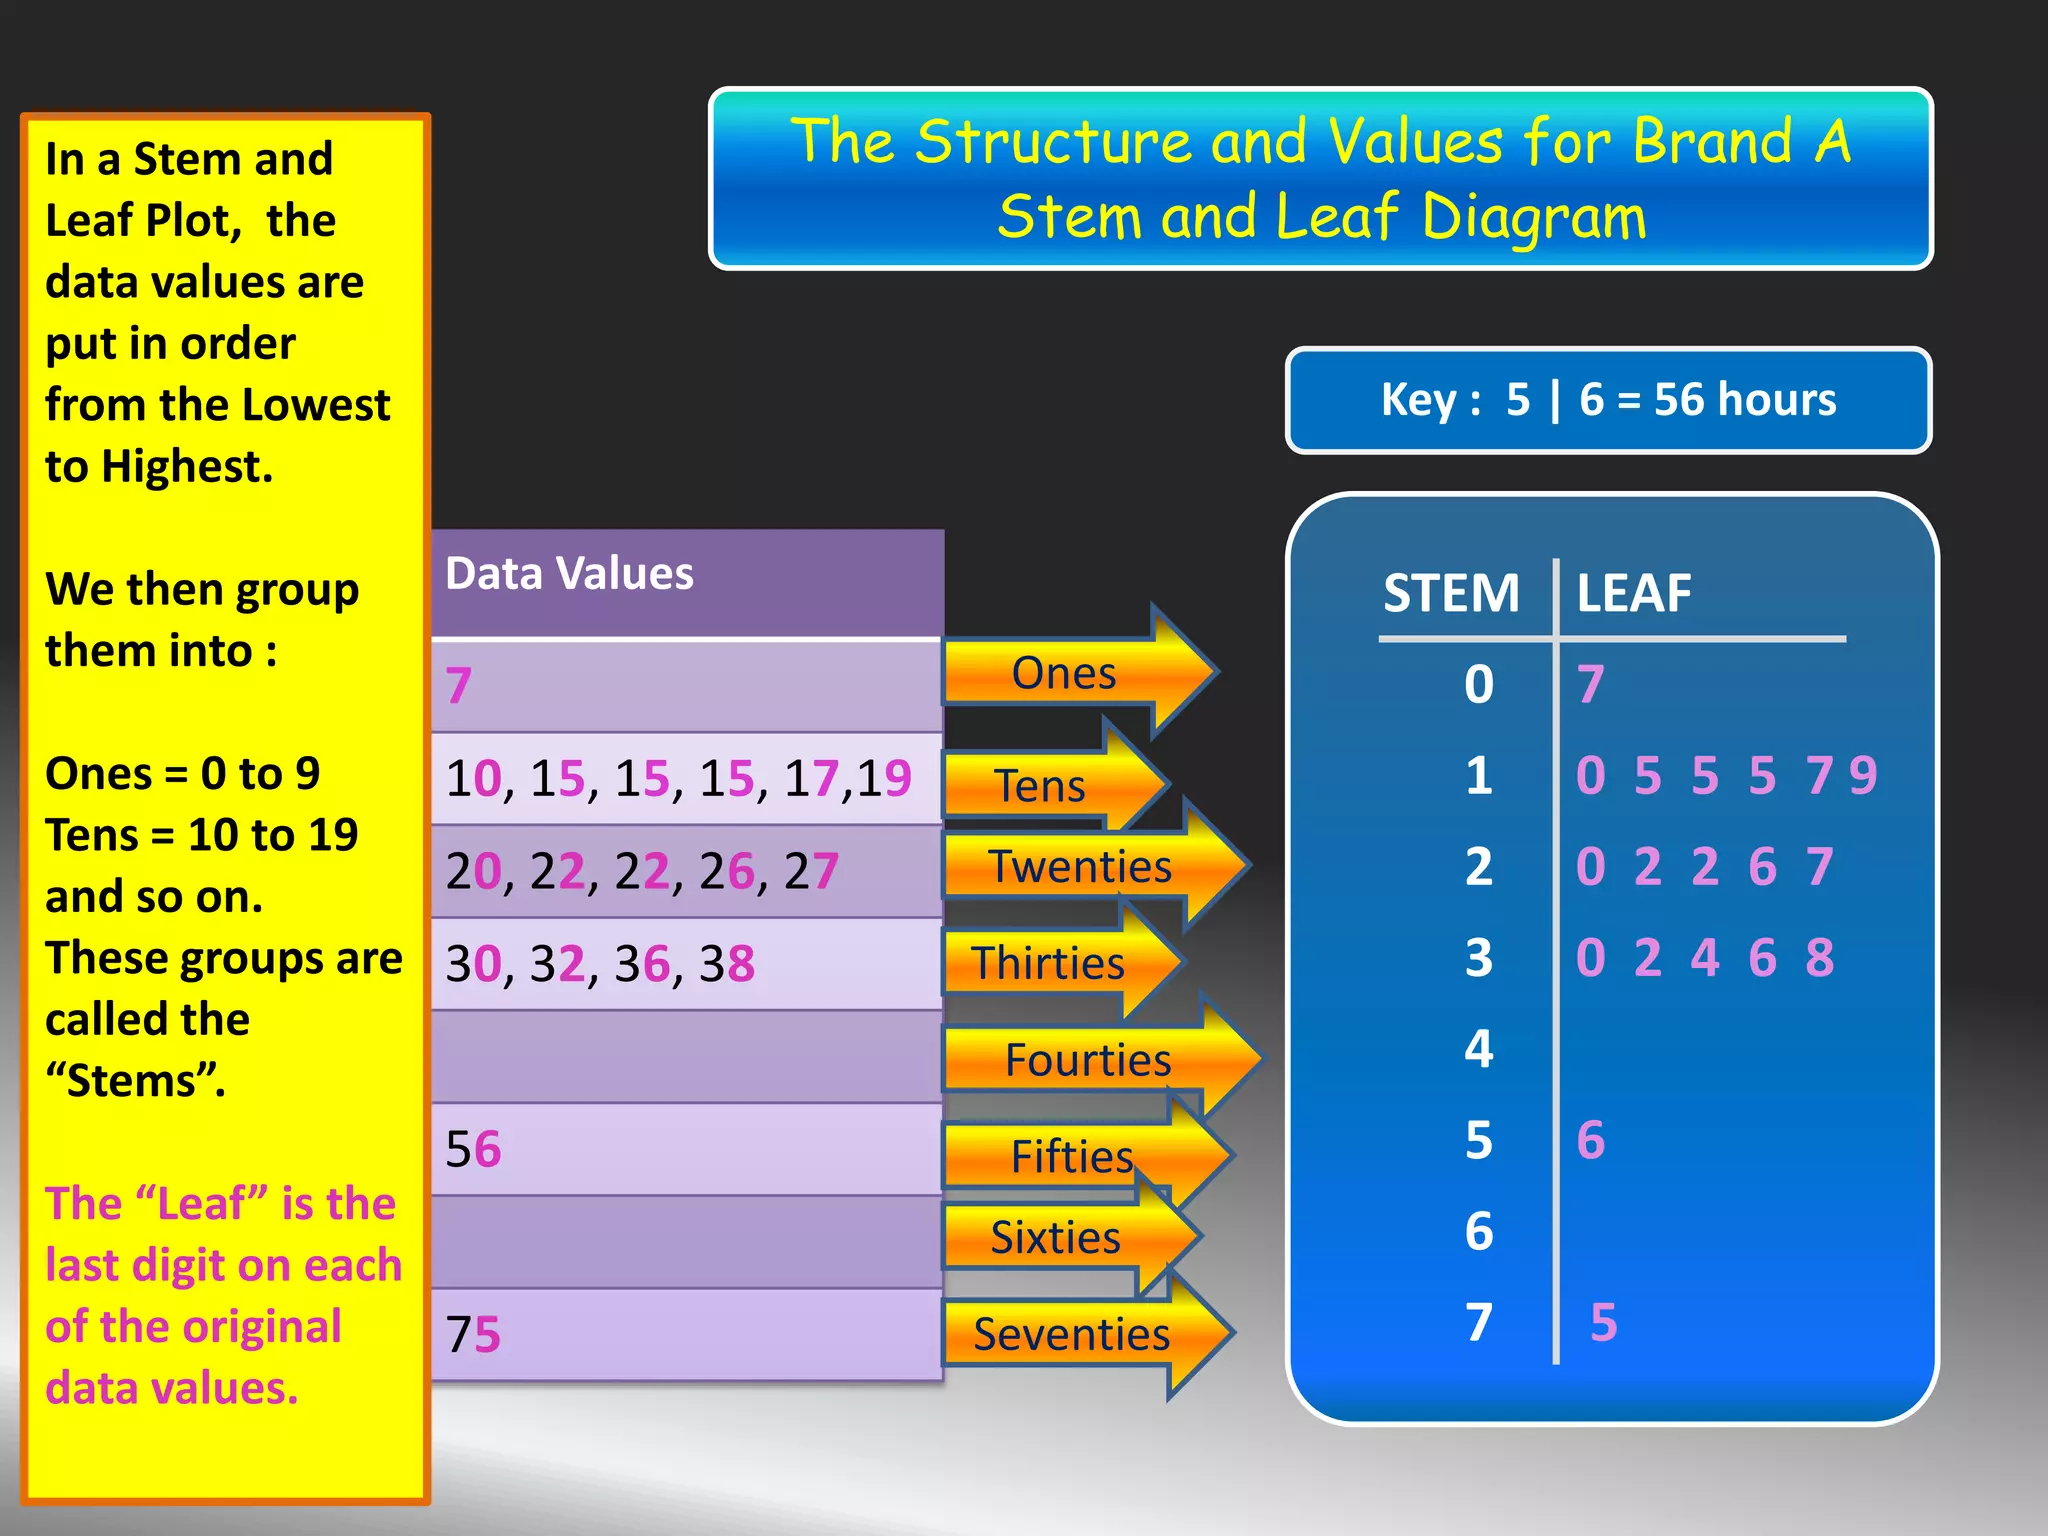
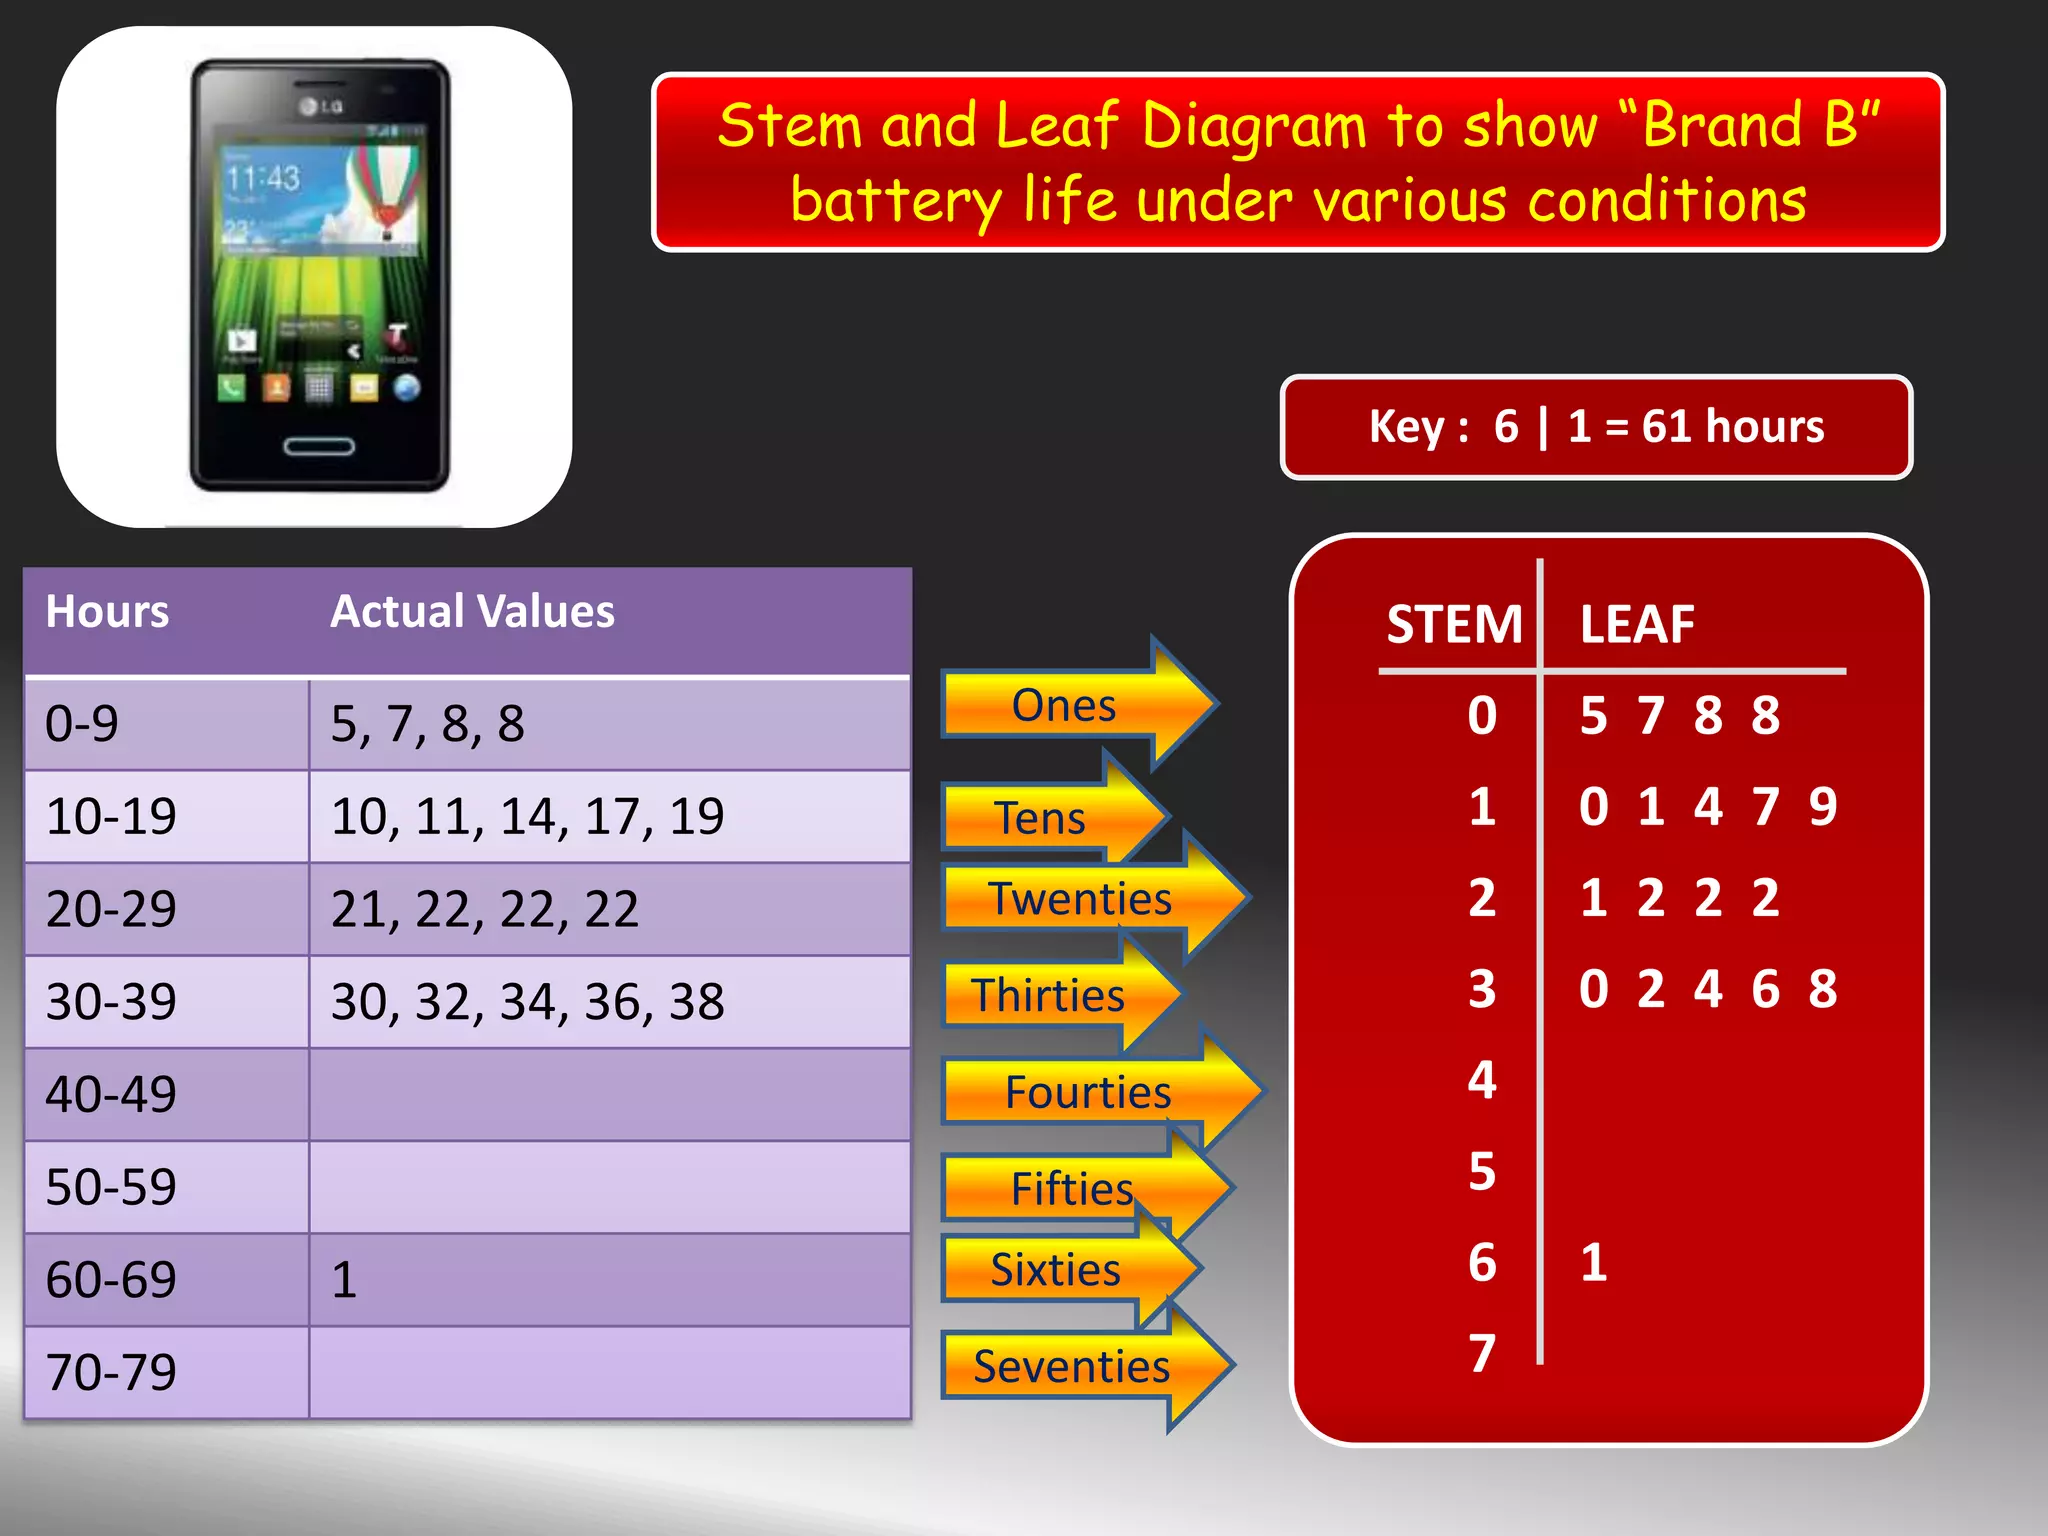
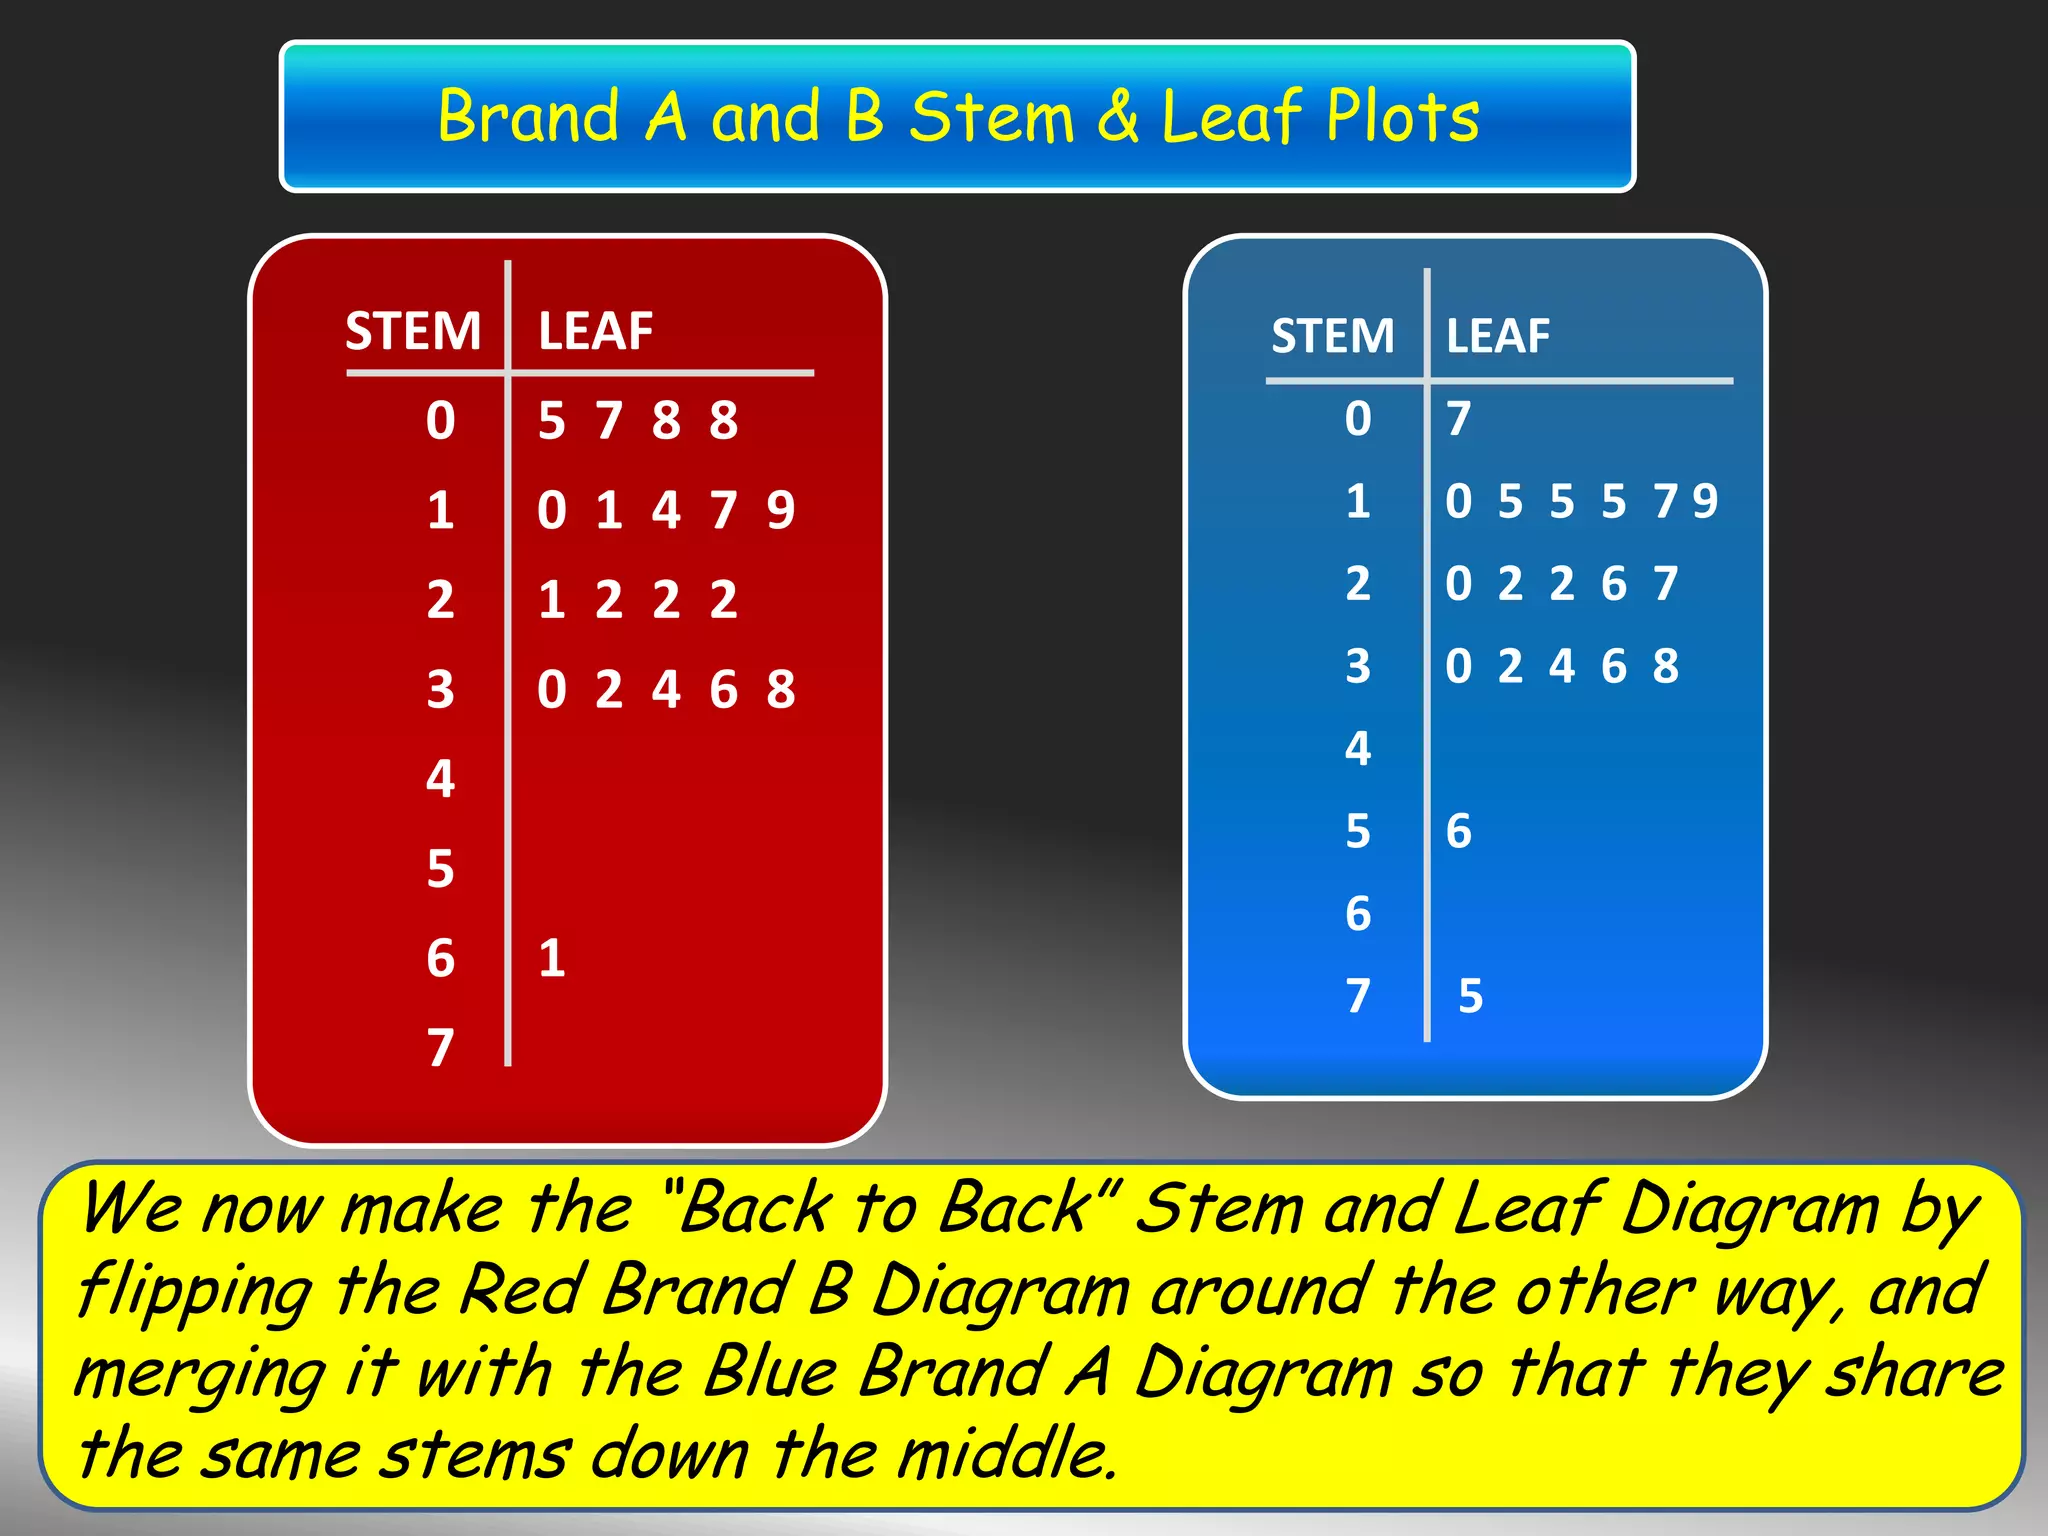
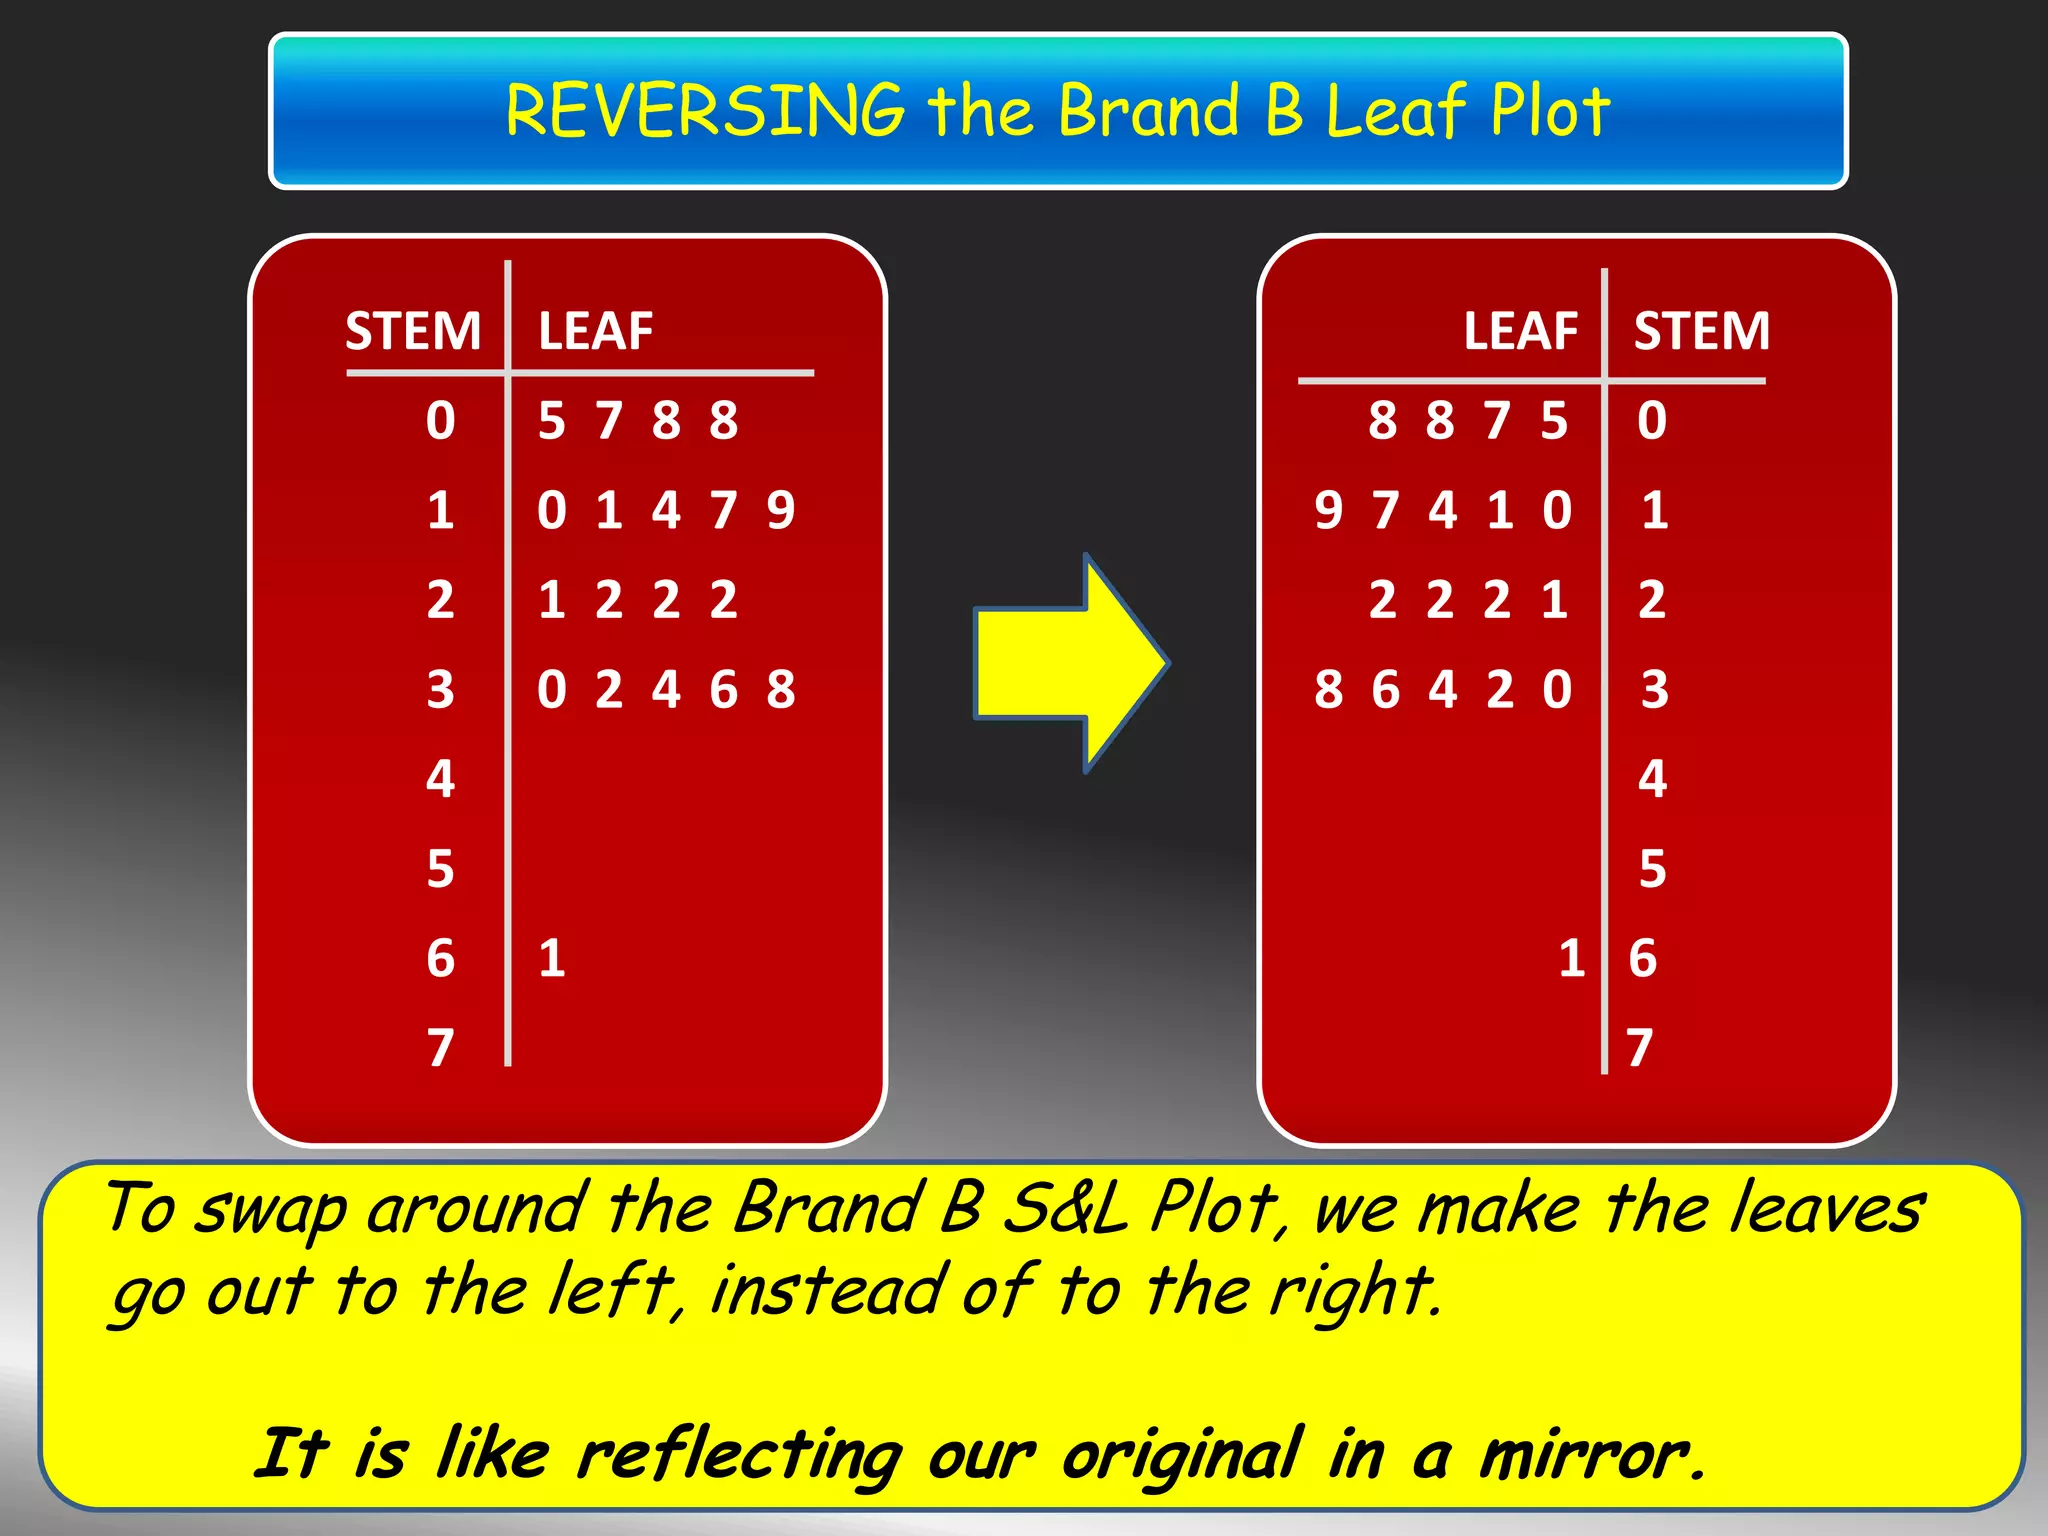
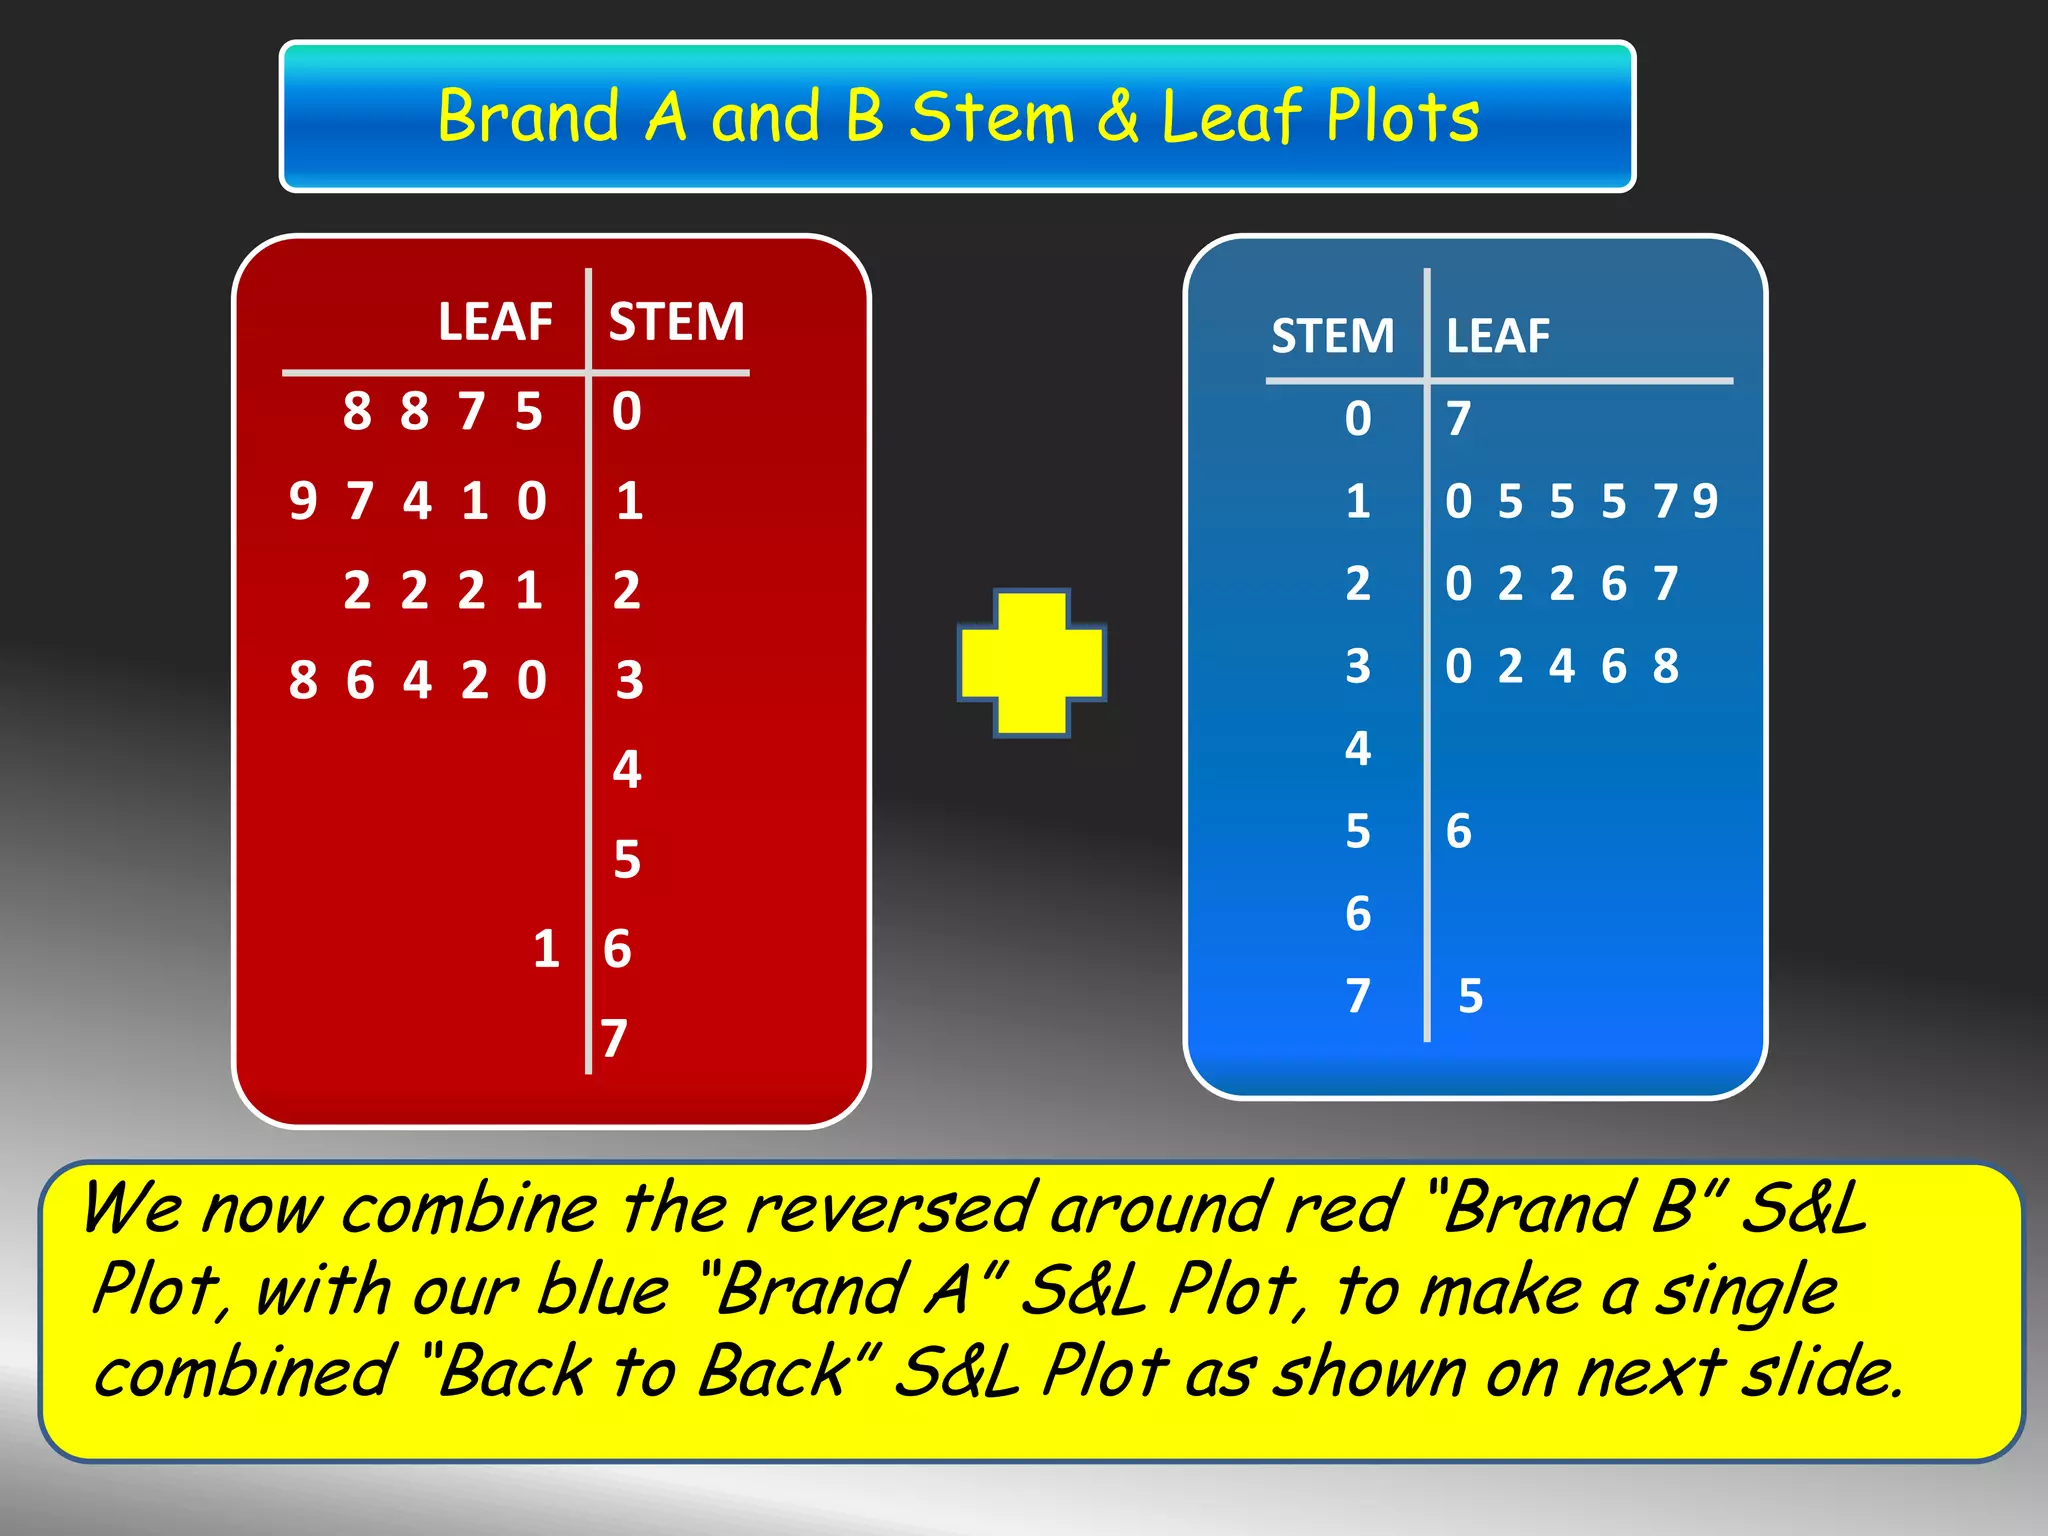
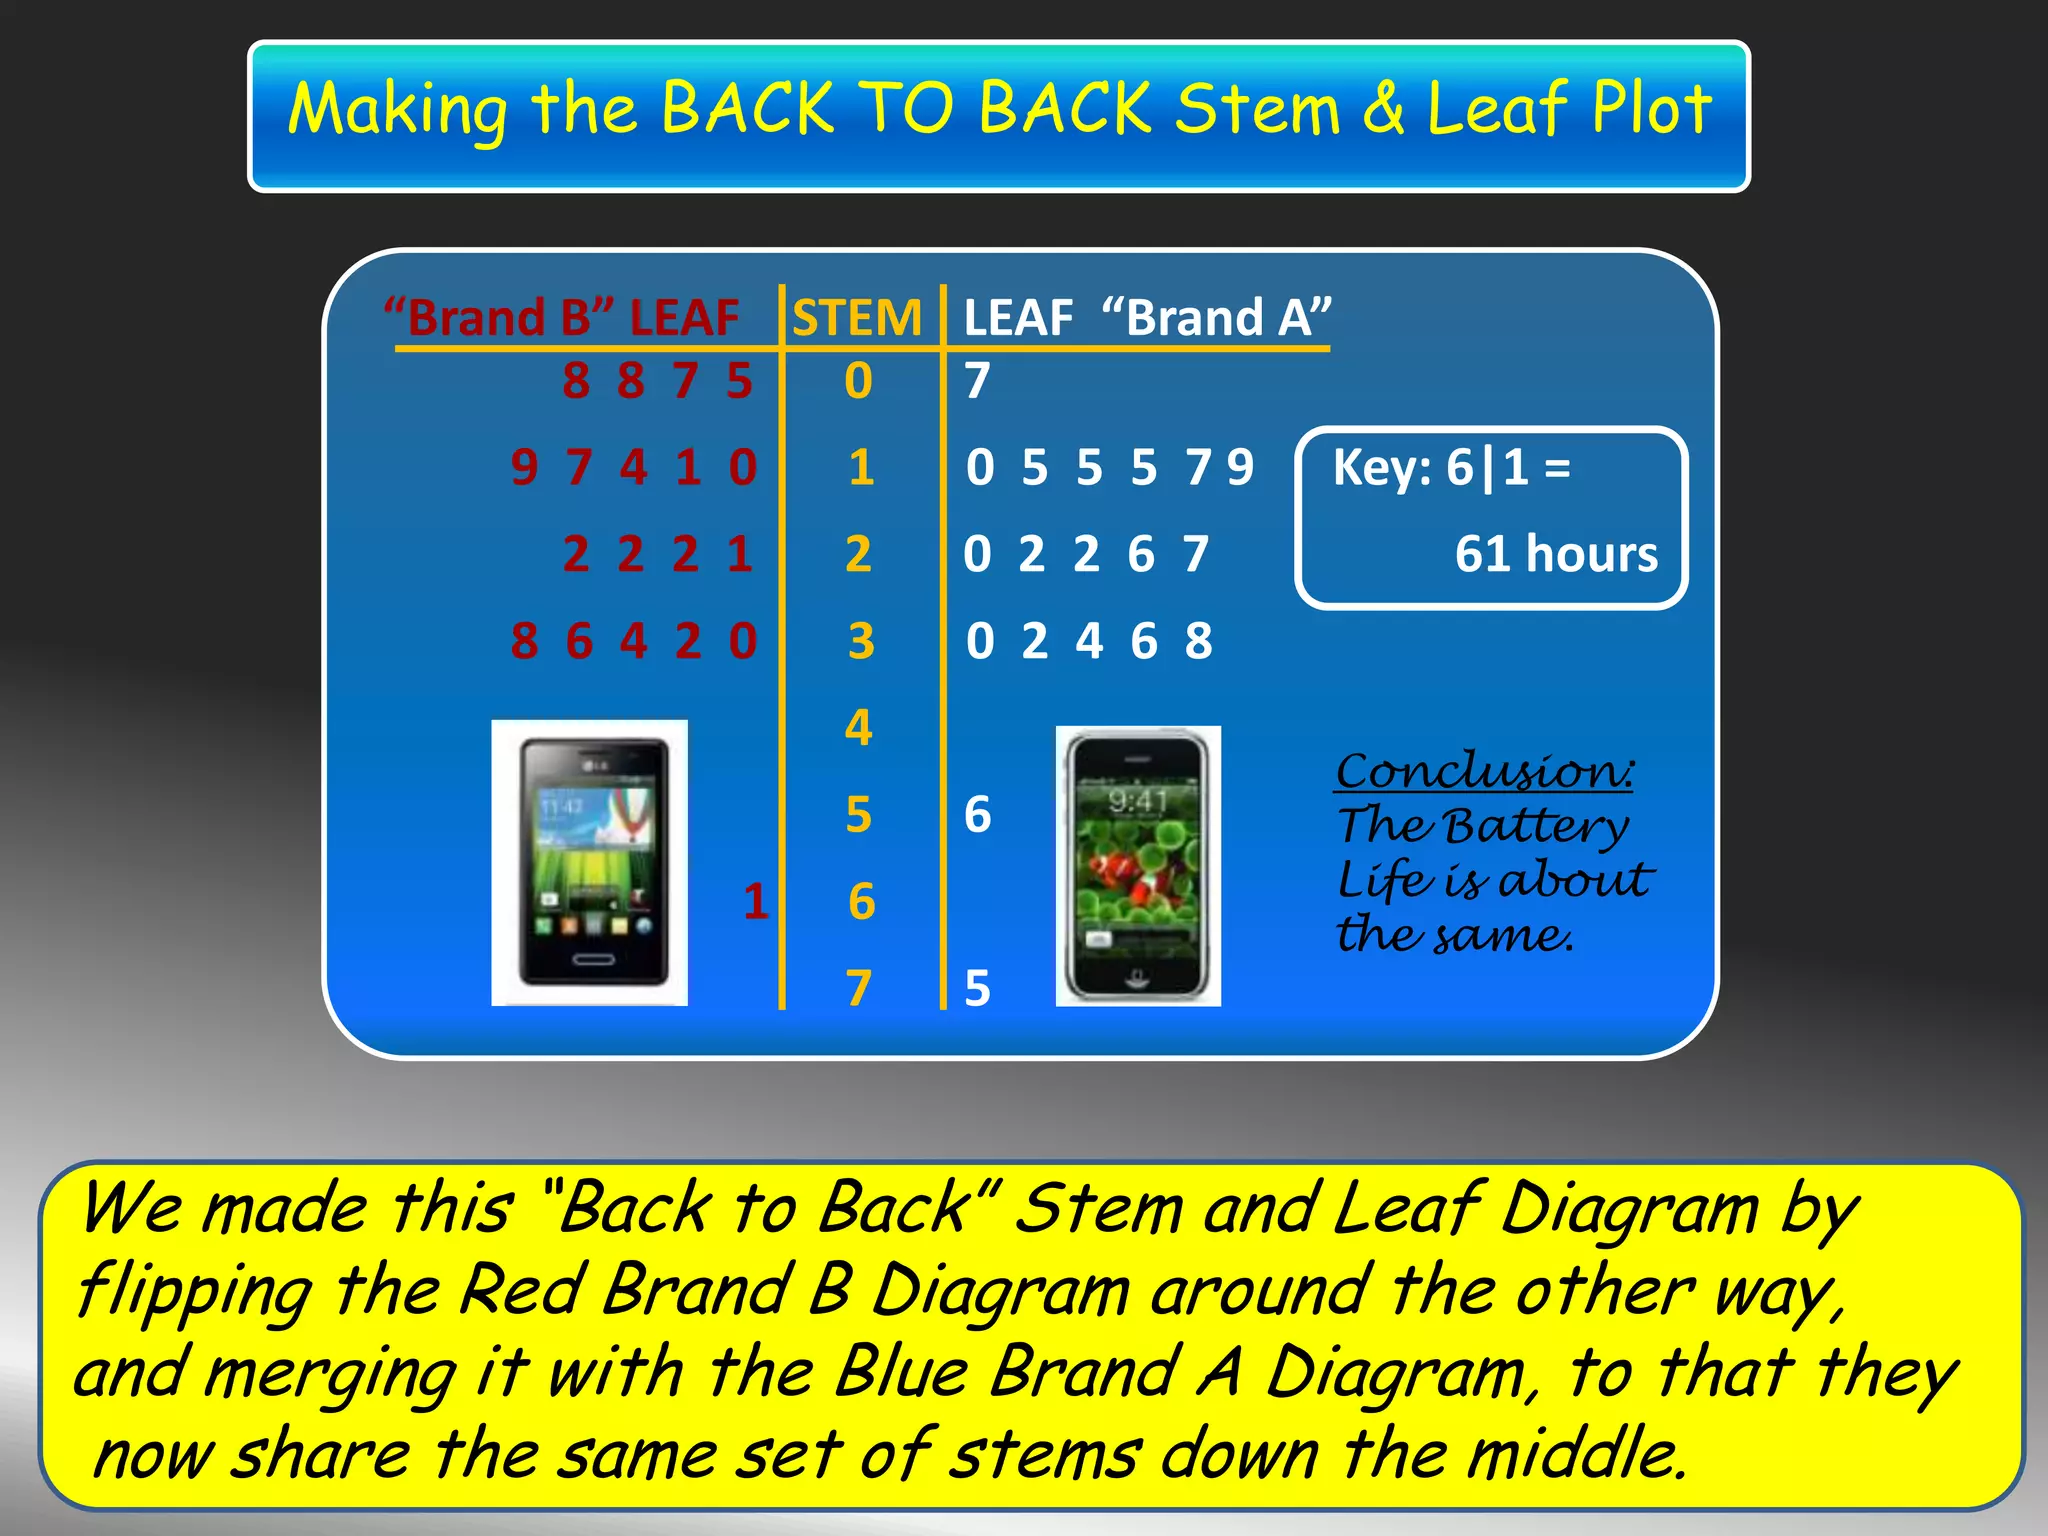
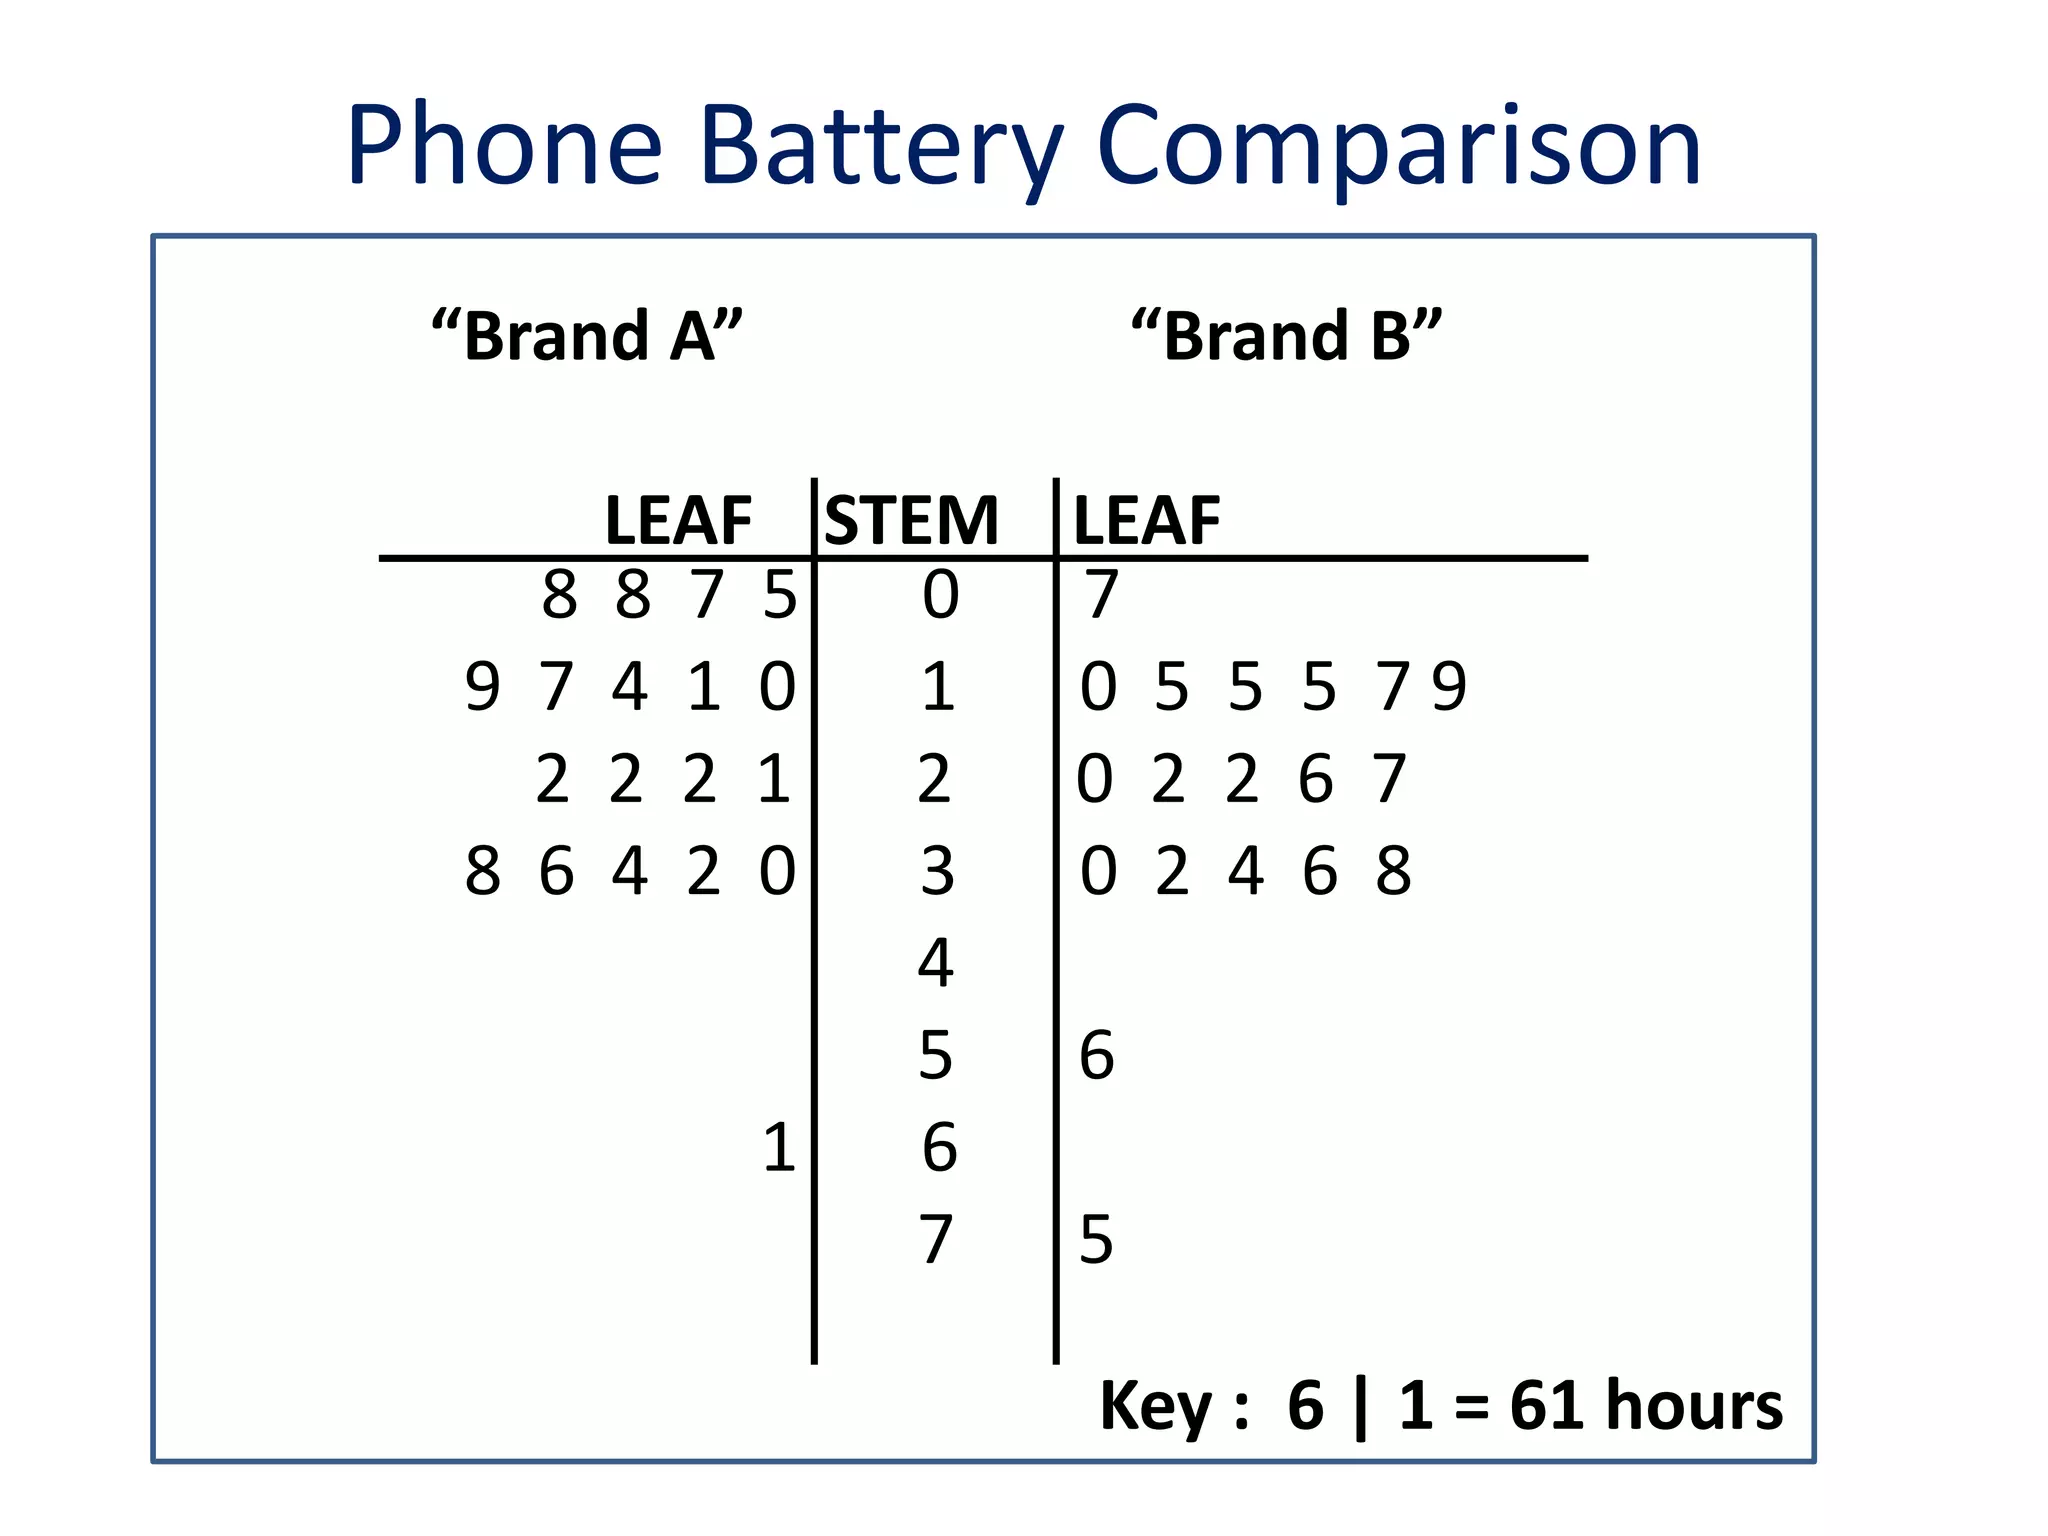
The document describes how to create a back-to-back stem and leaf plot to compare the battery life data from two phone brands. It shows the raw battery life data for each brand in hours. Then it draws individual stem and leaf plots for each brand's data. Finally, it combines the two plots by reversing one and placing them side by side to allow direct comparison of the battery life distributions between the two brands.
JLL Grand Rapids Office Insight & Statistics - Q3 2019Harrison West
While rent growth has leveled off in the Grand Rapids office market, vacancies compressed further in the third quarter. Average asking rents are $18.74 per square foot across the market, while market-wide vacancy currently sits at 8.5 percent, down 1.7 percent over the same period. The high-profile Warner Building development delivered fully-leased in August, adding 118,000 square feet to the downtown Class A inventory.
This slide is special for master students (MIBS & MIFB) in UUM. Also useful for readers who are interested in the topic of contemporary Islamic banking.
A Strategic Approach: GenAI in EducationPeter Windle
Artificial Intelligence (AI) technologies such as Generative AI, Image Generators and Large Language Models have had a dramatic impact on teaching, learning and assessment over the past 18 months. The most immediate threat AI posed was to Academic Integrity with Higher Education Institutes (HEIs) focusing their efforts on combating the use of GenAI in assessment. Guidelines were developed for staff and students, policies put in place too. Innovative educators have forged paths in the use of Generative AI for teaching, learning and assessments leading to pockets of transformation springing up across HEIs, often with little or no top-down guidance, support or direction.
This Gasta posits a strategic approach to integrating AI into HEIs to prepare staff, students and the curriculum for an evolving world and workplace. We will highlight the advantages of working with these technologies beyond the realm of teaching, learning and assessment by considering prompt engineering skills, industry impact, curriculum changes, and the need for staff upskilling. In contrast, not engaging strategically with Generative AI poses risks, including falling behind peers, missed opportunities and failing to ensure our graduates remain employable. The rapid evolution of AI technologies necessitates a proactive and strategic approach if we are to remain relevant.
MATATAG CURRICULUM: ASSESSING THE READINESS OF ELEM. PUBLIC SCHOOL TEACHERS I...NelTorrente
In this research, it concludes that while the readiness of teachers in Caloocan City to implement the MATATAG Curriculum is generally positive, targeted efforts in professional development, resource distribution, support networks, and comprehensive preparation can address the existing gaps and ensure successful curriculum implementation.
it describes the bony anatomy including the femoral head , acetabulum, labrum . also discusses the capsule , ligaments . muscle that act on the hip joint and the range of motion are outlined. factors affecting hip joint stability and weight transmission through the joint are summarized.
How to Add Chatter in the odoo 17 ERP ModuleCeline George
In Odoo, the chatter is like a chat tool that helps you work together on records. You can leave notes and track things, making it easier to talk with your team and partners. Inside chatter, all communication history, activity, and changes will be displayed.
Executive Directors Chat Leveraging AI for Diversity, Equity, and InclusionTechSoup
Let’s explore the intersection of technology and equity in the final session of our DEI series. Discover how AI tools, like ChatGPT, can be used to support and enhance your nonprofit's DEI initiatives. Participants will gain insights into practical AI applications and get tips for leveraging technology to advance their DEI goals.
A review of the growth of the Israel Genealogy Research Association Database Collection for the last 12 months. Our collection is now passed the 3 million mark and still growing. See which archives have contributed the most. See the different types of records we have, and which years have had records added. You can also see what we have for the future.
Strategies for Effective Upskilling is a presentation by Chinwendu Peace in a Your Skill Boost Masterclass organisation by the Excellence Foundation for South Sudan on 08th and 09th June 2024 from 1 PM to 3 PM on each day.
2. STEM LEAF
0 4 5 5 7
1 0 4 5 5 7
2 0 2 3 6 7
3 2 4 6
4
5 6
6
7 5
Key : 5 | 6 = 56 hours
Notice how the Bar Chart and the S&L
Diagram have the same overall shape.
Bar Chart and Stem & Leaf Diagram for
Camera Battery Life Testing
3. Two Mobile Phones have been tested for Battery
Life in between charges. We need to create a
Back to Back Stem and Leaf Plot to show the
comparison of the battery life results.
It is assumed that people already know how to
do basic Stem and Leaf Plots.
The raw data is shown on the next slide
Back to Back Stem & Leaf Diagrams
4. “Phone Brand A” – 7, 10, 15, 15, 17, 17, 19, 20,
22, 22, 26, 27, 30, 32, 34, 36, 38, 56, 75 (hours)
“Phone Brand B” – 5, 7, 8, 8, 10, 11, 14, 17, 19,
21, 22, 22, 22, 30, 32, 34, 36, 38, 61 (hours)
The next step is to group this data into ones, tens,
twenties, thirties, … and so on. (See Next Slide).
Battery Life Test Results
5. We will now draw an S&L Plot for “Brand A”
Brand “A”
7
10, 15, 15, 17, 17, 19
20, 22, 22, 26, 27
30, 32, 34, 36, 38
56,
75
Battery Life Test Results
Brand B”
5, 7, 8, 8
10, 11, 14, 17, 19
21, 22, 22, 22
30, 32, 34, 36, 38
61
7. STEM LEAF
0 7
1 0 5 5 5 7 9
2 0 2 2 6 7
3 0 2 4 6 8
4
5 6
6
7 5
Key : 5 | 6 = 56 hours
The Structure and Values for Brand A
Stem and Leaf Diagram
Battery Life Data Values
0-9 7
10-19 10, 15, 15, 15, 17,19
20-29 20, 22, 22, 26, 27
30-39 30, 32, 36, 38
40-49
50-59 56
60-69
70-79 75
Ones
Tens
Twenties
Thirties
Fourties
Fifties
Sixties
Seventies
In a Stem and
Leaf Plot, the
data values are
put in order
from the Lowest
to Highest.
We then group
them into :
Ones = 0 to 9
Tens = 10 to 19
and so on.
These groups are
called the
“Stems”.
The “Leaf” is the
last digit on each
of the original
data values.
9. STEM LEAF
0 7
1 0 5 5 5 7 9
2 0 2 2 6 7
3 0 2 4 6 8
4
5 6
6
7 5
Brand A and B Stem & Leaf Plots
STEM LEAF
0 5 7 8 8
1 0 1 4 7 9
2 1 2 2 2
3 0 2 4 6 8
4
5
6 1
7
We now make the “Back to Back” Stem and Leaf Diagram by
flipping the Red Brand B Diagram around the other way, and
merging it with the Blue Brand A Diagram so that they share
the same stems down the middle.
10. Creating the Back to Back S&L Plot involves
reversing our first S&L, like reversing a person.
Making a BACK TO BACK Stem & Leaf Plot
Images Source: Google Images
11. REVERSING the Brand B Leaf Plot
STEM LEAF
0 5 7 8 8
1 0 1 4 7 9
2 1 2 2 2
3 0 2 4 6 8
4
5
6 1
7
To swap around the Brand B S&L Plot, we make the leaves
go out to the left, instead of to the right.
It is like reflecting our original in a mirror.
LEAF STEM
8 8 7 5 0
9 7 4 1 0 1
2 2 2 1 2
8 6 4 2 0 3
4
5
1 6
7
12. STEM LEAF
0 7
1 0 5 5 5 7 9
2 0 2 2 6 7
3 0 2 4 6 8
4
5 6
6
7 5
Brand A and B Stem & Leaf Plots
We now combine the reversed around red “Brand B” S&L
Plot, with our blue “Brand A” S&L Plot, to make a single
combined “Back to Back” S&L Plot as shown on next slide.
LEAF STEM
8 8 7 5 0
9 7 4 1 0 1
2 2 2 1 2
8 6 4 2 0 3
4
5
1 6
7
13. “Brand B” LEAF STEM LEAF “Brand A”
8 8 7 5 0 7
9 7 4 1 0 1 0 5 5 5 7 9 Key: 6|1 =
2 2 2 1 2 0 2 2 6 7 61 hours
8 6 4 2 0 3 0 2 4 6 8
4
5 6
1 6
7 5
We made this “Back to Back” Stem and Leaf Diagram by
flipping the Red Brand B Diagram around the other way,
and merging it with the Blue Brand A Diagram, to that they
now share the same set of stems down the middle.
Making the BACK TO BACK Stem & Leaf Plot
Conclusion:
The Battery
Life is about
the same.