Downloaded 121 times
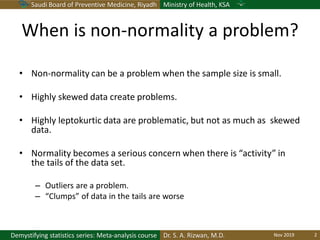
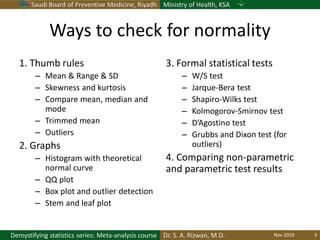
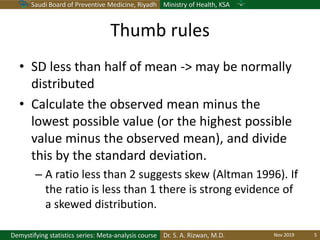
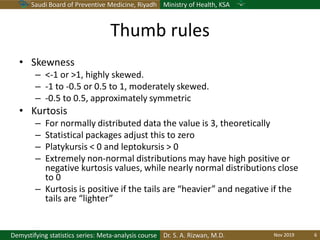
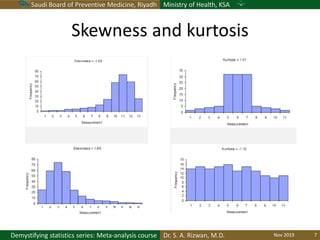
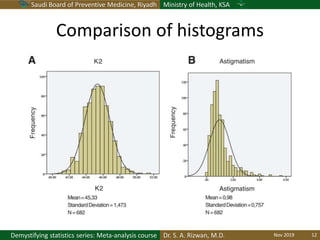
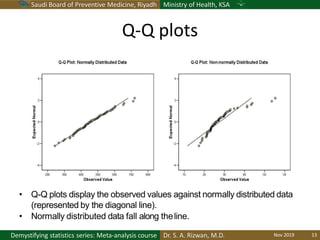
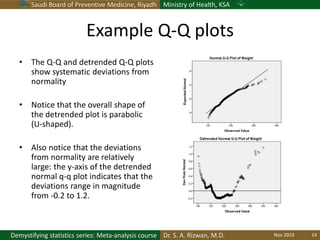
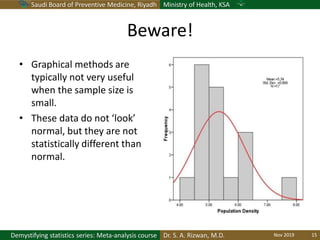
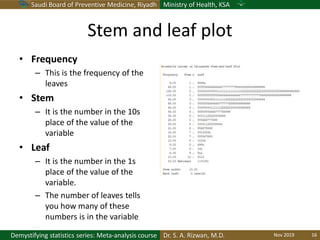
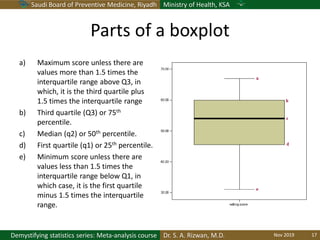
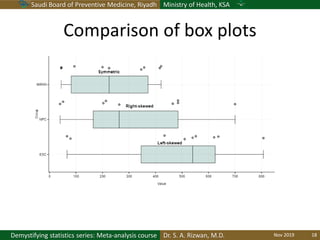
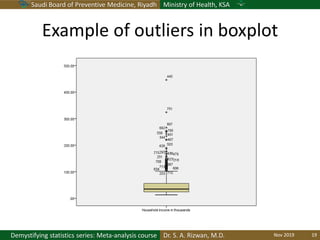
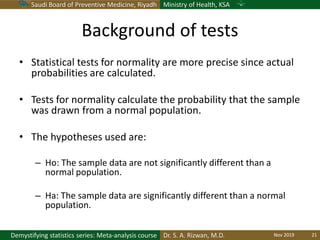
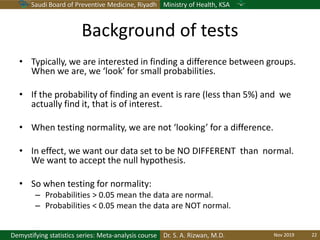
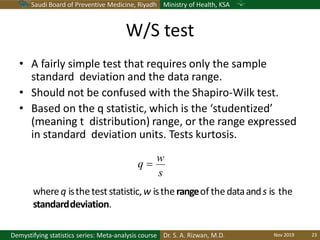
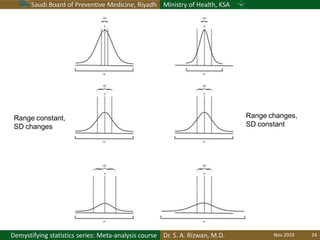
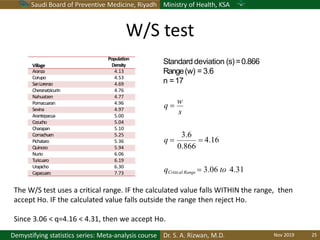
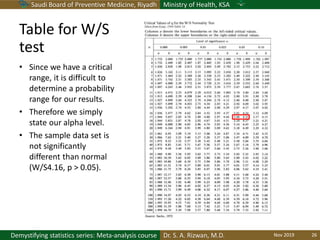
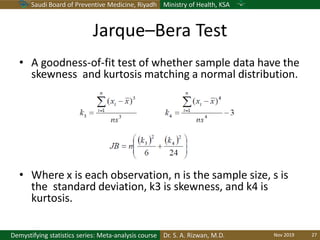
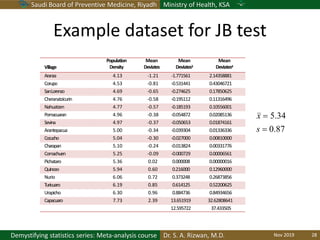
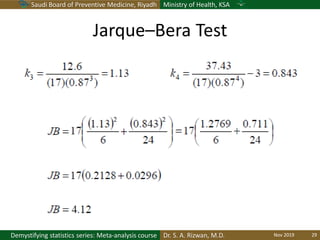
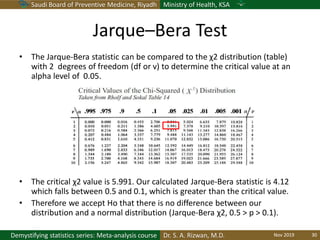
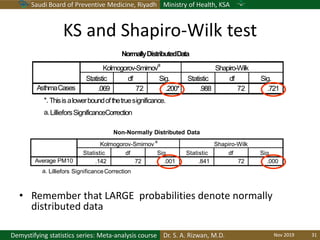
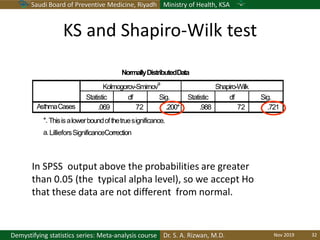
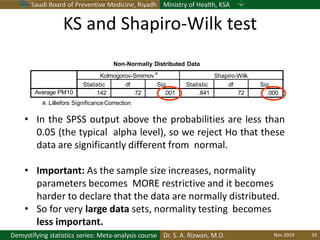
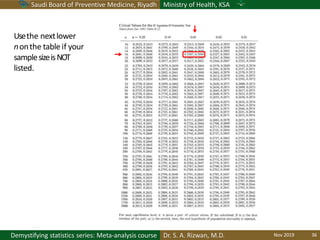
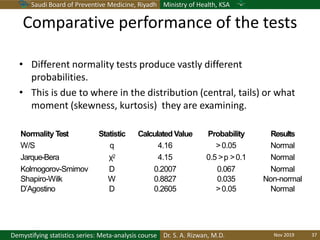
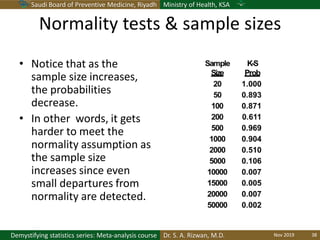
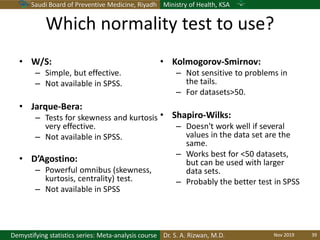
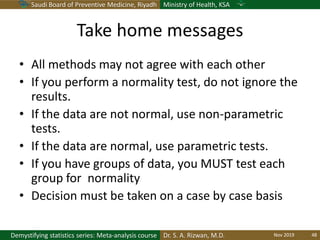

The document discusses methods for checking the normality of data distributions. It covers thumb rules like comparing the mean and standard deviation, examining skewness and kurtosis values, and ensuring the mean, median and mode are equal. Graphical methods like histograms, Q-Q plots, boxplots and stem-and-leaf plots are presented to visually assess normality. Formal statistical tests for normality are also described, including the Shapiro-Wilk, Kolmogorov-Smirnov, Jarque-Bera and D'Agostino tests. The document uses examples to demonstrate how to apply and interpret these various techniques for evaluating if a data set comes from a normal distribution.


![PERI-PROSTHETIC FRACTURE NAIL-PLATE CONSTRUCT [NPC].pptx](https://cdn.slidesharecdn.com/ss_thumbnails/drarunkumardrmohamedashrafperiprostheticfrasturenail-plateconstructnpc-260209164459-7e9d15a1-thumbnail.jpg?width=640&height=640&fit=bounds)


![ONFH[AVN HIP] -TRIPLE REGIME -A NOVAL SURGICAL CONCEPT .pptx](https://cdn.slidesharecdn.com/ss_thumbnails/onfhavnhip2026koaconcalicutdrgokuldevdrmashraf-260210064517-213ec005-thumbnail.jpg?width=640&height=640&fit=bounds)


