Download to read offline

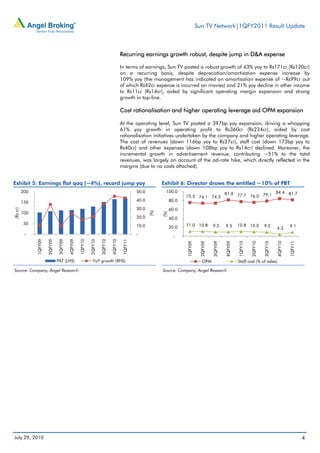
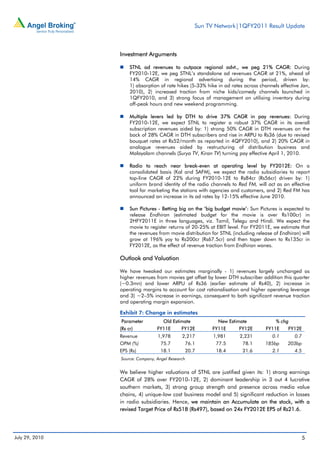
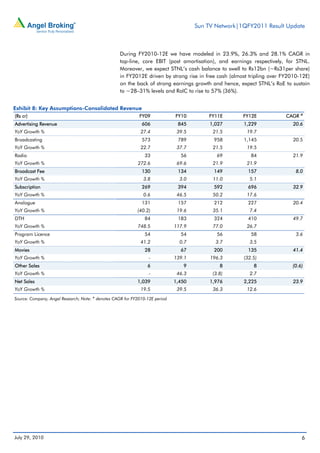
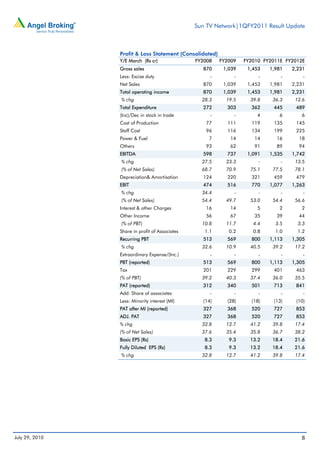

Sun TV reported strong 1QFY2011 results with 53% year-over-year revenue growth and 43% PAT growth. Revenues grew due to a 50% increase in advertising revenue, 84% growth in DTH subscription revenue, and 42% growth in analogue subscription revenue. Operating margins expanded 397 basis points to 81.7% due to cost rationalization and operating leverage. The company maintained its Accumulate rating based on continued earnings and cash flow growth despite increasing its FY2012 EPS estimates 2-5% to account for margin expansion.