Download to read offline

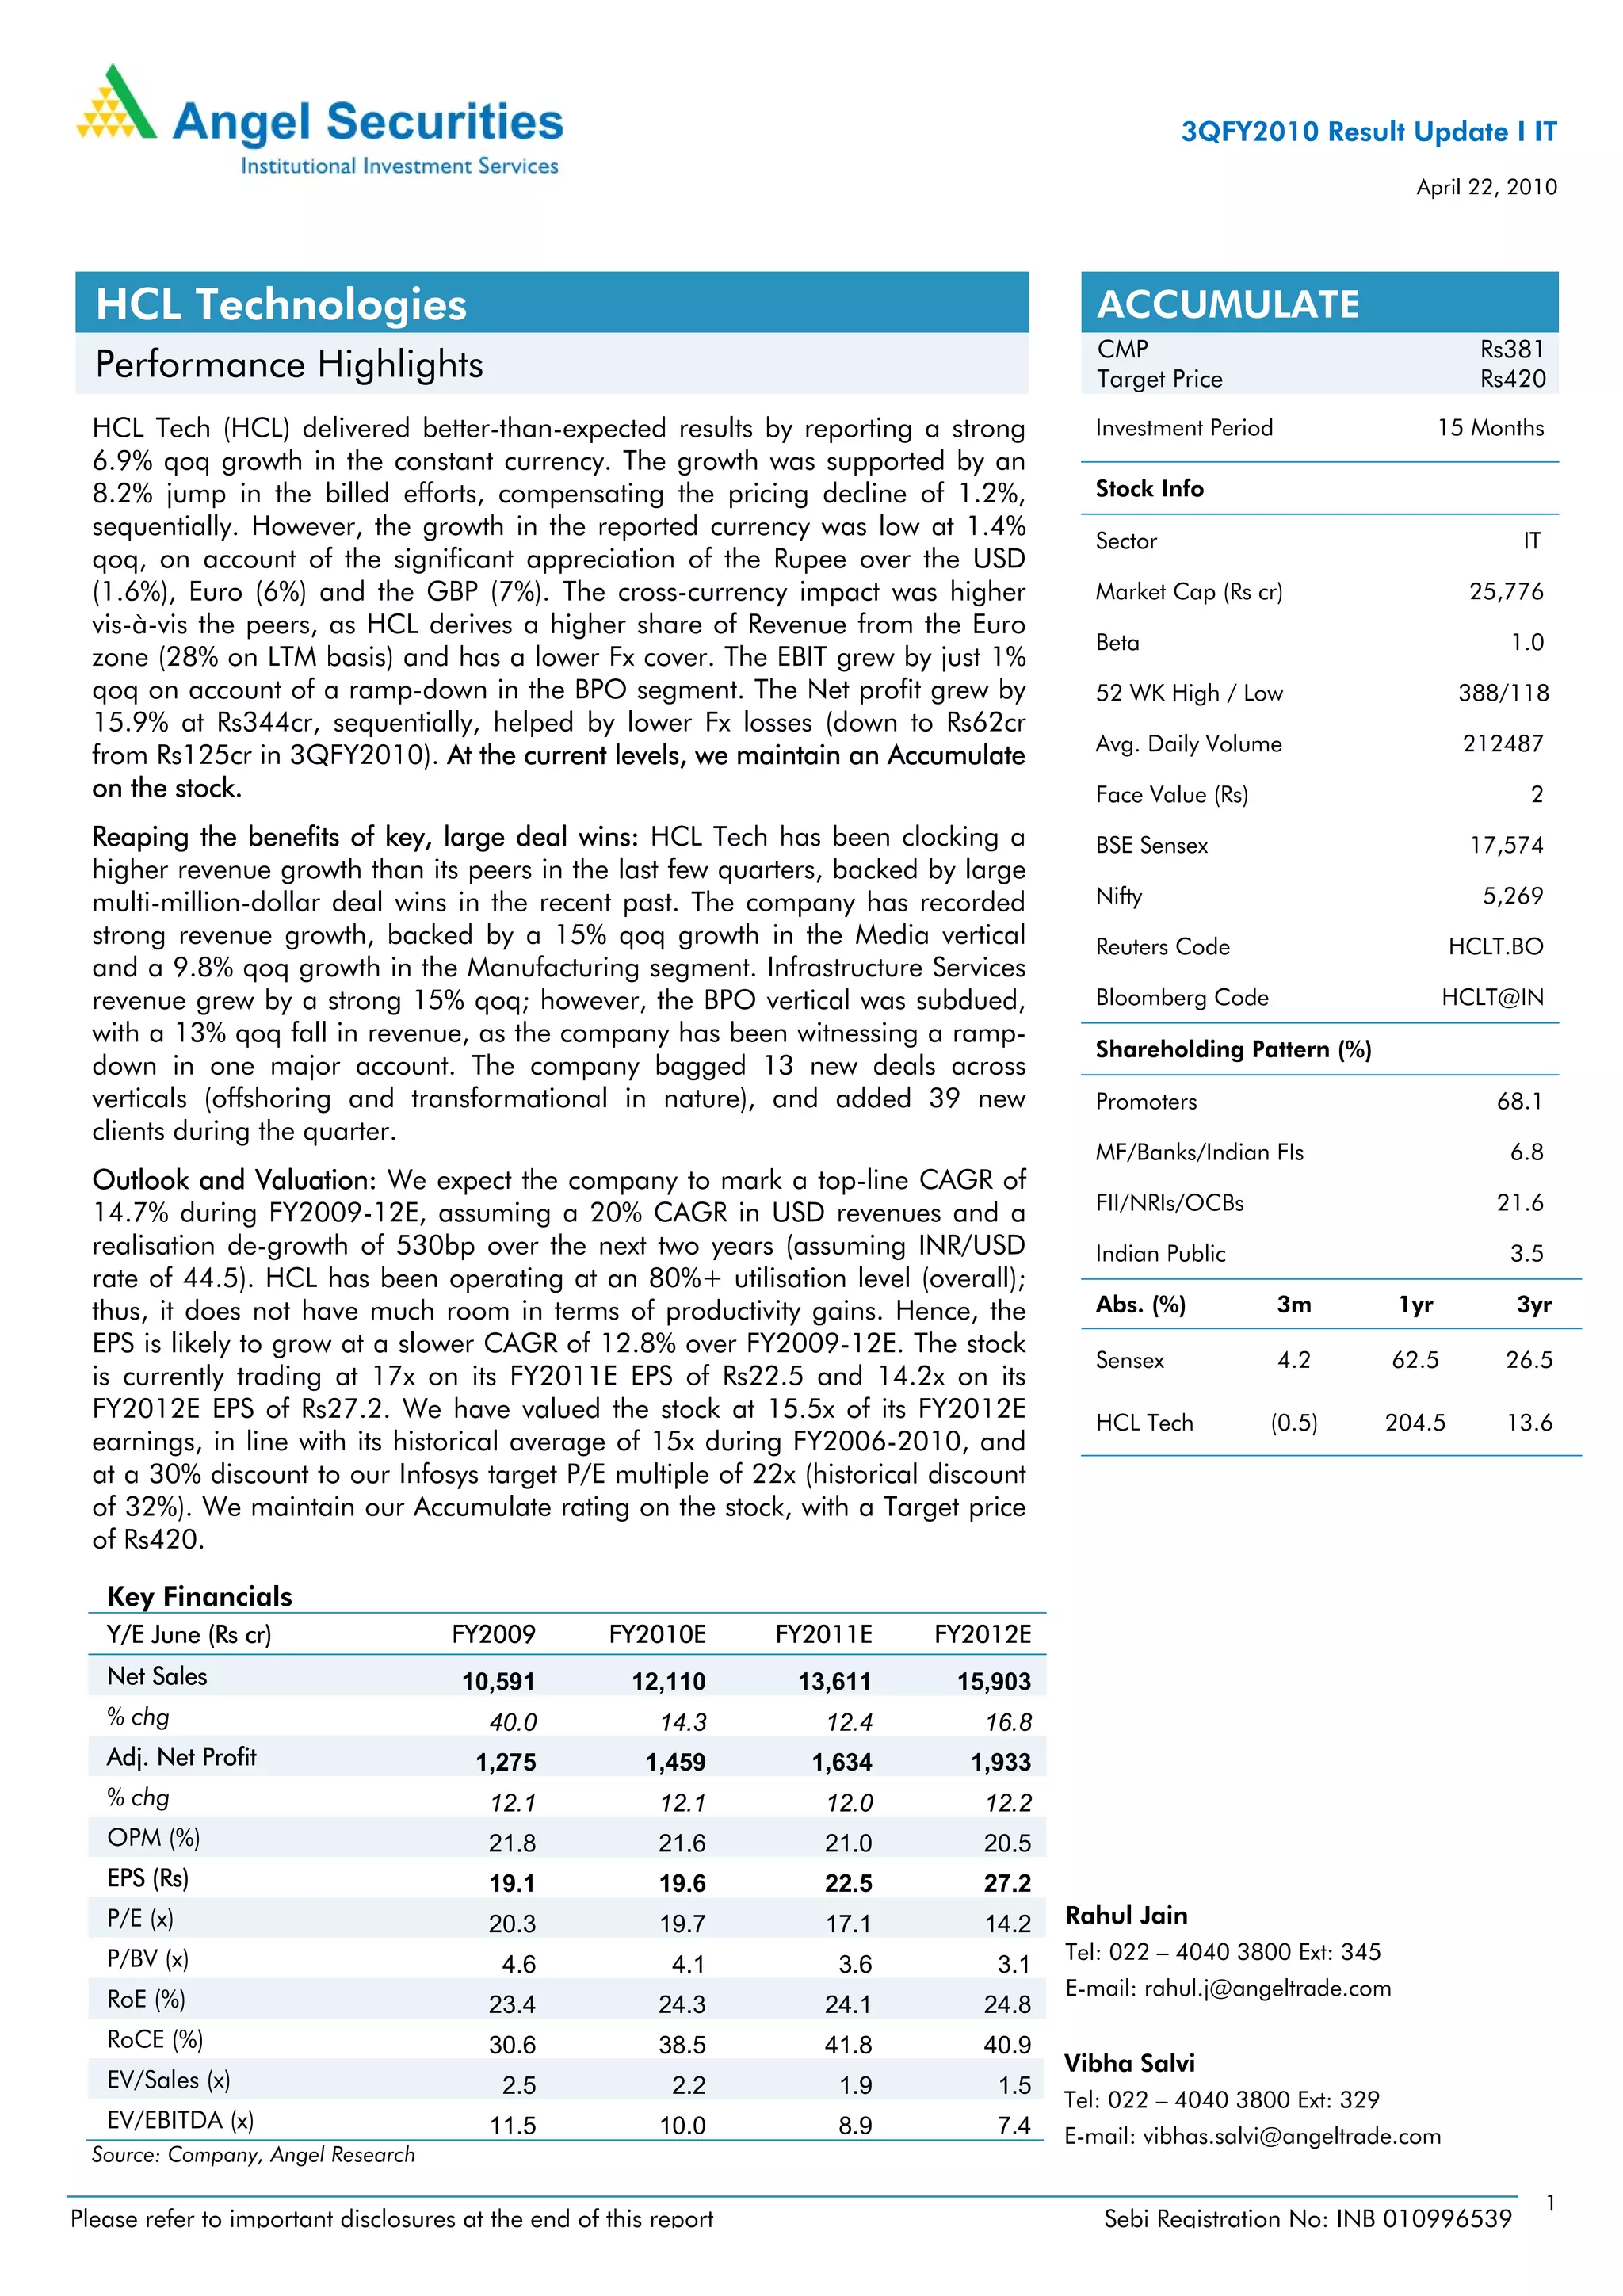
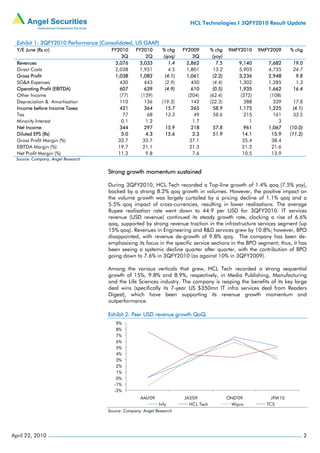
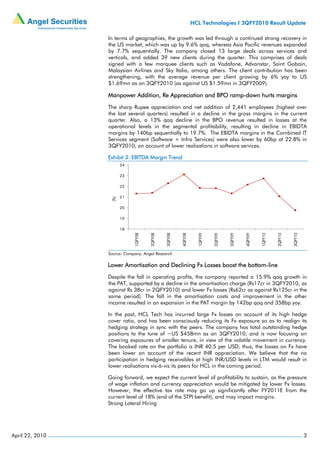
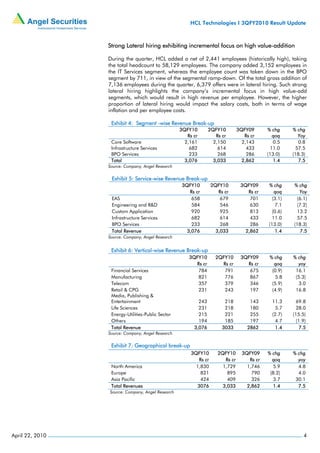
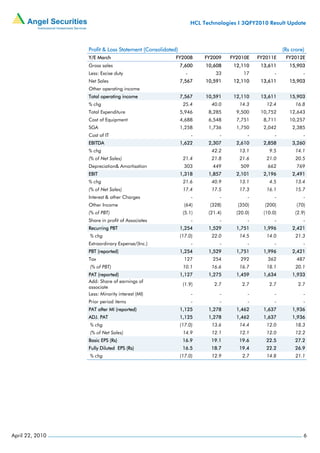

HCL Technologies reported quarterly revenue growth of 1.4% sequentially and 7.5% year-over-year, driven by an 8.2% increase in billed efforts that offset a 1.2% decline in pricing and currency impact. Operating profit grew 1% sequentially due to a ramp-down in the BPO segment. Net profit increased 15.9% sequentially due to lower foreign exchange losses. The company added 2,441 employees during the quarter and won several large deals. Margins declined due to currency appreciation and increased hiring but profitability is expected to be sustained going forward.


