1. 1QFY2011 Result Update | Power
August 6, 2010
GIPCL BUY
CMP Rs113
Performance Highlights Target Price Rs135
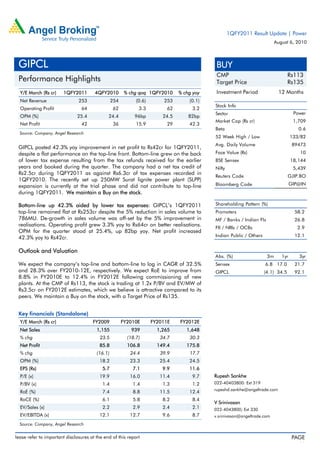
Y/E March (Rs cr) 1QFY2011 4QFY2010 % chg qoq 1QFY2010 % chg yoy Investment Period 12 Months
Net Revenue 253 254 (0.6) 253 (0.1)
Stock Info
Operating Profit 64 62 3.3 62 3.2
Sector Power
OPM (%) 25.4 24.4 96bp 24.5 82bp
Market Cap (Rs cr) 1,709
Net Profit 42 36 15.9 29 42.3
Beta 0.6
Source: Company, Angel Research
52 Week High / Low 133/82
Avg. Daily Volume 89473
GIPCL posted 42.3% yoy improvement in net profit to Rs42cr for 1QFY2011,
despite a flat performance on the top-line front. Bottom-line grew on the back Face Value (Rs) 10
of lower tax expense resulting from the tax refunds received for the earlier BSE Sensex 18,144
years and booked during the quarter. The company had a net tax credit of Nifty 5,439
Rs2.5cr during 1QFY2011 as against Rs6.3cr of tax expenses recorded in
Reuters Code GJIP.BO
1QFY2010. The recently set up 250MW Surat lignite power plant (SLPP)
expansion is currently at the trial phase and did not contribute to top-line Bloomberg Code GIP@IN
during 1QFY2011. We maintain a Buy on the stock.
Bottom-line up 42.3% aided by lower tax expenses: GIPCL’s 1QFY2011 Shareholding Pattern (%)
top-line remained flat at Rs253cr despite the 5% reduction in sales volume to Promoters 58.2
786MU. De-growth in sales volume was off-set by the 5% improvement in MF / Banks / Indian Fls 26.8
realisations. Operating profit grew 3.3% yoy to Rs64cr on better realisations.
FII / NRIs / OCBs 2.9
OPM for the quarter stood at 25.4%, up 82bp yoy. Net profit increased
42.3% yoy to Rs42cr. Indian Public / Others 12.1
Outlook and Valuation
Abs. (%) 3m 1yr 3yr
We expect the company’s top-line and bottom-line to log in CAGR of 32.5% Sensex 6.8 17.0 21.7
and 28.3% over FY2010-12E, respectively. We expect RoE to improve from GIPCL (4.1) 34.5 92.1
8.8% in FY2010E to 12.4% in FY2012E following commissioning of new
plants. At the CMP of Rs113, the stock is trading at 1.2x P/BV and EV/MW of
Rs3.5cr on FY2012E estimates, which we believe is attractive compared to its
peers. We maintain a Buy on the stock, with a Target Price of Rs135.
Key financials (Standalone)
Y/E March (Rs cr) FY2009 FY2010E FY2011E FY2012E
Net Sales 1,155 939 1,265 1,648
% chg 23.5 (18.7) 34.7 30.3
Net Profit 85.8 106.8 149.4 175.8
% chg (16.1) 24.4 39.9 17.7
OPM (%) 18.2 23.3 25.4 24.5
EPS (Rs) 5.7 7.1 9.9 11.6
P/E (x) 19.9 16.0 11.4 9.7 Rupesh Sankhe
P/BV (x) 1.4 1.4 1.3 1.2 022-40403800: Ext 319
rupeshd.sankhe@angeltrade.com
RoE (%) 7.4 8.8 11.5 12.4
RoCE (%) 6.1 5.8 8.2 8.4
V Srinivasan
EV/Sales (x) 2.2 2.9 2.4 2.1 022-4043800; Ext 330
EV/EBITDA (x) 12.1 12.7 9.6 8.7 v.srinivasan@angeltrade.com
Source: Company, Angel Research
lease refer to important disclosures at the end of this report PAGE
*
3. GIPCL | 1QFY2011 Result Update
Operational Highlights
In 1QFY2011, GIPCL’s total power generation stood at 786MU. Power
generation at the Vadodara stations I and II stood at 303MU and 277MU,
respectively. The company’s 250MW Surat lignite power plant-I (SLPP-I)
generated 509MU during the quarter. PLF of the 145MW Vadodara-I facility
remained flat at 95.5% (95.0%), while PLF of the 165MW Vadodara-II
declined by 349bp to 76.8% (80.3%). PLF of the 250MW SLPP-I fell by 578bp
to 93.2% (99.0%) during the quarter.
Exhibit 3: Operational performance of plants
100 95 96 93
89
86 84 83
80
80 80 77 77
74
60
(%)
40
20
0
FY2008 FY2009 FY2010 1QFY2011
Vadodara Station I - 145MW Vadodara Station II - 165MW SLPP I- 250MW
Source: Company, Angel Research
Investment Arguments
Capacity addition to drive growth: The company recently set up power plants
at Surat (125MW*2), at a cost of Rs1,630cr. The plants were declared
commercially during 1QFY2011 and are currently at the trial stage. Lignite for
the plant will be procured from the company’s captive mines in Surat,
developed exclusively for the project. This expansion is expected to boost the
company’s profitability and significantly improve cash flows going ahead.
Further, with the commissioning of this Rs1,630cr plant, the company’s RoE is
expected to improve substantially going ahead
The company also plans to develop a new 600MW lignite-based power plant
in Surat, and is in the midst of examining the feasibility of the project. With
this, the company intends to make the best use of the coal mine in its
possession, which has adequate lignite to support 1,000MW of power
generation for 35 years.
August 6, 2010 3
4. GIPCL | 1QFY2011 Result Update
Exhibit 4: Snapshot of projects
Capacity Guaranteed
Plant Fuel Type Off-take arrangement
(MW) RoE (%)
Vadodara- Supplied to promoter companies Not
145 Gas/RLNG
I namely GACL, GUVNL, GSFC applicable
Vadodara-
160 Gas/RLNG Supplied to GUVNL under PPA 13.0
II
SLPP - I 250 lignite Supplied to GUVNL under PPA 13.0
SLPP - II 250 lignite Supplied to GUVNL under PPA 15.5
Source: Company, Angel Research
Gas availability has improved: Currently, 310MW out of the company’s overall
capacity is based on natural gas. The improved availability of gas from KG-D6
has provided more fuel security to the company.
Assured off-take: A major portion of the power generated by GIPCL is sold to
the Gujarat Electricity Board (GEB). In the last seven years, there has been
significant improvement in GEB’s financial performance, which augurs well for
GIPCL going ahead
Outlook and Valuation
We remain positive on the domestic power industry, as we expect it to grow in
line with the country’s GDP growth. India’s peak power demand (in excess of
11%) gives substantial opportunity to players like GIPCL. Moreover, in the last
few years, there has been significant improvement in GEB’s financial position,
which will indirectly benefit GIPCL, as it sells around 80% of its power to GEB,
- it is GIPCL’s single largest customer. The company’s expansion plans are
also on track, which we believe will help it continue on growth path.
We expect the company’s to register CAGR of 32.5% and 28.3% in top-line
and bottom-line respectively, over FY2010E-12E. We expect RoE to improve
from 8.8% in FY2010 to 12.4% in FY2012E following commissioning of new
plants. At the CMP of Rs113, the stock is trading at 1.2x P/BV and EV/MW of
Rs3.5cr on its FY2012E estimates, which we believe is attractive compared to
its peers. We maintain a Buy on the stock, with a Target Price of Rs135.
August 6, 2010 4
5. GIPCL | 1QFY2011 Result Update
Exhibit 5: Change in estimates
(Rs cr) FY2011E FY2012E
Earlier Revised Variation (%) Earlier Revised Variation (%)
Net Sales 1,422 1,265 (11.0) 1,727 1,648 (4.6)
Operating Exp 1,092 943 (13.6) 1,325 1,245 (6.0)
Operating Profit 330 321 (2.7) 402 403 0.2
Depreciation 116 106 (8.6) 138 138 -
Interest 51 51 - 65 65 -
PBT 177 178 0.6 213 215 0.9
Tax 32 29 (9.4) 31 38 22.6
PAT 145 149 2.8 181 177 (2.2)
Source: Company, Angel Research
Exhibit 6: Key assumptions
FY2011E FY2012E
Earlier Revised Earlier Revised
PLF (%)
Vadodara Station I 73 73 74 74
Vadodara Station II 74 72 75 73
SLPP - I&II 70 60 80 80
Units sold (MU)
Vadodara Station I 927 927 940 940
Vadodara Station II 1,037 1,009 1,051 1,023
SLPP - I&II 3,066 2,628 3,504 3,504
Source: Company, Angel Research
Exhibit 7: One year forward P/BV band
200 0.5x 1x 1.5x 2x
150
Share Price (Rs)
100
50
0
Apr-05 Apr-06 Apr-07 Apr-08 Apr-09 Apr-10
Source: Company, Angel Research
August 6, 2010 5
11. GIPCL | 1QFY2011 Result Update
Research Team Tel: 022 - 4040 3800 E-mail: research@angeltrade.com Website: www.angeltrade.com
Disclaimer
This document is solely for the personal information of the recipient, and must not be singularly used as the basis of any investment
decision. Nothing in this document should be construed as investment or financial advice. Each recipient of this document should make
such investigations as they deem necessary to arrive at an independent evaluation of an investment in the securities of the companies
referred to in this document (including the merits and risks involved), and should consult their own advisors to determine the merits and
risks of such an investment.
Angel Broking Limited, its affiliates, directors, its proprietary trading and investment businesses may, from time to time, make
investment decisions that are inconsistent with or contradictory to the recommendations expressed herein. The views contained in this
document are those of the analyst, and the company may or may not subscribe to all the views expressed within.
Reports based on technical and derivative analysis center on studying charts of a stock's price movement, outstanding positions and
trading volume, as opposed to focusing on a company's fundamentals and, as such, may not match with a report on a company's
fundamentals.
The information in this document has been printed on the basis of publicly available information, internal data and other reliable
sources believed to be true, but we do not represent that it is accurate or complete and it should not be relied on as such, as this
document is for general guidance only. Angel Broking Limited or any of its affiliates/ group companies shall not be in any way
responsible for any loss or damage that may arise to any person from any inadvertent error in the information contained in this report.
Angel Broking Limited has not independently verified all the information contained within this document. Accordingly, we cannot testify,
nor make any representation or warranty, express or implied, to the accuracy, contents or data contained within this document. While
Angel Broking Limited endeavours to update on a reasonable basis the information discussed in this material, there may be regulatory,
compliance, or other reasons that prevent us from doing so.
This document is being supplied to you solely for your information, and its contents, information or data may not be reproduced,
redistributed or passed on, directly or indirectly.
Angel Broking Limited and its affiliates may seek to provide or have engaged in providing corporate finance, investment banking or
other advisory services in a merger or specific transaction to the companies referred to in this report, as on the date of this report or in
the past.
Neither Angel Broking Limited, nor its directors, employees or affiliates shall be liable for any loss or damage that may arise from or in
connection with the use of this information.
Note: Please refer to the important `Stock Holding Disclosure' report on the Angel website (Research Section). Also, please refer to the
latest update on respective stocks for the disclosure status in respect of those stocks. Angel Broking Limited and its affiliates may have
investment positions in the stocks recommended in this report.
Disclosure of Interest Statement GIPCL
1. Analyst ownership of the stock No
2. Angel and its Group companies ownership of the stock No
3. Angel and its Group companies' Directors ownership of the stock No
4. Broking relationship with company covered No
Note: We have not considered any Exposure below Rs 1 lakh for Angel, its Group companies and Directors.
Ratings (Returns) : Buy (> 15%) Accumulate (5% to 15%) Neutral (-5 to 5%)
Reduce (-5% to 15%) Sell (< -15%)
August 6, 2010 11